#NIFTY Intraday Support and Resistance Levels - 18/11/2025Nifty is opening with a strong gap-up above 26,050, which places the index directly above the key resistance zone it has been struggling to cross for the last few sessions. This type of opening generally indicates bullish continuation, provided the index sustains above 26,050 in the first 10–15 minutes.
If Nifty holds above 26,050, the upside momentum can extend toward 26,150, 26,200, and 26,250+, making long trades valid and high-probability. This level is now the immediate intraday support. Any quick pullback into this zone may also act as a retest entry for buyers.
If the index continues its strength and crosses 26,250, expect another leg of bullish movement toward 26,350, 26,400, and 26,450+. This upper breakout zone is cleaner and can trigger faster trending moves if volume supports it.
On the downside, weakness appears only if Nifty slips below 25,950–25,900, where short trades activate toward 25,850, 25,800, and 25,750-. Until then, sellers will likely stay on the sidelines.
Because of the gap-up, initial volatility may be sharp. Let price stabilise above 26,050 before taking fresh long trades. Overall bias remains strongly positive unless Nifty falls back below the support zone.
Trade ideas

NIFTY : Trading levels and Plan for 18-Nov-2025📊 NIFTY TRADING PLAN — 18 NOV 2025
(Timeframe Reference: 15-Min Chart)
Chart Summary:
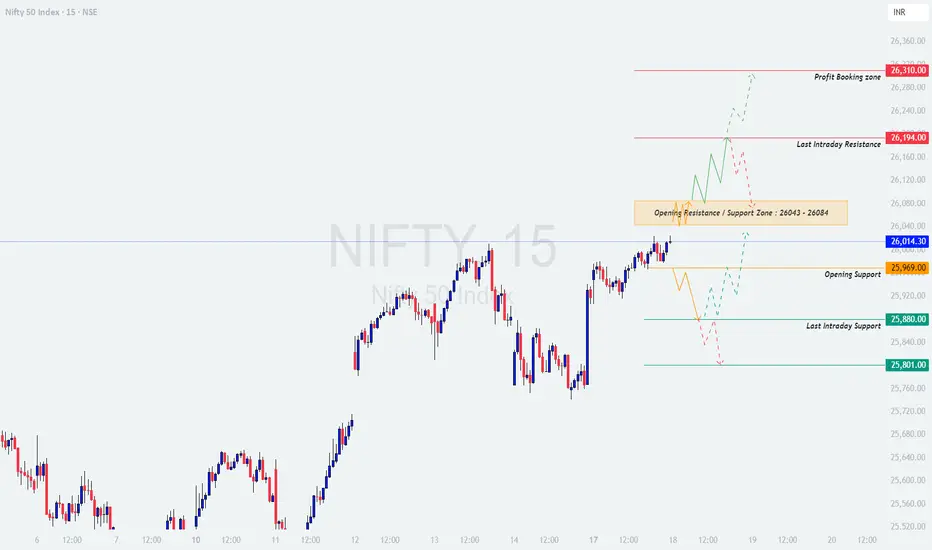
Nifty closed near 26,014 , maintaining a strong recovery momentum with higher highs formation. The index is currently hovering just below the Opening Resistance / Support Zone (26,043 – 26,084) , suggesting that 18th November could be a pivotal session for short-term trend continuation or reversal.
Immediate resistance is visible at 26,194 (Last Intraday Resistance) and a Profit Booking Zone near 26,310 . On the downside, the nearest supports are located at 25,969 (Opening Support) and 25,880 – 25,801 (Last Intraday Support Zone) .
The structure favors a bullish bias as long as price sustains above 25,969 , but traders should remain cautious around higher resistances where profit-taking may emerge.
Key Zones to Watch:
🟩 Supports: 25,969 / 25,880 / 25,801
🟥 Resistances: 26,084 / 26,194 / 26,310
⚖️ Bias: Bullish above 26,084 | Bearish below 25,969
🟢 Scenario 1: GAP-UP Opening (100+ Points)
If Nifty opens around 26,120 – 26,180 , it will start near the Last Intraday Resistance (26,194) . Such openings near resistance often cause early hesitation or consolidation before direction becomes clear.
If price sustains above 26,194 for 15–20 minutes with strong volume, expect a quick move toward the Profit Booking Zone (26,310) .
A breakout above 26,194 followed by a successful retest offers a low-risk buying opportunity for 26,270–26,310 targets.
If rejection candles (like upper wicks or bearish engulfing) appear near 26,194 – 26,310 , expect a short-term pullback toward 26,084 – 26,000 .
Avoid chasing the initial gap-up rally; instead, wait for price to confirm strength or provide a retest entry.
💡 Educational Insight:
Gap-up openings near resistance zones test trader psychology. Retail traders often buy impulsively at highs — professionals wait for confirmation of sustained strength. Always let price action validate breakout continuation before committing capital.
🟧 Scenario 2: FLAT Opening (Around 26,000 – 26,040 Zone)
A flat opening near 26,014 keeps Nifty right within the Opening Resistance / Support Zone (26,043 – 26,084) . This zone acts as a decision point — a breakout could continue bullish momentum, while rejection could trigger short-term correction.
If the index sustains above 26,084 , expect bullish continuation toward 26,194 – 26,310 .
If the index faces rejection and falls below 25,969 , a short-term retracement toward 25,880 – 25,801 is likely.
Avoid taking trades inside 26,000 – 26,080 initially — this zone may witness indecision.
Wait for a strong directional candle close outside the range for trade confirmation.
🧠 Educational Tip:
Flat openings are common near key inflection zones. Avoid being the first to act — let the first 15 minutes set the tone. Volume-backed breakouts from such zones often lead to sustained moves.
🔴 Scenario 3: GAP-DOWN Opening (100+ Points)
If Nifty opens around 25,900 – 25,850 , it will open below the Opening Support (25,969) and closer to the Last Intraday Support Zone (25,880 – 25,801) . This area will be critical to watch for either a quick reversal or extended weakness.
If reversal candles (hammer or bullish engulfing) appear near 25,880 – 25,801 , expect a recovery toward 26,000 – 26,043 .
If the price fails to sustain above 25,880 , bearish momentum may drag Nifty toward 25,700 – 25,600 .
Avoid panic shorting after gap-downs — let the market test supports first.
Watch for volume divergence: if selling volume declines near support, it signals exhaustion and possible intraday reversal.
📘 Educational Note:
Gap-down openings are emotional traps for retail participants. Professionals focus on reaction, not the gap itself. A strong bounce from support zones often provides safer and more rewarding opportunities than chasing fear-driven momentum.
💼 RISK MANAGEMENT TIPS FOR OPTIONS TRADERS:
Avoid trading during the first 15 minutes of market open — volatility is highest and direction unclear.
Never risk more than 1–2% of your capital per trade .
Use ATM or slightly ITM options for directional trades — they move more effectively with price.
Trail stop-loss once the position gains 30–40 points in your favor — protect profits.
Book partial profits at intermediate zones (like 26,084 / 26,194) and hold the rest with SL.
Avoid averaging losing trades — discipline is key.
When in doubt or volatility spikes unexpectedly, step aside; missing a trade is better than forcing one.
⚠️ Golden Rule:
Focus on capital protection over profit chasing . Consistency builds wealth — not aggression.
📈 SUMMARY:
🟩 Key Supports: 25,969 / 25,880 / 25,801
🟥 Key Resistances: 26,084 / 26,194 / 26,310
⚖️ Bias: Bullish above 26,084 | Bearish below 25,969
🎯 Intraday Levels to Watch:
- Breakout above 26,084 → Target 26,194 → 26,310
- Breakdown below 25,969 → Target 25,880 → 25,801
📚 CONCLUSION:
Nifty stands at a critical juncture, oscillating just below major resistance. A breakout above 26,084 can open the path toward 26,310 , while a breakdown below 25,969 may trigger intraday profit booking toward 25,880 – 25,801 .
For 18th November, the key lies in the opening reaction — whether the market builds on momentum or witnesses short-term exhaustion. Stay disciplined, trade only post-confirmation, and align your direction with trend and volume.
📊 Trading success lies not in predicting the move, but in reacting wisely to what unfolds.
⚠️ DISCLAIMER:
I am not a SEBI-registered analyst . The views shared here are purely for educational and informational purposes . Please conduct your own analysis or consult a certified financial advisor before making any trading or investment decisions.
Did NIFTY just turned bullish!? As we can see NIFTY managed to close itself above 26000 showing a bullish bias. Moreover, we can see NIFTY forming more like an inverted head and shoulders pattern in bigger time frame which is a strong bullish signal as this level has been tested multiple time making it weaker hence any closing above previous swing can show strong upmove! So plan your trades accordingly and keep watching everyone.

Do Moon Phases Affect the Stock Market? (NIFTY)Do Moon Phases Affect the Stock Market?
The idea that lunar phases influence stock markets is a popular topic in financial astrology and behavioral finance.
Bottom Line ( GOCK SAYS)
There is no reliable, persistent relationship between moon phases and stock market returns in the 21st century. Any historical pattern was likely spurious or behavioral and has vanished with globalization, algorithmic trading, and better information flow.
If someone is selling you a “lunar cycle trading system” in 2025, treat it as entertainment, not edge.
It is human tendency that what relation can there be between the stock market and the phase of the moon.
Friends, over the last 1 year I would like to show you that after the new moon the market repeatedly moves downwards and this is at least 80% accurate and the tides are caused by the moon, so they have an effect on the human mind and you will be able to see that the bullish sentiment will continue in the market for the next 3 days i.e. till the 20th.
You will not see any weakness in the market before

Nifty 26150 soon in one day or twoNifty 26150 is next target for nifty . Tomorrow expect a good opening then price will continue to touch 26150 . Then what ?
Will plan next move after watching the price action movement at 26150.

NIFTY : HIT or MISS? Next Move Explained🧠 Nifty Elliott Wave Analysis | Accurate Highs & Bottoms Predicted | Next Move Explained
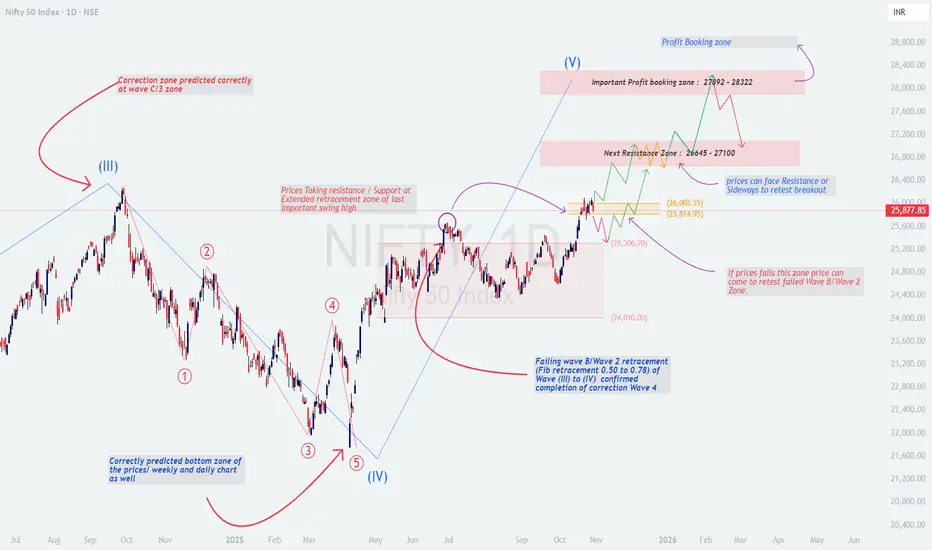
I had accurately predicted both the top (Wave III) and the bottom (Wave IV) of the Nifty move — as seen in the attached chart 📈
The corrective zone at Wave C / 3 and the final retracement completion around Wave 4 were both identified in advance, confirming the accuracy of our earlier projection.
🔍 Current Technical Outlook
Nifty has completed its Wave (IV) correction and is now attempting to form an impulsive Wave (V) move.
Price is currently trading around 25,880, taking resistance near the extended retracement zone of the previous swing high.
If this level is crossed and sustained, the next upside momentum can unfold in multiple stages as shown below.
📈 Upside Projections
Next Resistance Zone: 26,645 – 27,100
🔸 Price may slow down or move sideways to retest the breakout here.
Major Profit Booking Zone: 27,892 – 28,322
🔸 This is a key Fibonacci extension and Wave (V) target area where partial booking is advised.
⚙️ Support & Risk Levels
Immediate Support: 25,814 – 26,000
Major Support: 25,306
Critical Support / Reconfirmation Zone: 24,010 (Failed Wave B / Wave 2 zone)
📉 If prices fail to hold 25,800–25,300, we may see a retest toward 24,000–24,200, which would only delay but not invalidate the long-term bullish structure.
🧭 Expected Price Behaviour
As long as Nifty stays above 25,300, the Wave (V) uptrend remains intact.
Prices can show sideways consolidation or retest near the breakout before pushing higher.
Any strong breakout above 26,650–27,100 can open the gate for 28,000+ targets.
⚠️ Keep Watch & Stay Cautious
Watch for rejection candles or low-volume breakouts near 26,600–27,000 zone.
Stay alert for profit booking or reversal signals near 27,800+.
Ideal approach: Buy on dips, book partial profits near resistance, trail stop-loss.
📅 Posted on: 30 Oct 2025
nifty50 - weekly cnadle analysisCovid ko gye hue almost 6 saal hone wale hain.
Market ek baar phir se major correction ke edge pe lag rahi hai
Mark my words 2028 to 2032 will be India’s 🇮🇳 biggest bull run ever
I’m saying this purely from my experience and observation
Personal view. Not investment advice

Strong hands defending 25900–25950 bulls carry index above 26000The last two sessions have told a very clear story about who is in control of this market. Friday started as a negative-bias day, but at 3 pm Nifty printed a violent 5–15 minute thrust of nearly 170 points and completely flipped the tone. That late burst was not random noise – it was the breakout leg of this whole move.
The important detail is where that move paused. The large 3 pm candle on Friday left behind a reference zone around 25,900–25,950, with an intraday base near 25,913. On Monday, the index opened with only a mild gap-up and then spent the entire session respecting that level. On the 5-minute chart not a single candle managed a close below the 25,913 area. Every small dip into that band was bought, and from 11:30 onwards Nifty bounced off this zone and went on to make a series of higher highs and higher lows through the day.
This tells us two things. First, the buyers who stepped in aggressively late on Friday were not short-term scalpers; they are still defending their territory. Second, Friday’s last 15 minutes were not just short-covering – they marked the start of a new leg in the prevailing uptrend.
There was also a clear technical hurdle on the chart: the 26,009 region, which had earlier acted as a rejection point, and the broader 25,700–25,750 band that had been tested multiple times. Today the index finished the session around 26,014, closing above that prior supply zone. That is a constructive signal – the market has absorbed selling where it previously failed and is now accepting prices above 26,000.
On the daily timeframe, Nifty is riding a clean positive structure. Shorter moving averages are stacked above the longer ones and sloping up, confirming trend strength. The last several sessions have formed a rising sequence of lows from the 25,350–25,400 region up to the 25,900 area, while price keeps leaning against the 26,000 ceiling. Effectively, the index is carving out a rising base with horizontal resistance – an “ascending-triangle style” behaviour just under the old high zone. As long as 25,700–25,750 holds on a closing basis, this pattern favours an eventual breakout rather than a collapse.
The weekly chart only reinforces that picture. Nifty has logged multiple positive weeks in a row and is now trading very close to its record zone from late 2024. The broader setup is that of a market recovering from a deep correction earlier in the year and now grinding back towards the top of the range. With weekly momentum turning up and price holding above key moving averages, the burden of proof is on the bears.
Flows and macro data back this up. Foreign institutional investors have swung back to the buy side in the last session, and domestic institutions and mutual funds continue to provide strong support, more than offsetting earlier foreign outflows. That steady domestic bid has been one of the main reasons the index has been able to climb back to the 26,000 handle even when global cues have occasionally been shaky. Corporate earnings have been broadly supportive, especially in financials and select large caps, and recent upgrades from major global houses on India’s medium-term outlook are adding another layer of confidence.
Globally, the environment is not euphoric but it is no longer as hostile as it was earlier in the year. US indices are off their extremes, commodity prices are not in a runaway spike, and the dollar has cooled from its peak, all of which reduces pressure on emerging markets. At the same time, there are enough macro uncertainties left to keep traders disciplined – which is why every move into new high ground will still be tested.
From a trading perspective, the key reference zones now are:
Intraday support (5-min): 25,913 – as long as this area holds, dips on smaller timeframes are likely to find buyers.
Short-term support (daily): 25,700–25,750. A daily close below this band would be the first sign that the current breakout attempt is failing.
Immediate resistance: 26,100–26,200, which lines up with the previous all-time high zone. A strong close above this pocket would open the door for a fresh leg higher.
Deeper support (swing): 25,350–25,400 – the origin of the recent leg, and a line the bulls will not want to surrender.
Psychologically, the tape over the last two sessions shows a market where bad news and intraday dips are being used as opportunities to build long exposure rather than exit it. Friday’s late surge signalled that strong hands were stepping in aggressively; Monday’s action confirmed that they were willing to defend their entry zone and push the index to a higher close above prior resistance. Until we see a decisive break back below 25,700 with heavy volume and persistent selling, the path of least resistance remains up.
In simple terms: Nifty is in a healthy uptrend, strong money is clearly visible behind the last move, and the market just proved it can hold above 26,000. The next big test will be how it behaves when it gets closer to the 26,100–26,200 record area – but for now, the bulls still have the ball.

Breakout NiftyNifty is looking strong, high possibility of breakout because trend is strong, always buy near to your SL make sense usually people buy call or put on breakout instead wait till it comes to support zone if ur looking to buy or resistence zone if ur looking to sell

Nifty - Expiry day analysis Nov 18The price was bullish, but the movement was slow today as it was nearing the psychological zone of 26k. And we can see a small consolidation around this area, double top resistance. Sustaining above 26020 is important for further moves.
Buy above 26020 with the stop loss of 25960 for the targets 26060, 26100, 26160 and 26200.
Sell below 25860 with the stop loss of 25910 for the targets 25820, 25780, 25720, 25680 and 25640.
The expected expiry day range is 25800 to 26200.
Always do your analysis before taking any trade.
Nifty 50
* Market open near PDH and make a TR.
*Took sell position after 11:30 but market reverse from that and hit sl
*Again took sell after 13:25 but again got trapped.
* Missed the buy side trade
*Again break previous range and FOC again back in range,

NIFTY at major resistance levelThe up move which started on 8th Aug seems to be forming into an expanding triangle
Currently we're in Wave E which has reached 1.27 times of Wave C.
There's not yet a confirmation of a down move starting but should be cautious at this level.
Could be a good time to book partial profits.
Will keep you guys posted as the move advances and future possibilities
Stay Tuned...
HAPPY TRADING!

Nifty Intraday Analysis for 17th November 2025NSE:NIFTY
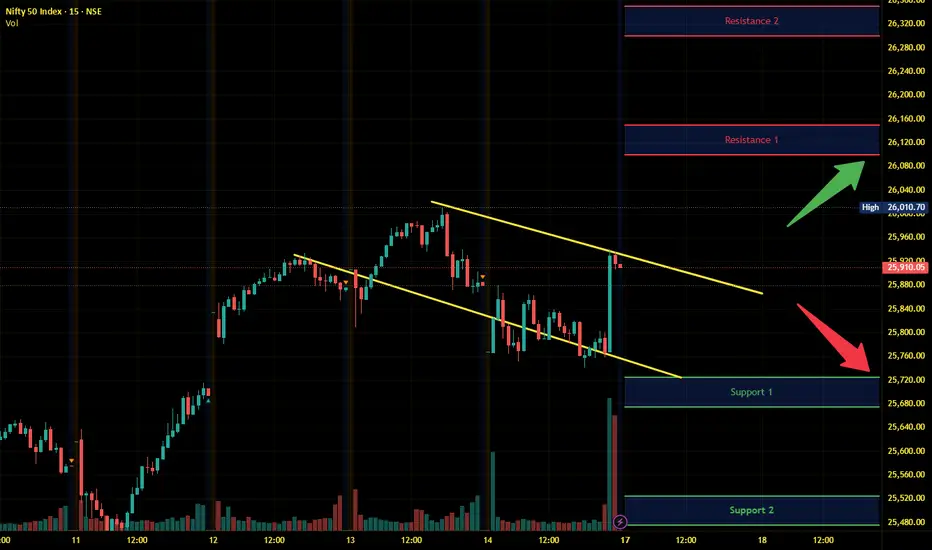
Index has resistance near 26100 – 26150 range and if index crosses and sustains above this level then may reach near 26300 – 26350 range.
Nifty has immediate support near 25725 – 25675 range and if this support is broken then index may tank near 25525 – 25475 range.
Nifty Analysis for Nov 17, 2025Wrap-up:
Nifty after breaking 38.20% level; retraces back in its strong resistance zone 25917-25937.
What I’m Watching for Nov 17, 2025 🔍
Short nifty in the strong resistance zone 25917-25937 SL 26011 for a target of 25582-25526 and 25042-25167 (SL on 15 min. candle close).
Disclaimer: Sharing my personal market view — only for educational purpose not financial advice.

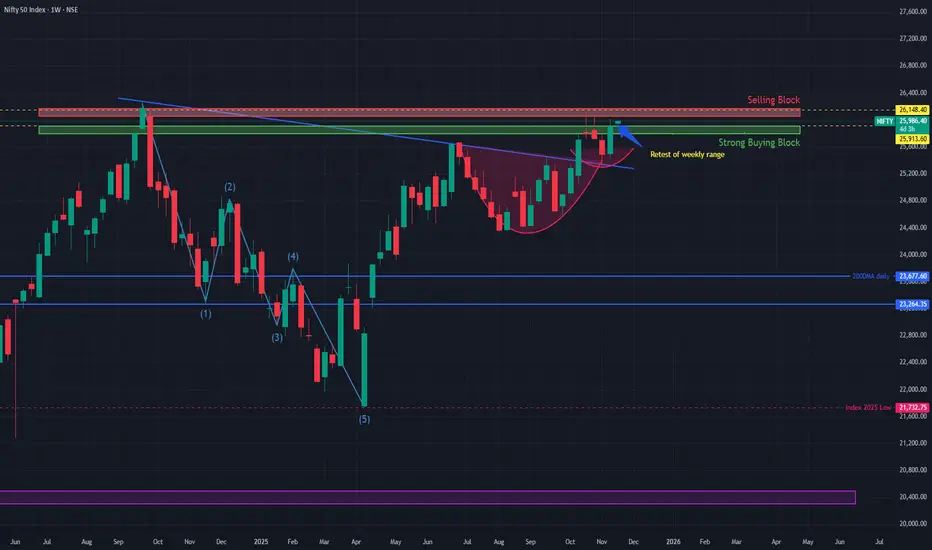
Cup & Handle & Momentum: Nifty’s Charge Toward New Highs !🚀 "Cup, Handle & Momentum: Nifty’s Charge Toward New Highs!"
📈 Understanding the Cup & Handle Pattern
The Cup & Handle is one of the most recognized bullish continuation patterns in technical analysis. It visually resembles a teacup:
Cup Formation: Prices decline from a peak, stabilize, and then gradually recover to retest the prior high. This rounded bottom reflects accumulation and investor confidence returning.
Handle Formation: After the cup completes, prices consolidate sideways or slightly downward, forming a smaller dip. This is the market’s “pause,” shaking out weak hands before the next leg higher.
Breakout: When price breaks above the handle’s resistance, it signals renewed buying interest and often leads to strong upward momentum.
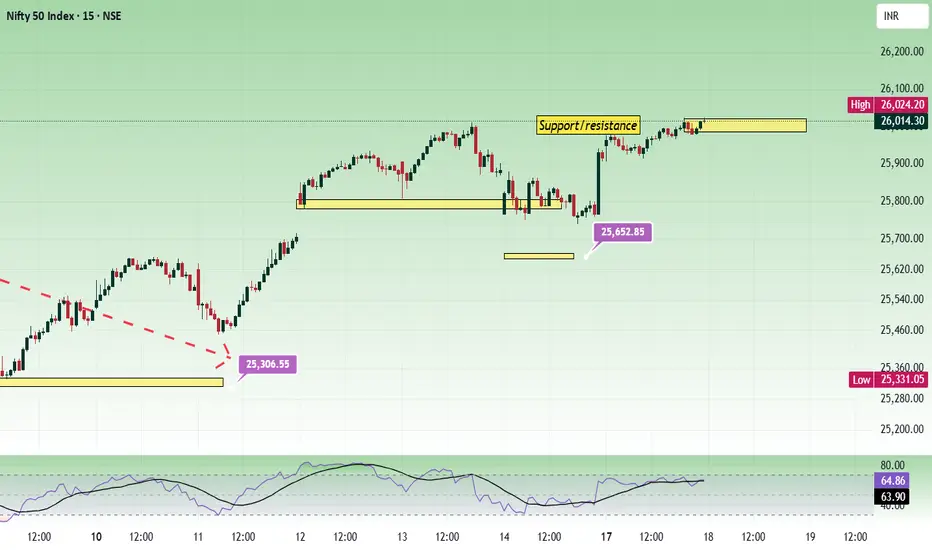
In the case of Nifty 50, the cup began forming after the September 2024 all-time high of 26,277. The recent breakout from the handle on the weekly chart suggests that the consolidation phase is complete, and buyers are back in control.
🔍 RSI: The Momentum Gauge
The Relative Strength Index (RSI) is a momentum oscillator that measures the speed and magnitude of price movements.
Range: RSI moves between 0 and 100.
Key Levels:
Above 50 → bullish momentum.
Sustaining above 60 → strong trend confirmation.
Above 70 → overbought, but in strong bull runs, RSI can remain elevated for extended periods.
Currently, Nifty’s RSI is holding above 50 and sustaining near 60, which indicates that momentum is not just positive but strengthening. This aligns perfectly with the breakout from the cup & handle pattern, reinforcing the probability of surpassing the previous high.
⚡ Why This Matters for Learners
Chart Patterns like the Cup & Handle teach us how collective psychology plays out in markets: fear, consolidation, and renewed optimism.
RSI adds a layer of confirmation, showing whether momentum supports the breakout or if it’s likely to fail.
Together, they provide a structured, disciplined approach to studying markets—without cluttering charts with excessive indicators.
🔔 The Big Picture
With the cup & handle breakout and RSI strength, Nifty 50 looks poised to challenge and potentially surpass its September 2024 all-time high of 26,277. If sustained, this could mark the beginning of a fresh leg in India’s equity market rally.

Nifty 50 Weekly Outlook ( 17th Nov – 21st Nov 2025)The Nifty 50 Index last week ended at 25,910.05, posting a +1.64% gain. The index bounced strongly from lower levels and is now trading near a key supply zone, indicating that the market may see either continuation or consolidation depending on how price reacts to this region.
🔹 Key Levels for the Upcoming Week
📌 Price Action Pivot Zone (25830 to 25991)
This blue-shaded zone represents the crucial decision area. Sustaining above 25,991 may attract strong buying interest, while rejection from this zone could lead to short-term profit booking.
🔻 Support Levels:
S1: 25,590
S2: 25,270
S3: 24,895
🔺 Resistance Levels:
R1: 26,234
R2: 26,558
R3: 27,027
📈 Market Outlook
✅ Bullish Scenario:
If Nifty holds above the Pivot Zone (25830–25991), bullish momentum could push the index toward R1 (26,234). A strong breakout above this may extend the rally toward R2 (26,558) and eventually R3 (27,027).
❌ Bearish Scenario:
If the index fails to sustain above 25,830, short-term weakness may emerge, dragging Nifty toward S1 (25,590). Further breakdowns could open doors to S2 (25,270) and S3 (24,895). A weekly close below 24,900 may signal a deeper correction.
Disclaimer: aliceblueonline.com

"NIFTY" will it break all time high ???Possibility seems high considering accumulation in this zone for few weeks...
NIFTY - Upward move continuesOnce closed above 26000 good chance to break further resistance 26100 and hit 26250 & 26300 within this week. If closed above 26300 and upper resistance line we can expect good rally.

NIFTY KEY LEVELS FOR 17.11.2025NIFTY KEY LEVELS FOR 17.11.2025
Timeframe: 3 Minutes
Sorry for the delayed post.
If the candle stays above the pivot point, it is considered a bullish bias; if it remains below, it indicates a bearish bias. Price may reverse near Resistance 1 or Support 1. If it moves further, the next potential reversal zone is near Resistance 2 or Support 2. If these levels are also broken, we can expect the trend.
When a support or resistance level is broken, it often reverses its role; a broken resistance becomes the new support, and a broken support becomes the new resistance.
If the range(R2-S2) is narrow, the market may become volatile or trend strongly. If the range is wide, the market is more likely to remain sideways
please like and share my idea if you find it helpful
📢 Disclaimer
I am not a SEBI-registered financial adviser.
The information, views, and ideas shared here are purely for educational and informational purposes only. They are not intended as investment advice or a recommendation to buy, sell, or hold any financial instruments.
Please consult with your SEBI-registered financial advisor before making any trading or investment decisions.
Trading and investing in the stock market involves risk, and you should do your own research and analysis. You are solely responsible for any decisions made based on this research.

Nifty Trading Strategy for 17th November 2025📊 NIFTY Intraday Trading Plan (15-Minute Strategy)
🟢 BUY Setup (Long Trade)
📌 Condition to Enter
Buy only if the 15-minute candle closes ABOVE
👉 ₹25,987
This means buyers are gaining strength and price is breaking upward.
🎯 Targets
Target 1: ₹26,020
Target 2: ₹26,060
Target 3: ₹26,099
🛡️ Suggested Stop Loss (SL)
Below the breakout candle or around ₹25,950
🔻 SELL Setup (Short Trade)
📌 Condition to Enter
Sell only if the 15-minute candle closes BELOW
👉 ₹25,840
This indicates sellers are taking control.
🎯 Targets
Target 1: ₹25,800
Target 2: ₹25,760
Target 3: ₹25,721
🛡️ Suggested Stop Loss (SL)
Above the breakdown candle or around ₹25,880
📝 Simple Explanation (Novice Friendly)
Always wait for the 15-minute candle to close before entering the trade.
A candle closing above a level = breakout → buy trade.
A candle closing below a level = breakdown → sell trade.
Book profits at each target step-by-step.
Use proper stop loss to limit risk.
Avoid trading during big news events.
⚠️ Disclaimer
This is not investment advice.
You must do your own analysis before taking any trades.
I am not a SEBI-registered analyst.
Trading in the stock market involves risk — trade carefully.

#NIFTY Intraday Support and Resistance Levels - 17/11/2025Nifty is expected to open flat near the 26000 level, keeping price action inside the same tight range as yesterday. The index is currently trading near an important resistance cluster, so early candles may remain choppy and sideways until a clear directional move develops.
If Nifty sustains above 26,000, upside strength can continue toward 26,150, 26,200, and 26,250+. A breakout above 26,000 will act as the primary confirmation for long positions, indicating fresh buyer momentum.
On the downside, if the index slips below 25,950–25,900, a short setup may get activated toward 25,850, 25,800, and 25,750-. This zone has acted as support earlier, so a breakdown may lead to a quick intraday slide.
Overall, with a flat opening and no gap advantage for either side, Nifty remains in a reaction zone. Traders should wait for a decisive move above 26,000 or below 25,900 to catch a clean trend. Use strict SL as volatility may rise around resistance levels.

NIFTY Levels for TodayHere are the NIFTY's Levels for intraday (in the image below) today. Based on market movement, these levels can act as support, resistance or both.
Please consider these levels only if there is movement in index and 15m candle sustains at the given levels. The SL (Stop loss) for each BUY trade should be the previous RED candle below the given level. Similarly, the SL (Stop loss) for each SELL trade should be the previous GREEN candle above the given level.
Note: This idea and these levels are only for learning and educational purpose.
Your likes and boosts gives us motivation for continued learning and support.

Today(17/11/2025),nifty50 analysis.
CPR: slightly wide + overlapping lower cpr: sideways to bearish.
FII: -4,968.22 sold.
DII: 8,461.47 bought.
Highest OI:
Resistance: 26000, 26100
Support : 25800,25700
conclusion:
My pov: market is neutral to bearish, If and only 26100 is closed and crossed i view as bullish trend lets wait and watch. why because FII keep selling, That the reason i cant clearly think market is in bullish,
psychology fact : Trading is a profession where you have to think freely and creatively.
note:
8moving average ling is blue colour.
20moving average line is green colour
50moving average line is red colour.
200moving average line is black colour.
cpr is for trend analysis.
MA line is for support and resistance.
Disclaimer:
Iam not Sebi registered so i started this as a hobby, please do your own analysis, any profit/loss you gained is not my concern. I can be wrong please do not take it seriously thank you.
