time cycles as a filter within technical analysis(NIFTY)Professional traders often use time cycles as a filter within technical analysis:
What are Time Cycles?
Time Cycle Analysis is a subset or specialized branch of technical analysis that focuses exclusively on the timing of market turns using recurring time intervals, rather than price patterns or indicators.
It studies when price reversals or significant moves are likely to occur, based on:
Historical time intervals between highs/lows
Fixed calendar cycles (seasonal, lunar, anniversary dates)
Mathematical cycles (Fibonacci time zones, Gann time squares, Hurst cycles)
Key Time Cycle Methods:
Method Description
Seasonality e.g., "Sell in May and go away"
Anniversary Dates Markets often reverse near dates of past major highs/lows
Fibonacci Time Zones Vertical lines at Fib intervals (1, 2, 3, 5, 8, 13, 21 days/weeks) from a swing point
Gann Time Analysis Uses squares (e.g., 90-day, 144-day cycles), angles, and dates
Hurst Cycles Identifies dominant cycle lengths (e.g., 18-week, 40-week) using spectral analysis
Goal: Predict when a reversal or acceleration might occur, regardless of price structure.
Key Difference: Time Cycles vs. Technical Analysis
Aspect Technical Analysis (Broad) Time Cycle Analysis (Narrow)
Focus Price + Volume + Patterns Time intervals only
Core Question What is the trend/pattern? When will the turn happen?
Tool sIndicators, patterns, S/R Calendar dates, Fib time, Gann squares
Predicts Direction + levels Timing of potential reversals
Standalone? Yes Usually combined with TA for confirmation
Example "RSI oversold + double bottom → buy" "90 days from March low → expect top"
Analogy:
Technical Analysis = A full GPS system (route, speed, traffic, landmarks)
Time Cycles = Just the clock on the dashboard ("We always hit traffic at 5 PM")
Best Practice: Combine Both
Professional traders often use time cycles as a filter within technical analysis:
Price at support + RSI oversold
AND: We're 144 days from the last major low (Gann cycle)
→ High-probability long setup
Summary
Technical Analysis Time Cycle Analysis
Scope Broad (price, volume, patterns) Narrow (timing only)
Predicts Direction, levels Timing of turns
Relationship Parent method Sub-branch of TA
Time Cycles ≠ Separate from TA — they are a timing tool within technical analysis.
Trade ideas
The Herd Mentality – Why Everyone Buys When It’s Too Late?Hello Traders!
You’ve seen it a hundred times, the market rallies, social media explodes, and suddenly everyone starts buying.
Then, just when retail traders feel “safe” entering, the price crashes.
It’s not bad luck, it’s herd mentality .
And unless you understand how it works, you’ll keep following the crowd straight into losses.
1. What is Herd Mentality in Trading?
Herd mentality is the instinct to do what everyone else is doing, buying when others buy, selling when others sell.
It’s rooted in human psychology, our brains feel safer when we’re part of a group.
In trading, this instinct is deadly because the crowd always reacts late.
When you feel comfortable entering a trade, it’s usually because the market has already moved.
2. The Cycle of Fear and Greed
Every bull run begins with a few smart traders who buy quietly when no one’s interested.
As prices rise, social media hype builds, the crowd starts joining in.
Then, when “everyone” is talking about the coin, smart money exits, leaving the herd trapped at the top.
The same happens in bear markets, panic selling at bottoms while professionals buy patiently.
It’s not about intelligence, it’s about emotion.
3. How the Market Exploits the Crowd
Institutions and big traders understand herd behavior better than anyone.
They create liquidity by pushing prices to levels where retail traders feel emotionally forced to act.
The market uses human nature, fear and greed, as its fuel.
The crowd provides the liquidity, and professionals use that liquidity to enter or exit quietly.
4. How to Avoid Becoming Part of the Herd
Develop your own plan, if your entry depends on others’ excitement, it’s not your setup.
Buy when the market feels uncomfortable; sell when everyone feels confident.
Learn to think independently. The best trades usually feel the hardest to take.
Patience and conviction are your weapons against the herd.
5. The Truth Most Traders Don’t Want to Hear
If you wait for social proof to feel confident, you’ll always be late.
By the time the crowd “believes,” the move is already priced in.
You don’t get rich by following others, you get rich by understanding why others behave the way they do.
Rahul’s Tip:
The market doesn’t punish retail traders because they lack knowledge, it punishes them because they act emotionally together.
Train your mind to do what’s uncomfortable, not what’s popular. That’s where the profit hides.
Conclusion:
The herd mentality is the silent killer of most portfolios.
The more people talk about an asset, the less opportunity it holds.
Smart traders buy silence and sell noise.
Once you learn to think independently, you’ll stop being the liquidity, and start trading like the ones who create it.
If this post opened your eyes to herd psychology, like it, share your view in comments, and follow for more deep market insights!
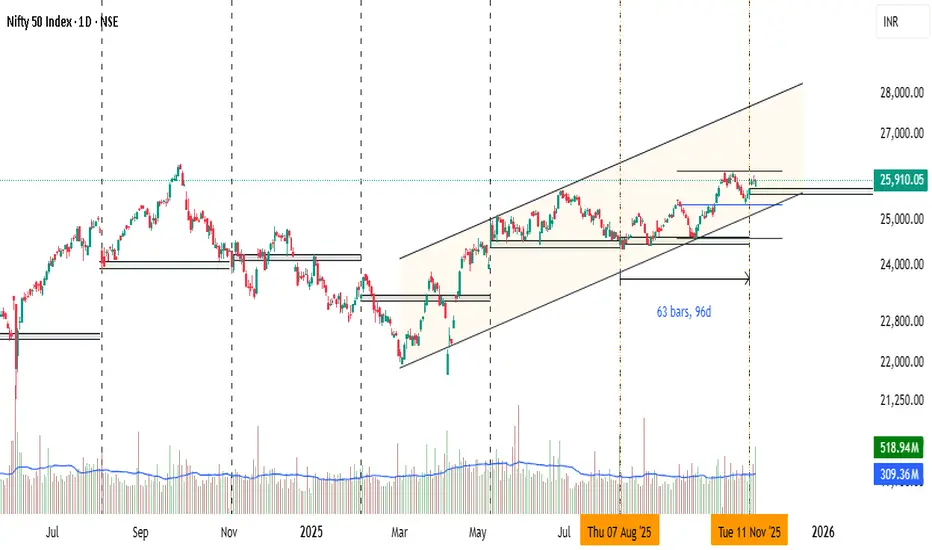
Nifty Analysis for Nov 14, 2025Wrap-up:
Nifty has formed a impulsive pattern and internal wave 5 of internal wave b has been treated as completed once nifty breaks 25746.
What I’m Watching for Nov 14, 2025 🔍
I’ll be watching for the market to break 38.2% level i.e. 25746; thereafter short nifty below 25685 for a target of 25580-25150 SL 25870 (SL on 15 min. candle close).
Disclaimer: Sharing my personal market view — only for educational purpose not financial advice.

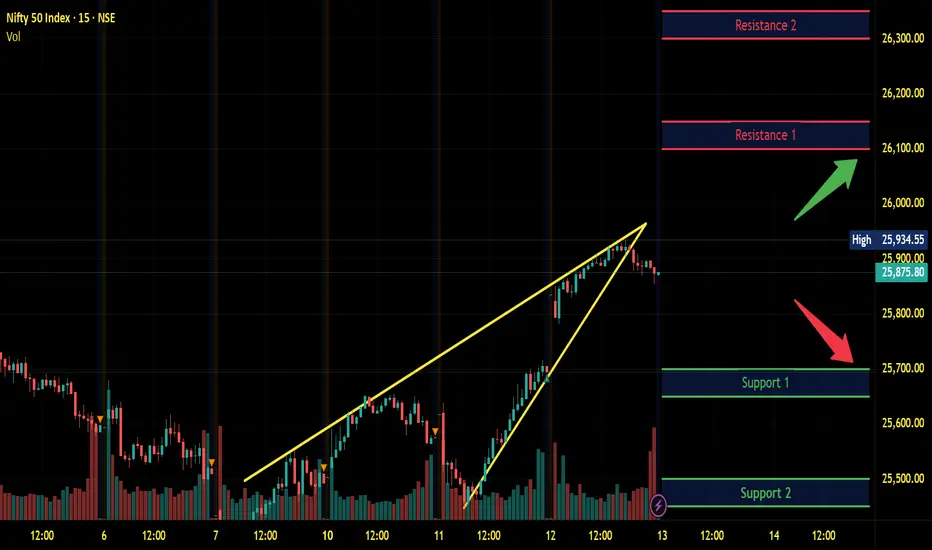
Nifty we can sse new ATH next week buy on dip next week 17 nov🔑 Key Highlights
- Price Action: Nifty is holding above the ₹25,900 mark, showing resilience.
- Trend: Active Long Build‑Up confirmed.
- Supports: ₹25,850 / ₹25,700 / ₹25,500.
- Resistances: ₹25,950 / ₹26,100 / ₹26,250.
- Bias: Bullish continuation if above ₹25,850; corrective pullback risk below ₹25,700.

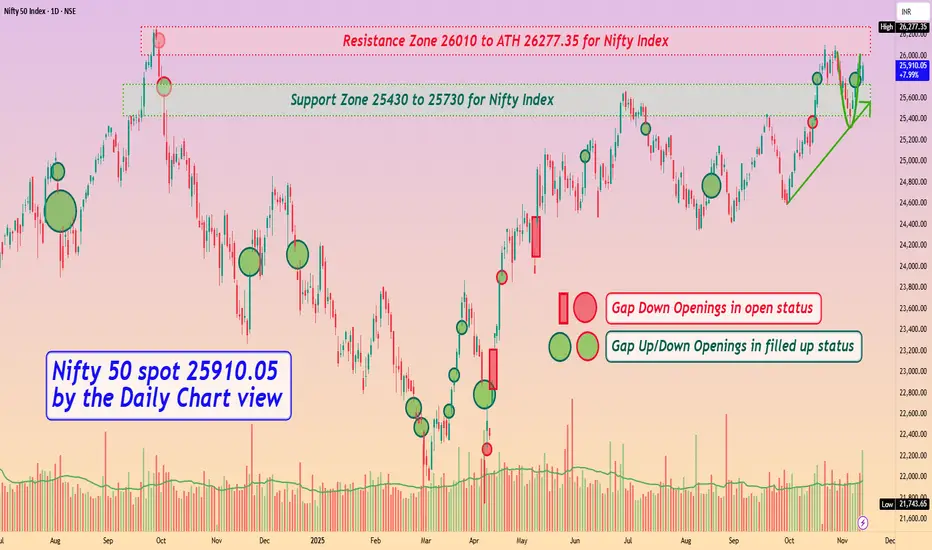
Nifty 50 spot 25910.05 by Daily Chart view - Weekly UpdateNifty 50 spot 25910.05 by Daily Chart view - Weekly Update
- Support Zone 25430 to 25730 for Nifty Index
- Resistance Zone 26010 to ATH 26277.35 for Nifty Index
- Rising Support Trendline seems respected by weekly positive closure
- Rounding Bottom Bullish momentum by Resistance Zone neckline seems sustained
- Nifty timidly shy from creating a New Lifetime High by crossing ATH final hurdle remains effectively elusive
Classic Case of Priced In Optimism & Intraday Liquidity TrapThe market’s behaviour on the Bihar election result day followed a pattern that repeats itself almost every time political outcomes are broadly expected. By the time counting began in the morning, the market had already made its real move. The rally from the 25,350 zone to the 26,000 area in the previous sessions had priced in the possibility of political continuity. Exit polls and early sentiment didn’t leave much room for a fresh surprise, and because of that, the result day itself turned out to be a range-bound session instead of a trend day.
The 5-minute chart shows exactly how the trap formed. The index opened firm, pushed towards 26,000, and immediately met selling pressure. Traders who entered on the assumption that a clear political mandate would trigger a one-way rally were trapped right at the open. Through the middle of the session, the market drifted back into a narrow band, forming lower highs and repeatedly slipping toward the 25,750 support. This is typical behaviour when a major event gets fully discounted before the actual announcement. Without fresh triggers, the market simply rotated around intraday liquidity.
Global cues didn’t help either. Asian markets were soft, risk sentiment was weak, and domestic buying lacked strength. Even with a favourable political outcome, the backdrop wasn’t strong enough to push the index beyond the 26,000 supply zone. This created a clean intraday squeeze: optimism at the open, hesitation through the day, and then a sharp reversal in the last half-hour.
The late spike—more than 100 points in a single 5-minute candle around 3 PM—was largely mechanical. It had the signature of short-covering, expiry-related adjustment, and institutional book-closing rather than genuine trend buying. Moves like this usually appear when intraday shorts square off and larger players rebalance their positions into the close.
The higher timeframe tells the same story. On the 1-hour chart, the index had already hit resistance earlier, and each attempt near 26,000 was met with supply. The trend remains intact on the broader scale, but momentum clearly slowed down once the market realised that the result did not introduce any new variable—it simply confirmed what was already anticipated.
Overall, this session was a textbook example of how markets behave when the news is entirely expected. The initial reaction pulls in emotional traders, the mid-day choppiness shakes out both sides, and the final burst is more about positioning than sentiment. Until Nifty closes decisively above 26,050 on strong breadth, the index is likely to stay in a sideways-to-cautious zone with support near 25,750.
In short, the market didn’t rally because there was nothing new to rally about. The optimism was already embedded in the previous move, and the result day turned into a classic liquidity trap rather than a directional breakout.

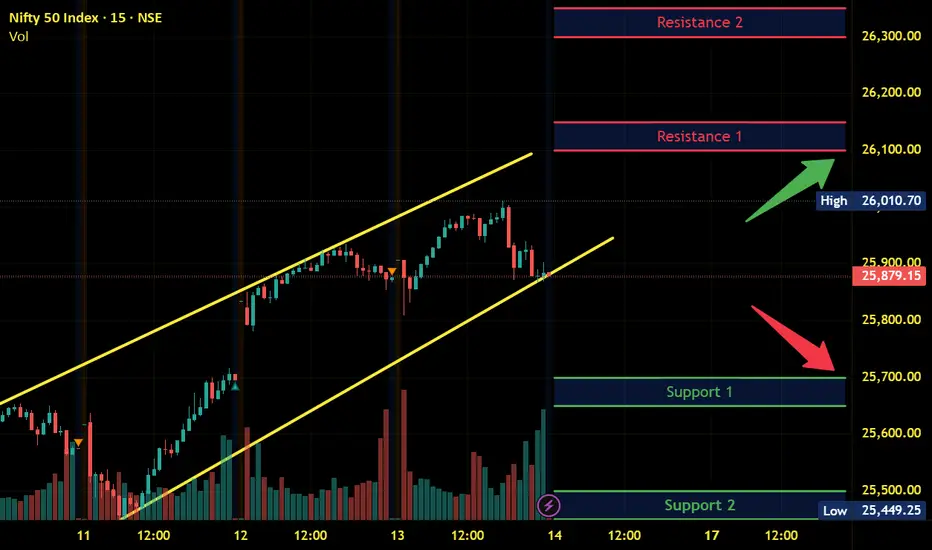
Nifty Intraday Analysis for 14th November 2025NSE:NIFTY
Index has resistance near 26100 – 26150 range and if index crosses and sustains above this level then may reach near 26300 – 26350 range.
Nifty has immediate support near 25700 – 25650 range and if this support is broken then index may tank near 25500 – 25550 range.
Learn Candle PatternsCandlestick patterns are one of the most important tools in technical analysis, used by traders around the world to understand market psychology, predict price movement, and identify buying or selling opportunities. Each candle on the chart tells a story—who is in control (bulls or bears), the strength of the price move, and the potential reversal or continuation of the trend. When combined into patterns, candlesticks offer powerful signals that help traders make better decisions.
A single candlestick is made of four data points: open, high, low, and close. The body represents the open-to-close range, while wicks (shadows) show the highs and lows. Bullish candles generally close above the open, and bearish candles close below the open. Understanding this basic structure is essential before analyzing patterns.
Candlestick patterns are broadly categorized into reversal patterns and continuation patterns. Reversal patterns indicate a potential change in trend, while continuation patterns suggest the existing trend is likely to continue. These patterns can be single-candle, double-candle, or multi-candle formations.

Nifty 50If it break 25800 downside then it will move towards 25650
It's my analysis for educational purpose
Not any investment advice.

NIFTY getting rejected from BAT PRZ - To test 25730TF: 15 MInutes
Shared Sensex chart earlier today on this formation..
Price is getting rejected from the PRZ of the Harmonic Bat Pattern.
We could expect 50% pullback as per the set up, and the 50% retracement is placed at 25730
The PRZ also happens to be 1.618% fib extension from the lows, so, if one wants to consider it as a 3rd wave target..
Ideally, we could expect one more leg up to go past 26K after this correction (in EW terms), assuming, we have completed 3 and 4th in play (to end at 25700-25750 range)
Finally, the 25750 zone GAP needs to be filled sooner or later.. which, confluences with the Harmonic/EW targets.
lets see how the price unfolds in the coming sessions..
Disclaimer: I am not a SEBI registered Analyst and this is not a trading advise. Views are personal and for educational purpose only. Please consult your Financial Advisor for any investment decisions. Please consider my views only to get a different perspective (FOR or AGAINST your views). Please don't trade FNO based on my views. If you like my analysis and learnt something from it, please give a BOOST. Feel free to express your thoughts and questions in the comments section.


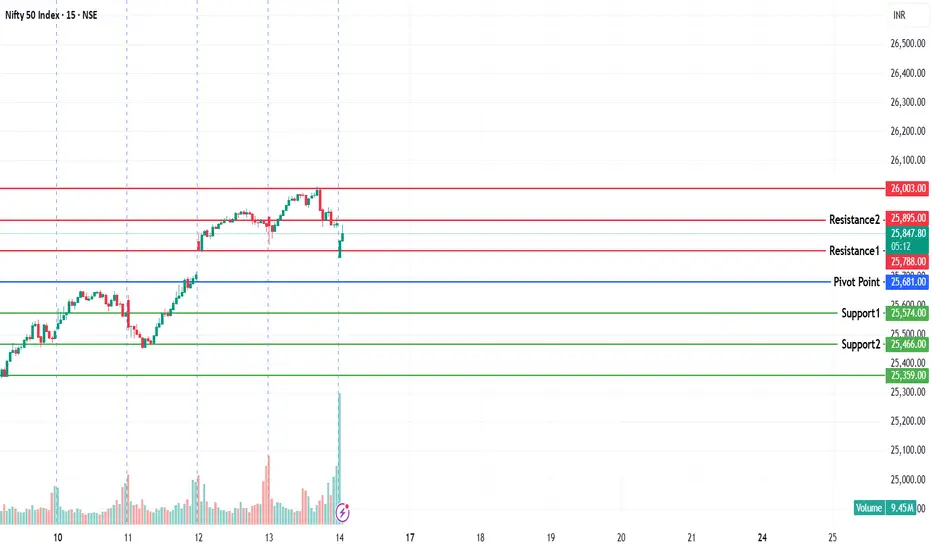
NIFTY KEY LEVELS FOR 14.11.2025NIFTY KEY LEVELS FOR 14.11.2025
Timeframe: 3 Minutes
If the candle stays above the pivot point, it is considered a bullish bias; if it remains below, it indicates a bearish bias. Price may reverse near Resistance 1 or Support 1. If it moves further, the next potential reversal zone is near Resistance 2 or Support 2. If these levels are also broken, we can expect the trend.
When a support or resistance level is broken, it often reverses its role; a broken resistance becomes the new support, and a broken support becomes the new resistance.
If the range(R2-S2) is narrow, the market may become volatile or trend strongly. If the range is wide, the market is more likely to remain sideways
please like and share my idea if you find it helpful
📢 Disclaimer
I am not a SEBI-registered financial adviser.
The information, views, and ideas shared here are purely for educational and informational purposes only. They are not intended as investment advice or a recommendation to buy, sell, or hold any financial instruments.
Please consult with your SEBI-registered financial advisor before making any trading or investment decisions.
Trading and investing in the stock market involves risk, and you should do your own research and analysis. You are solely responsible for any decisions made based on this research.
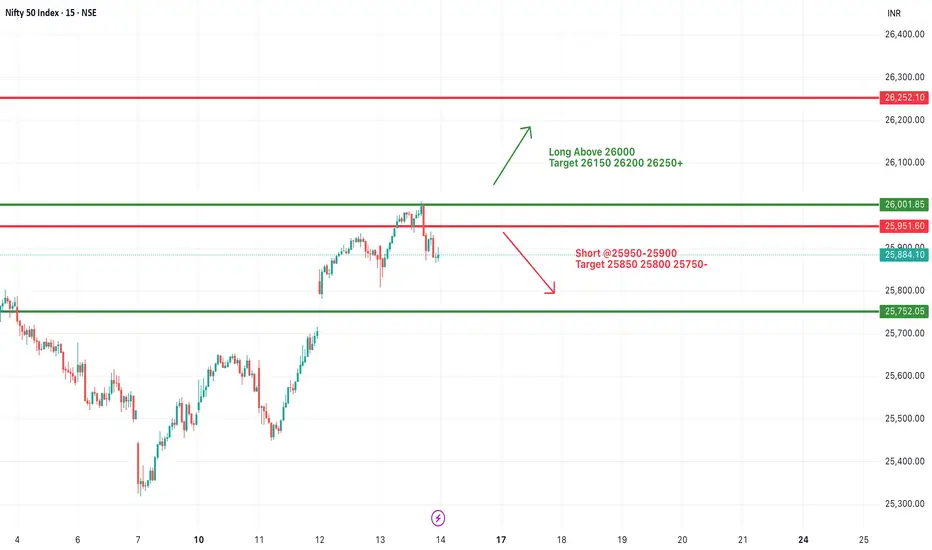
#NIFTY Intraday Support and Resistance Levels - 14/11/2025Nifty is expected to open flat near the 25,880–25,900 zone, keeping price action inside the same tight range as yesterday. The index is currently trading near an important resistance cluster, so early candles may remain choppy and sideways until a clear directional move develops.
If Nifty sustains above 26,000, upside strength can continue toward 26,150, 26,200, and 26,250+. A breakout above 26,000 will act as the primary confirmation for long positions, indicating fresh buyer momentum.
On the downside, if the index slips below 25,950–25,900, a short setup may get activated toward 25,850, 25,800, and 25,750-. This zone has acted as support earlier, so a breakdown may lead to a quick intraday slide.
Overall, with a flat opening and no gap advantage for either side, Nifty remains in a reaction zone. Traders should wait for a decisive move above 26,000 or below 25,900 to catch a clean trend. Use strict SL as volatility may rise around resistance levels.
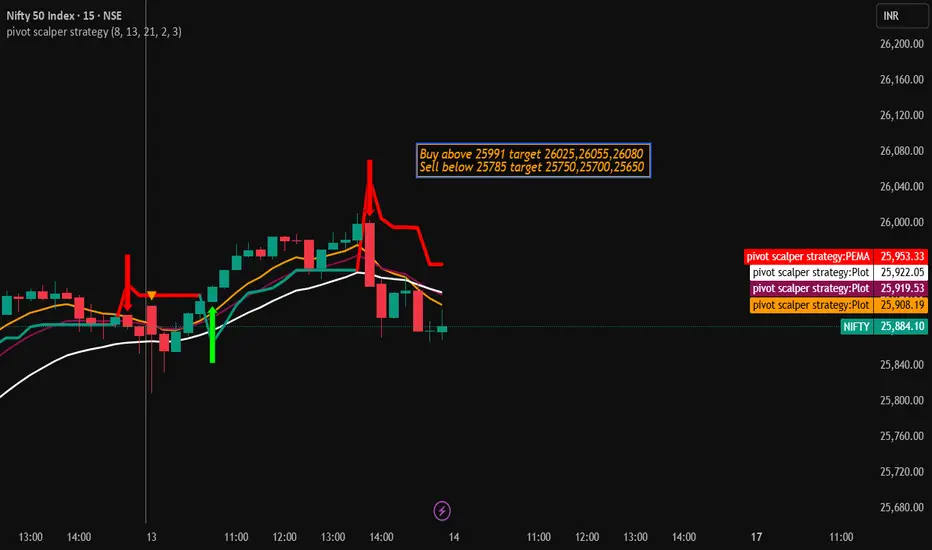
Nifty Trading Strategy for 14th November 2025⭐ NIFTY Intraday Levels (15-Min Candle Strategy)
🟢 BUY Setup
📈 Buy Above: ₹25,991
⏱️ Condition: Price must close above the high of the 15-min candle
🎯 Targets: ₹26,025, ₹26,055, ₹26,080
🔴 SELL Setup
📉 Sell Below: ₹25,785
⏱️ Condition: Price must close below the low of the 15-min candle
🎯 Targets: ₹25,750, ₹25,700, ₹25,650
⚠️ Disclaimer
I am not SEBI registered.
These levels are shared only for educational and informational purposes.
Trading involves high market risk. Please do your own analysis and consult a certified financial advisor before executing any trades.
NIFTY Levels for Today
Here are the NIFTY's Levels for intraday (in the image below) today. Based on market movement, these levels can act as support, resistance or both.
Please consider these levels only if there is movement in index and 15m candle sustains at the given levels. The SL (Stop loss) for each BUY trade should be the previous RED candle below the given level. Similarly, the SL (Stop loss) for each SELL trade should be the previous GREEN candle above the given level.
Note: This idea and these levels are only for learning and educational purpose.
Your likes and boosts gives us motivation for continued learning and support.

EXACT rejection from 26000!! What's next!?As we can see NIFTY did achieve our target of 26000 as expected and got rejected exactly from there which was well analysed in our previous post about the possible rejection being both a psychological level and important supply zone. Now that we have seen strong rejection, we can expect NIFTY to remain negative in coming trading sessions unless it manages to sustain itself above 26000 levels so plan your trades cautiously.

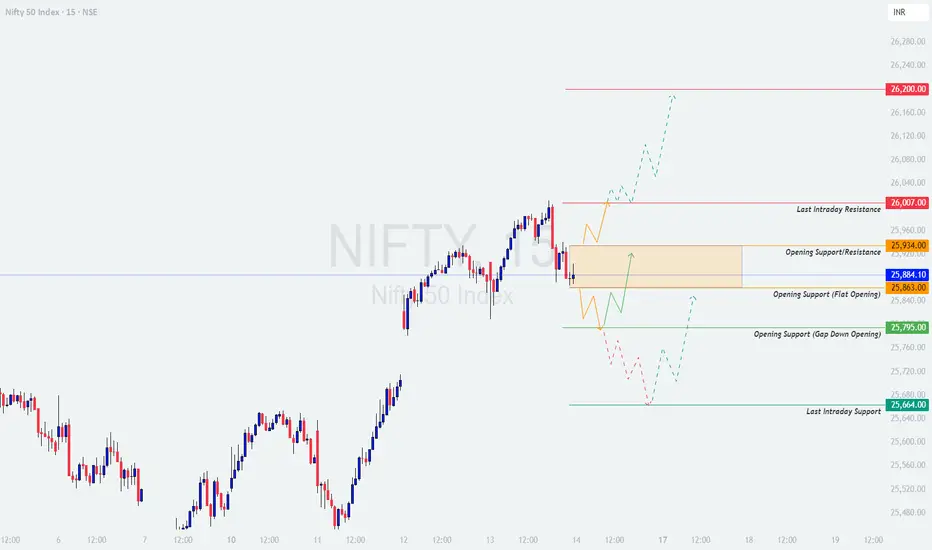
NIFTY : Trading levels and Plan for 14-Nov-2025📊 NIFTY TRADING PLAN — 14 NOV 2025
(Timeframe Reference: 15-Min Chart)
Chart Summary:
Nifty closed near 25,884 , forming a balanced structure after recent upside momentum. The index is currently positioned within the Opening Support / Resistance Zone (25,863 – 25,934) , suggesting indecision as participants await directional clarity.
Above this range, key resistance levels lie at 26,007 (Last Intraday Resistance) and 26,200 . On the downside, supports exist near 25,795 (Gap-down Support) and 25,664 (Last Intraday Support) .
The index remains in a neutral-to-bullish bias as long as it holds above 25,795 . Sustaining above 25,934 may trigger renewed upward movement toward 26,200.
Key Levels to Watch:
🟩 Supports: 25,795 / 25,664
🟥 Resistances: 25,934 / 26,007 / 26,200
⚖️ Bias Zone: 25,863 – 25,934 (No-Trade Zone – Wait for breakout confirmation)
🟢 Scenario 1: GAP-UP Opening (100+ Points)
If Nifty opens above 26,000 – 26,050 , it will open directly near or above the Last Intraday Resistance (26,007) . Such a gap-up could trigger excitement at the open, but traders must wait for confirmation of strength.
If price sustains above 26,007 for 15–20 minutes with strong bullish candles, the next upside targets could be 26,120 – 26,200 .
If price fails to sustain above 26,007 and forms rejection wicks, expect a pullback toward 25,934 – 25,884 .
Avoid chasing a gap-up immediately — wait for a retest near 26,000 for better entry confirmation.
If price reclaims 26,000 after a pullback with rising volume, it could confirm continuation momentum.
💡 Educational Note:
Gap-ups near resistance zones often create emotional entry traps. Always let the price establish strength through retests and volume confirmation. A breakout sustained by strong candles signals genuine trend continuation, while sharp reversals at resistance suggest false breakouts.
🟧 Scenario 2: FLAT Opening (Around 25,860 – 25,900 Zone)
A flat opening near the Opening Support / Resistance Zone (25,863 – 25,934) indicates early indecision. Price may spend time consolidating before choosing direction.
Avoid entering within this zone in the first 15 minutes — volatility may remain erratic.
If Nifty sustains above 25,934 with strong green candles, upside targets open toward 26,007 – 26,200 .
If it breaks below 25,863 , weakness may push the index toward 25,795 – 25,664 .
Trade breakout confirmation only — fakeouts are common in flat openings. Wait for candle closure and volume support.
🧠 Educational Tip:
Flat openings test trader discipline. Most false breakouts occur when traders predict rather than wait. Breakouts that occur after a consolidation period with strong volume tend to have better follow-through. The key is patience and confirmation, not prediction.
🔴 Scenario 3: GAP-DOWN Opening (100+ Points)
If Nifty opens near 25,770 – 25,800 , it will enter the Opening Support Zone . This area will be critical for bulls to defend.
If price forms reversal candles (hammer, bullish engulfing) near 25,795 , expect a rebound toward 25,863 – 25,934 .
If the index fails to hold above 25,795 , further weakness could extend toward 25,664 (Last Intraday Support) .
Avoid panic shorting after a large gap-down — instead, wait for pullbacks toward 25,860 – 25,880 for better entry risk-reward.
Watch for volume behavior — decreasing volume near support often indicates exhaustion, hinting at a short-covering rally.
📘 Educational Insight:
Gap-downs attract panic sellers early in the session. Experienced traders wait for signs of stabilization at support levels. Sharp reversals with strong volume often mark the beginning of intraday recoveries. Patience pays more than impulse in such setups.
💼 RISK MANAGEMENT TIPS FOR OPTIONS TRADERS:
Avoid option entries during the first 15–20 minutes — IV (Implied Volatility) spikes inflate premium values, leading to quick time decay afterward.
Limit exposure to 1–2% of total capital per trade . Consistency in risk control is key to longevity.
Prefer ATM or ITM options for directional plays; avoid deep OTM options unless trading clear breakout momentum.
Always use stop-losses — trail them once the position moves 30–40 points in your favor.
Book partial profits at strong support/resistance zones to lock in gains.
If the day turns choppy or non-trending, step back — capital preservation > forced trading.
📈 SUMMARY:
🟧 Neutral Zone: 25,863 – 25,934
🟥 Resistance Zones: 26,007 / 26,200
🟩 Support Zones: 25,795 / 25,664
⚖️ Bias: Bullish above 25,934 | Bearish below 25,863
📚 CONCLUSION:
Nifty is at a decisive point, trading within a narrow consolidation zone between 25,863 – 25,934 . A breakout above this zone could drive momentum toward 26,200 , while a breakdown below 25,863 could lead to a retest of 25,795 – 25,664 .
Patience and observation will be the most valuable tools for traders on 14 Nov. Let price confirm direction with volume support before executing trades. Avoid emotional entries — precision and timing matter more than frequency.
📊 In trading, waiting for confirmation isn’t missing out — it’s aligning with probability and discipline.
⚠️ DISCLAIMER:
I am not a SEBI-registered analyst . The above analysis and levels are shared purely for educational and informational purposes . Please conduct your own research or consult a certified financial advisor before making trading or investment decisions.
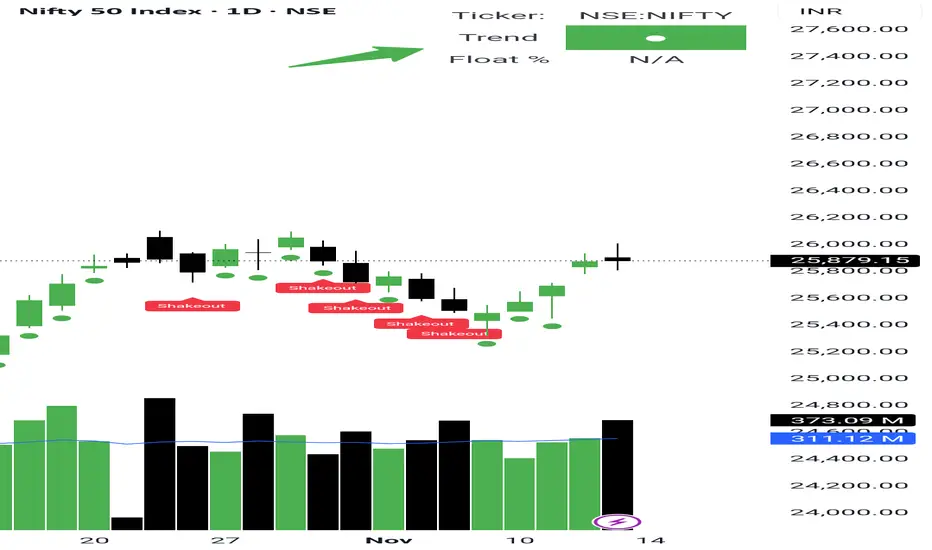
Nifty’s Shakeout Sets the Stage for a Bullish Run Yesterday’s sellers’ data played out perfectly today — after touching 26000, NSE:NIFTY closed below the day’s open. A classic shakeout.
Pivot has now climbed to 25899 despite a red candle, which clearly shows long buildup is still happening.
The plan is simple — go long on a dip, or go long above 25909 with a target of 26200.
But if 25834 breaks, then 25700 becomes the next support zone to accumulate fresh longs again.
Now here’s the interesting part — even with today’s low close and higher sellers’ volume, Nifty’s health has turned Green (top-right corner on the chart).
This is a very strong signal for the coming weeks.
Trend has clearly turned positive. Bulls are getting ready to roar.
As mentioned yesterday, pharma stocks continue to build strength for short term opportunities.
📊 Levels at a glance:
Pivot: 25899
Long above: 25909
Support: 25834 / 25700 (buy zone)
Upside target: 26200
Market Health: Green
Bias: Bullish with shakeout confirmation
Sector to watch: NSE:CNXPHARMA
Tomorrow Gap UP or Huge Gap DOWN market - UP (30%) or DOWN (70%)Sir/Mam,
Tomorrow mostly market will be gap up to manipulate the seller's or Huge Gap down to manipulate buyers. Whichever side opens it will react opposite way of Direction. For e.g. if it opens by 26000 or above - then buy 26150 CE and 26000 PE, book profit for the one side momentum same for gap down, if its open at 25750 buy 25850 CE and 25700 PE, book profit for the one side momentum.
If the market opens flat, then wait till expiry day, because premium will decay from both sides.
Hope you enjoyed today.
Let's blast for tomorrow.

NIFTY_50 (NIFTY)Time Cycle is a routine that allows you to map the movement of a stock by measuring the high and low levels of the stock on a day or period. However, it does not prove whether a reversal will occur in the next time cycle; it is only a probability. But it makes you profitable 80% of the time.
Regardless of the outcome, the candle formed on the day of the time cycle carries significant significance. The market respects this candle, whether it goes up or down, which is very important. Time Cycle often stops short near the candle. You will notice on the chart that it often looks like a support or resistance area.
Time Cycle candles also tell you about continuation or reversal, but you have to forgive the high and low of the candle formed in the time cycle.
You do not have to make any decisions yourself. This is its specialty.

Candle Patterns Explained Doji Candle – Indicates market indecision where opening and closing prices are almost equal.
Hammer Candle – A bullish reversal signal appearing after a downtrend with a long lower wick.
Shooting Star – A bearish reversal pattern with a small body and a long upper shadow at the top of an uptrend.
Bullish Engulfing – A large bullish candle fully engulfs the previous bearish candle, signaling potential trend reversal upward.
Bearish Engulfing – A large bearish candle fully engulfs the previous bullish candle, hinting at a possible downward reversal.

Nifty Intraday Analysis for 13th November 2025NSE:NIFTY
Index has resistance near 26100 – 26150 range and if index crosses and sustains above this level then may reach near 26300 – 26350 range.
Nifty has immediate support near 25700 – 25650 range and if this support is broken then index may tank near 25500 – 25550 range.
Updated Nifty Short term viewNifty has completed its wave x of major wave B @25318 and heading towards wave y of major wave B.
I’ll be watching for the market to sustain above 25616 atleast 25 min. for a target of 25800-25864 with a SL of 25456 (SL on 15 min. candle close).
Disclaimer: Sharing my personal market view — only for educational purpose not financial advice.
