Nifty Intraday Analysis for 12th November 2025NSE:NIFTY
Index has resistance near 25850 – 25900 range and if index crosses and sustains above this level then may reach near 26100 – 26150 range.
Nifty has immediate support near 25500 – 25450 range and if this support is broken then index may tank near 25300 – 25250 range.
Trade ideas

Nifty Breaks Resistance — But Watch the Volume Trap So as mentioned yesterday, “move will be sharp” — and it was! Nifty rose over 180 points and closed above a key resistance at 25850.
With that, the Pivot has also shifted up to 25863, confirming a long buildup in the index.
However, even with today’s green close, sellers’ volume was higher by 21 million — something worth paying attention to.
That pressure could reflect in tomorrow’s first half. If Nifty breaks below 25834, we might see a test of 25700 — a strong support zone and a great area to accumulate fresh longs again.
Traders should remember — this is not a shorting opportunity. The right approach will be to look for long entries near the mentioned support.
It would actually be ideal if we open with a small gap down tomorrow.
With the Pivot Percentile at just 0.2%, the move after support testing could be sharp.
#BankNifty shows a similar pattern, so keep eyes there as well.
Meanwhile, the #Pharma sector is quietly building momentum. #WOCKPHARMA looks particularly good — I’ve added it to my list today and will keep monitoring closely.
📊Levels at a glance:
Pivot: 25863
Support: 25834 / 25700 (buy zone)
Resistance: 25980
Pivot Percentile: 0.2% (sharp move expected)
Bias: Bullish with short-term pullback possible
Sectors to watch: Pharma (#WOCKPHARMA), Banking
That’s all for the day. Take care and have a profitable tomorrow.

NIFTY - Technical analysisNIFTY gave breakout of the range and then retested the same, took support at 50ema and gave reversal.
Now there is probability of going towards 26104 and then crossing 26277, overall setup is Bullish.
Today there was gap up so in between it may fill this gap.
✅ If you like my analysis, please follow me here as a token of appreciation :)
in.tradingview.com/u/SatpalS/
📌 For learning and educational purposes only, not a recommendation. Please consult your financial advisor before investing.

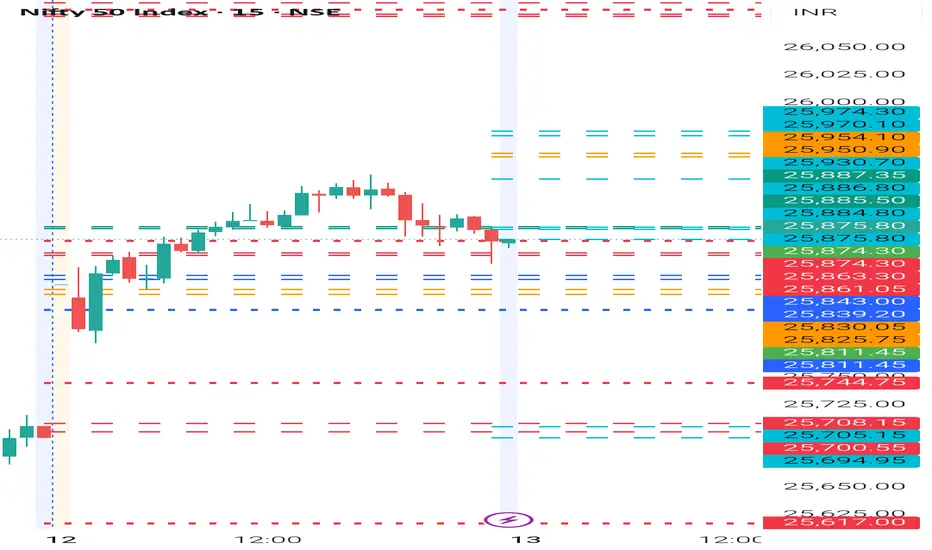
NIFTY- Intraday Levels - 13th November 2025If NIFTY sustain above 25875/84/87 above this bullish then around 25930/50/54/70/74 then 26078/84/91/98 strong level above this more bullish then 26118/25 then 26152/56/66 above this wait
If NIFTY sustain below 25861 below this bearish then around 25843/39/30/25 then 25811 below this more bearish then below this wait
Consider some buffer points in above levels.
Please do your due diligence before trading or investment.
**Disclaimer -
I am not a SEBI registered analyst or advisor. I does not represent or endorse the accuracy or reliability of any information, conversation, or content. Stock trading is inherently risky and the users agree to assume complete and full responsibility for the outcomes of all trading decisions that they make, including but not limited to loss of capital. None of these communications should be construed as an offer to buy or sell securities, nor advice to do so. The users understands and acknowledges that there is a very high risk involved in trading securities. By using this information, the user agrees that use of this information is entirely at their own risk.
Thank you.
Nifty - What next?The price took support from the 25780 zone and moved up. 25780 is the strong support zone as of now. If the price opens with a gap down and shows bullish strength at 25780 zone, then it can move towards 26k. Or if the price opens flat, then buy above 25920 with the stop loss of 25870 for the targets, 25960, 26000, 26050 and 26090.
If the price opens between 25800 to 25900, that is within today's range with less trend strength, then it will try to test the previous support at 25500.
Short-term range is 25500 to 26100. Watch how the price behaves after it opens, then confirm the trend and trade.
Always do your analysis before taking any trade.

Possible Nifty Resistance to supportMultiple bullish confluences in Nifty at current level is seen.
1. There is good resistance to support possible in Nifty nr ATH.
2. Good cup and handle pattern.
3. There is support nr weelky 20sma.
If nifty closes above Friday's high than it will trigger buy which can take nifty to 29000+ levels.
We need to wait for next week close. Target and SL marked on chart.

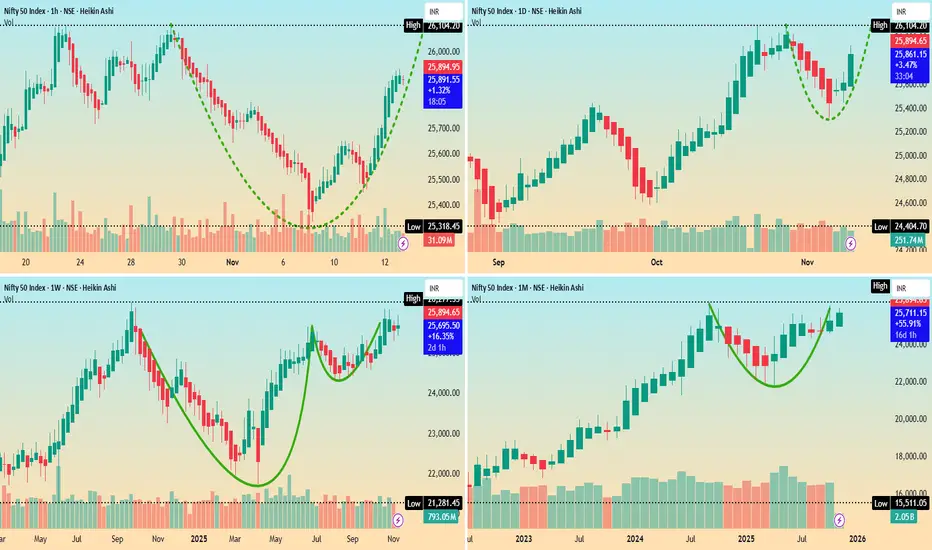
Nifty 50 Index spot 25890 Multi Timeframe viewsNifty 50 Index spot 25890 Multi Timeframe views
Major Timeframes showing Bullish Chart view by Hourly, Daily, Weekly and Monthly, so hope for the best to happen 🤞🏼😊
#nifty50 not looking to long anymore if we tap blue line and hold then good for up... im waiting to swing short

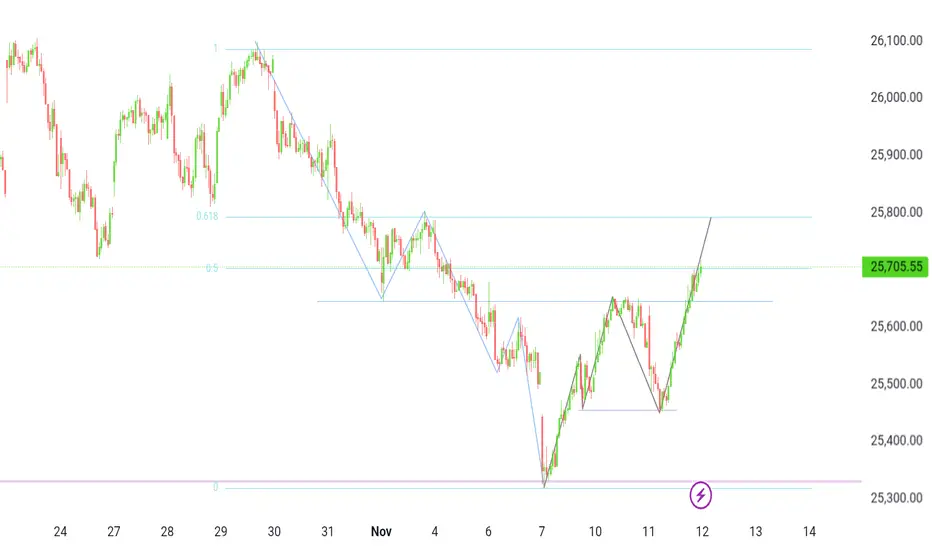
Nifty- Action Near the TopFrom technical perspective there is a triangular contraction formation (which extended from July to Mid-October) seen on this 75 minutes Nifty chart. It was followed by a strong breakout in the mid-October giving a vertical rise scenario.
➡As it is pulling back, there is a Support zone near 25850 (Volume Point of Control), which if holds might take the Index to new highs or at least to its previous highs.
Even if this support holds, I expect a slow grinding action with wide range swings on both the sides near previous highs.
➡A second scenario could be that 25850 doesn't holds. In this case we can expect a test of next potential support zone near 25330.
This was also the breakout zone of the triangle contraction, so the sellers might take it there for a retest before the price pushes back up.
What do you think at this point?
💬Will it hold the current support, or will it move to the next support?
📣Not a buy-sell recommendation, for educational purpose only.
Boost & comment for more such ideas in future.

Nifty long term elliot wave update.Looks like we are in wave (v) of larger wave (3).
Once this wave (3) ends there is likely to be painful correction for about +250days to wave (4). Which will be more than the time taken by (2) in 2021-22.

NIFTY KEY LEVELS FOR 12.11.2025NIFTY KEY LEVELS FOR 12.11.2025
Timeframe: 3 Minutes
If the candle stays above the pivot point, it is considered a bullish bias; if it remains below, it indicates a bearish bias. Price may reverse near Resistance 1 or Support 1. If it moves further, the next potential reversal zone is near Resistance 2 or Support 2. If these levels are also broken, we can expect the trend.
When a support or resistance level is broken, it often reverses its role; a broken resistance becomes the new support, and a broken support becomes the new resistance.
If the range(R2-S2) is narrow, the market may become volatile or trend strongly. If the range is wide, the market is more likely to remain sideways
please like and share my idea if you find it helpful
📢 Disclaimer
I am not a SEBI-registered financial adviser.
The information, views, and ideas shared here are purely for educational and informational purposes only. They are not intended as investment advice or a recommendation to buy, sell, or hold any financial instruments.
Please consult with your SEBI-registered financial advisor before making any trading or investment decisions.
Trading and investing in the stock market involves risk, and you should do your own research and analysis. You are solely responsible for any decisions made based on this research.

Nifty Analysis for Nov 12, 2025Wrap-up:
Nifty has completed its major wave B @25715. Now, heading towards its major wave C.
What I’m Watching for Nov 12, 2025 🔍
I’ll be watching for the market to break 38.2% level i.e. 25614; thereafter short nifty below 25555 for a target of 25150 SL 25654 (SL on 25 min. candle close).
Disclaimer: Sharing my personal market view — only for educational purpose not financial advice.

Nifty50 analysis today(12/11/2025)
CPR: wide+ascending cpr: consolidation.
FII: -803.22sold.
DII: 2,188.47 bought.
Highest OI: too soon to say levels, because yesterday only expiry.
Resistance:
Support :
Possibilities:
1hour timeframe.
1.Today is wide candle there is high chance of consolidation.
2.if and only it takes support at any cpr levels , can move up.
Events.
1.Bihar elections result on Friday.
conclusion:
My pov: market is bullish but the cpr is wide . i will just watch the market.
note:
8moving average ling is blue colour.
20moving average line is green colour
50moving average line is red colour.
200moving average line is black colour.
cpr is for trend analysis.
MA line is for support and resistance.
Disclaimer:
Iam not Sebi registered so i started this as a hobby, please do your own analysis, any profit/loss you gained is not my concern. I can be wrong please do not take it seriously thank you.

Nifty Trading Strategy for 12th November 2025📊 NIFTY Intraday Trading Plan
🟩 BUY Setup (Bullish Scenario)
📈 Condition to Enter Buy:
✅ Buy above the high — wait for the 15-minute candle to close above ₹25,791.
A confirmed close above this level shows bullish momentum — buyers are taking control.
🎯 Profit Targets:
🥇 Target 1: ₹25,840
🥈 Target 2: ₹25,880
🥉 Target 3: ₹25,920
🛑 Stop-Loss (SL):
Keep SL just below the breakout candle’s low (around ₹25,760).
💡 When a candle closes above ₹25,791, it means price has broken a key resistance zone. Buying above the high lets you join the upward momentum as price may move toward the next targets.
🟥 SELL Setup (Bearish Scenario)
📉 Condition to Enter Sell:
❌ Sell below the low — wait for the 15-minute candle to close below ₹25,580.
This confirms that sellers have taken control and bearish pressure is building.
🎯 Profit Targets:
🥇 Target 1: ₹25,545
🥈 Target 2: ₹25,525
🥉 Target 3: ₹25,469
🛑 Stop-Loss (SL):
Place SL just above the breakout candle’s high (around ₹25,610).
💡 When a candle closes below ₹25,580, it breaks a support level. Selling below the low helps you follow the downward momentum as price may move toward the lower targets.
⚙️ Risk-Management Tips
🔹 Wait for the candle to close — never enter early.
🔹 Risk only 1–2% of your total capital per trade.
🔹 Always use Stop-Loss (SL) and Target orders together.
🔹 Avoid trading during news events or high volatility periods.
🔹 Stay disciplined — no emotional or revenge trading.
⚠️ Disclaimer
📜 This setup is for educational purposes only. I am not SEBI registered. This is not financial advice. Trading in NIFTY or any financial market involves risk. Please do your own analysis or consult a SEBI-registered financial advisor before taking any trade.

#NIFTY Intraday Support and Resistance Levels - 12/11/2025Nifty is expected to open with a gap up near the 25,700–25,750 zone, continuing its positive momentum from the previous sessions. The index is approaching a crucial resistance zone, and a sustained move above this level may trigger further upside momentum.
If Nifty sustains above 25,750–25,800, traders can look for long opportunities, with potential upside targets at 25,850, 25,900, and 25,950+. A breakout beyond 26,000 could extend the rally toward 26,150–26,250, signaling a shift into a stronger bullish phase.
On the downside, support lies near 25,700, and below that, 25,600–25,500 will act as a strong demand zone. A break below 25,700 could trigger short-term profit booking toward lower supports.
Overall, with a gap up opening, market sentiment remains bullish, but traders should monitor whether Nifty can sustain above 25,750. Failing to hold this level could lead to range-bound movement or mild retracement, while sustained strength may confirm a fresh breakout toward 26,000+.

NIFTY50 12.11.25 ● Add Your Watchlist ●
📊 Chart to Study For Swing Trading
➡️ STOCK NAME : NIFTY 50
▫️Date : 12.11.25
🔸️ Pattern : TRENDLINE BREAKOUT AND RETEST
🔸️Timeframe : Dayli & 15 minit
🔸️Registan Lavel : 26000, 26096,26266
🔴 Chart is Only For Education Purpose

NIFTY Levels for Today
Here are the NIFTY's Levels for intraday (in the image below) today. Based on market movement, these levels can act as support, resistance or both.
Please consider these levels only if there is movement in index and 15m candle sustains at the given levels. The SL (Stop loss) for each BUY trade should be the previous RED candle below the given level. Similarly, the SL (Stop loss) for each SELL trade should be the previous GREEN candle above the given level.
Note: This idea and these levels are only for learning and educational purpose.
Your likes and boosts gives us motivation for continued learning and support.

Daily analysis Nifty: 12/11/25Daily levels for Nifty. Gift Nifty is trading higher, and if the price opens with a gap up, it is expected to fill the gap and then continue to rise. All the possibilities are shared here.

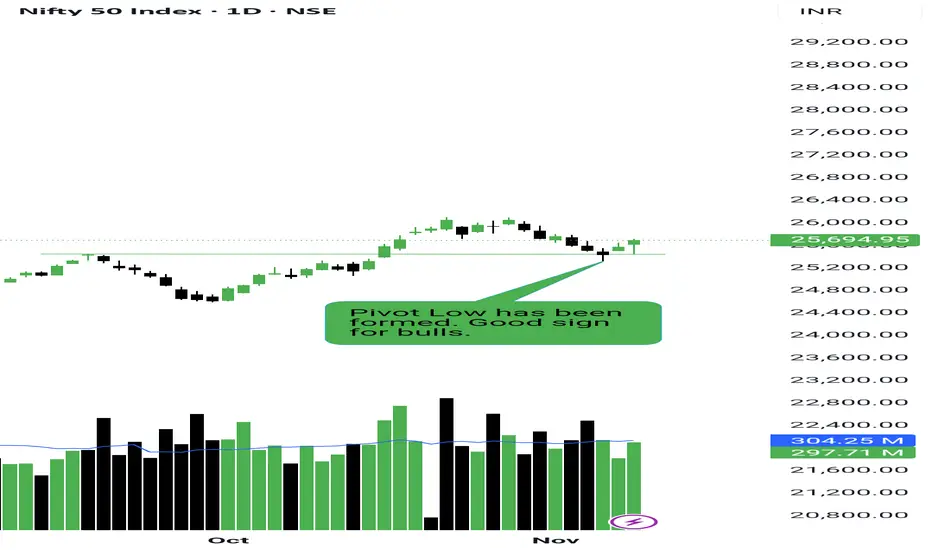
NIFTY just turned BULLISH!!As we can see NIFTY managed to close above previous swing and as per our analysis, its a sign of REVERSAL, moreover we can see it is getting rejected from a psychological level and a very strong demand zone hence we may now expect NIFTY to continue its bull run as long as it sustains itself above 25500.

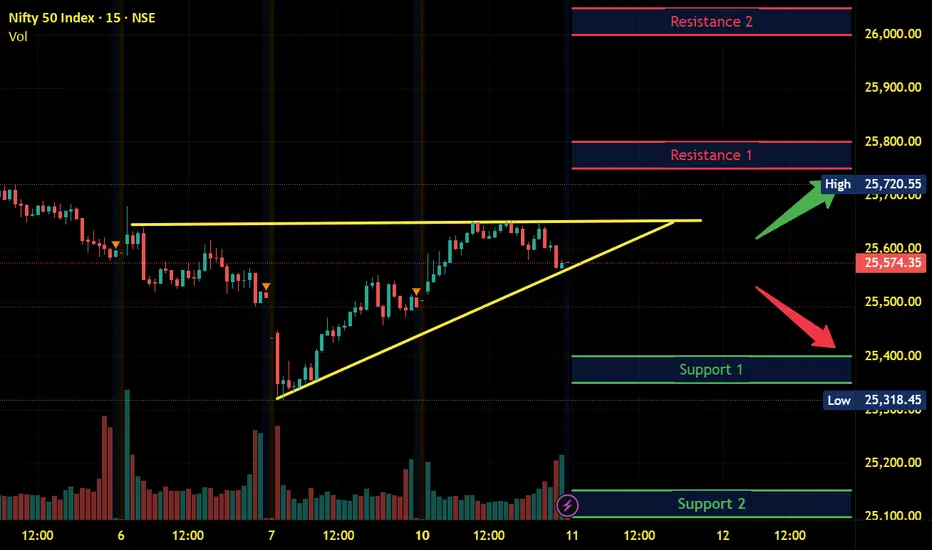
Nifty Intraday Analysis for 11th November 2025NSE:NIFTY
Index has resistance near 25750 – 25800 range and if index crosses and sustains above this level then may reach near 26000 – 26050 range.
Nifty has immediate support near 25400 – 25350 range and if this support is broken then index may tank near 25150 – 25100 range.
Nifty Strong, Stocks Struggling — Smart Money RotatingToday NSE:NIFTY reacted exactly the way we predicted yesterday, which clearly shows the market is regaining good health for our setups.
From here on, our Shakeout and Momentum setups should start working well again.
Nifty’s Pivot has now climbed to 25620 — this will act as support for tomorrow. If we get an entry near this level, buying would be a wise move.
PP is quite good, meaning the move ahead will likely be sharp.
Retailers’ psychological index also moved up, but breadth hasn’t improved yet.
Trend hasn’t turned positive either, as Nifty’s health still sits in the Red zone.
However, intraday momentum has improved.
Considering all these points, stock picking will be challenging right now because the market trend is still down while the index is showing strength. We’re back to that classic phase again — “Index up, but stock breakouts failing.”
However, sector-specific plays will shine. Stocks like #SCI from the shipping sector look strong — that’s where smart money rotates. It’s always the strongest stock in the strongest sector that leads the next wave.
Pharma and Energy sectors are also showing slow but steady buildups.
That’s all for the day. Take care and have a profitable tomorrow.
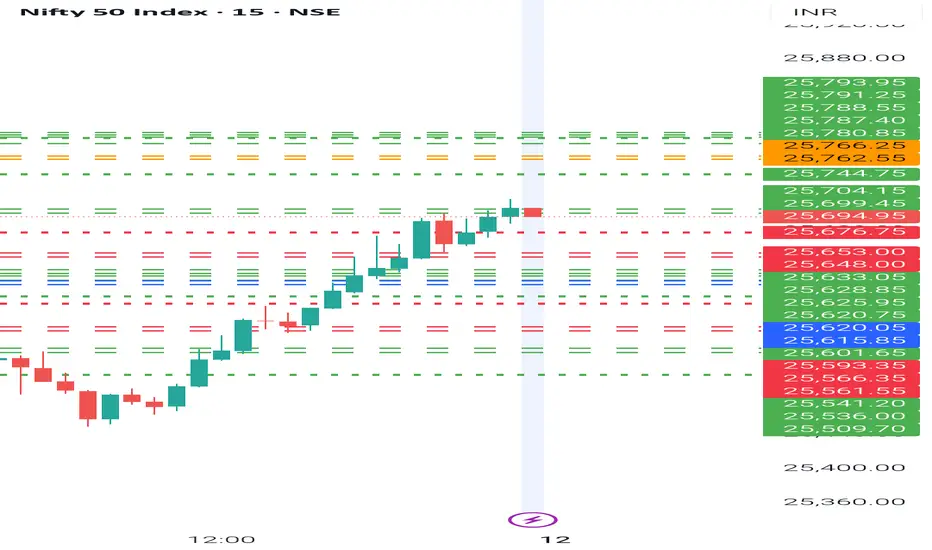
NIFTY- Intraday Levels - 12th November 2025If NIFTY sustain above 25704 above this bullish then around 25744/62/66 strong level then 25780/93 very strong level above this more bullish above this wait
If NIFTY sustain below 25676/53/48 below this bearish then around 25633/15/01 strong level below this more bearish then around 25566/61 then 25541/36/09 below this wait
My view :-
"My viewpoint, offered purely for analytical consideration, The trading thesis is bearish tactical approach ( sell on rise ) however be advised Exit Poll may or may not have impact on the movement.
This analysis is highly speculative and is not guaranteed to be accurate; therefore, the implementation of stringent risk controls is non-negotiable for mitigating trade risk."
Consider some buffer points in above levels.
Please do your due diligence before trading or investment.
**Disclaimer -
I am not a SEBI registered analyst or advisor. I does not represent or endorse the accuracy or reliability of any information, conversation, or content. Stock trading is inherently risky and the users agree to assume complete and full responsibility for the outcomes of all trading decisions that they make, including but not limited to loss of capital. None of these communications should be construed as an offer to buy or sell securities, nor advice to do so. The users understands and acknowledges that there is a very high risk involved in trading securities. By using this information, the user agrees that use of this information is entirely at their own risk.
Thank you.
nifty 50, 15 minutes chart11/11/2025
nifty 50,15 minutes chart
showing bullish momentum but wait until resistance breakout