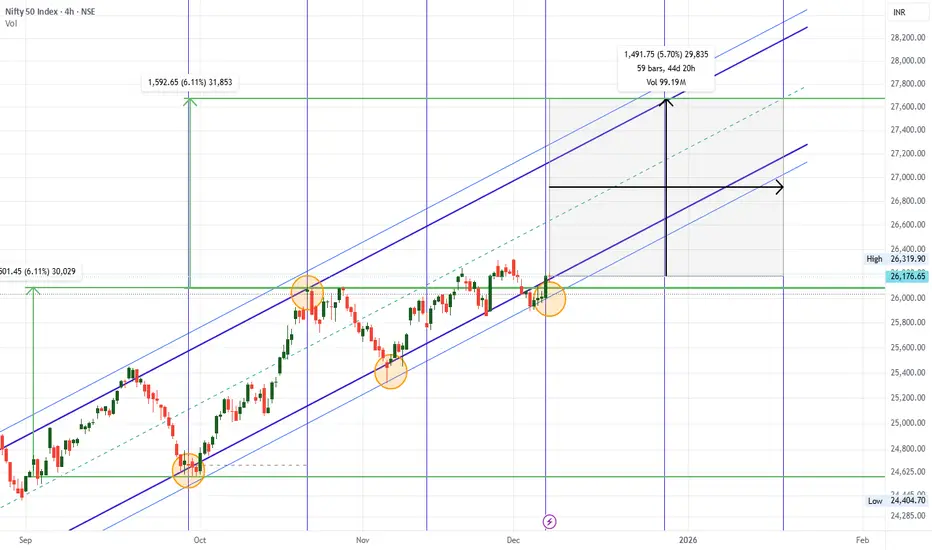
NIFTY 27500+ Target possible by Feb End.NIFTY 27500+ Target possible by Feb End.
Nifty is seen breaking out from ATH of 26300+. Momentum looks very Bullish on Nifty.
With the RBI Rate cut & growing GDP .... Banking / Auto Sectors looks good for few quarters. Investment done in Quality stock would provide gains of 10-15% in coming 2-3 Quarters.
LTP - 26186
SL - 25600
Targets - 27500+
Risk Reward Ratio - 1: 2.25
Happy Investing.
Trade ideas
#Nifty Weekly 08-12-25 to 12-12-25#Nifty Weekly 08-12-25 to 12-12-25
25850-26350 is the sideways range and option sellers can consider for next week.
If Nifty sustains above 26350, more upside possible and targets are 26480/26600.
Short level is only below 25850 for 25700/25500.
View: Sideways to bullish.

NIFTY : Trading levels and Plan for 09-Dec-2025📊 NIFTY TRADING PLAN — 09 DEC 2025
Nifty closed around 25,933, sitting just below Opening Resistance/Support (25,958).
Price remains in a corrective structure but is approaching major intraday support below.
Key Levels from the chart:
• Opening Resistance / Support: 25,958
• Last Intraday Resistance: 26,082
• Major Resistance: 26,136
• Last & Important Support Zone: 25,770 – 25,812
• Deeper Support: 25,732
Market sentiment is still fragile, and tomorrow’s opening will determine short-term direction.
🚀 1. GAP-UP OPENING (100+ points)
A gap-up above 26,020–26,050 places price close to the last intraday resistance cluster.
1. If price opens above 25,958 and retests it successfully
• Do NOT chase the opening candle.
• Wait for a retest of 25,958 showing bullish confirmation (wick rejection or CHoCH).
• Long entry activates → Targets: 26,082 → 26,136.
• Book partial profits near 26,082 as sellers previously reacted there.
2. If gap-up opens inside the resistance band (26,082–26,136)
• Avoid fresh longs — this zone is historically a rejection area.
• Look for bearish signs → If rejection occurs → Short only after price falls under 25,958.
• Downside targets: 25,900 → 25,850.
3. If price breaks and sustains above 26,136
• Strong bullish momentum.
• Next targets: 26,200 → 26,240.
• Trail stop-loss to protect profits.
📌 Educational Note:
Gap-ups typically require validation — breakouts without retests often fail. Always wait for a confirmation candle.
⚖ 2. FLAT OPENING (around 25,900–25,950)
Flat opens allow clean level-by-level trading and reduce whipsaw risk.
1. If price reclaims 25,958 and sustains
• Bulls gain early strength.
• Long trades activate on breakout + retest.
• Targets: 26,020 → 26,082 → 26,136.
2. If price rejects 25,958
• Lower-high formation indicates weakness.
• Short trades become valid toward 25,880 → 25,812.
3. If price trades between 25,900–25,958 initially
• Expect range-bound movement.
• Buy only near the lower range boundary with support confirmation.
• Sell only at the upper boundary with resistance confirmation.
📌 Educational Note:
Flat openings expose the true intention of the first 15–30 mins. Structural clarity matters more than speed.
📉 3. GAP-DOWN OPENING (100+ points)
A gap-down into 25,850–25,780 brings price directly into the strongest demand region on the chart.
1. If price opens inside 25,770–25,812 (Last & Important Support Zone)
• Absolutely avoid shorting this zone — strong buying expected.
• Wait for reversal candle patterns (hammer, engulfing, CHoCH).
• If reversal confirmed → Long toward 25,900 → 25,958.
2. If price opens near 25,732
• This is deeper support.
• Look for absorption of selling → If reversal appears → Long with targets:
→ 25,812 → 25,900.
3. If 25,732 breaks decisively
• Avoid catching a falling knife.
• Wait for a retest of 25,732.
• If retest rejects → Short continuation toward 25,670 → 25,620.
📌 Educational Note:
Gap-downs sweep liquidity. Smart money accumulates at support before trend reversals. Patience is key.
🛡 RISK MANAGEMENT TIPS FOR OPTIONS TRADERS
1. Do NOT trade the first 5 minutes after a gap opening.
Premiums fluctuate wildly.
2. Avoid buying far OTM options after a big gap.
IV crush + theta decay = quick capital loss.
3. Use strict stop-loss based on price levels, not premium.
4. Never risk more than 1–2% of your capital on a single trade.
5. High IV → Option selling strategies (credit spreads) work better.
Low IV → Option buying becomes more effective.
6. Book partial profits near key reaction levels:
25,958 / 26,082 / 26,136.
7. Avoid revenge trading — protect capital first.
📌 SUMMARY & CONCLUSION
• Bullish bias above 25,958, with targets toward 26,082 → 26,136.
• Choppy or neutral zone between 25,900–25,958 until breakout.
• Strong bullish reversal zones:
– 25,770–25,812
– 25,732
• Always trade with confirmation — retest entries provide the highest reliability.
• Strict risk management is essential in volatile conditions.
⚠ DISCLAIMER
I am not a SEBI-registered analyst.
This trading plan is purely for educational purposes and should not be considered investment advice.
Market conditions can change rapidly — always use your own judgment and proper risk controls.

Nifty 50 - Elliott Wave AnalysisIncase Nifty Price close above 26200 level B Wave (Corrective Wave) Extended at 28200 to 29000 level then started C wave Correction so adjust your position and hedging

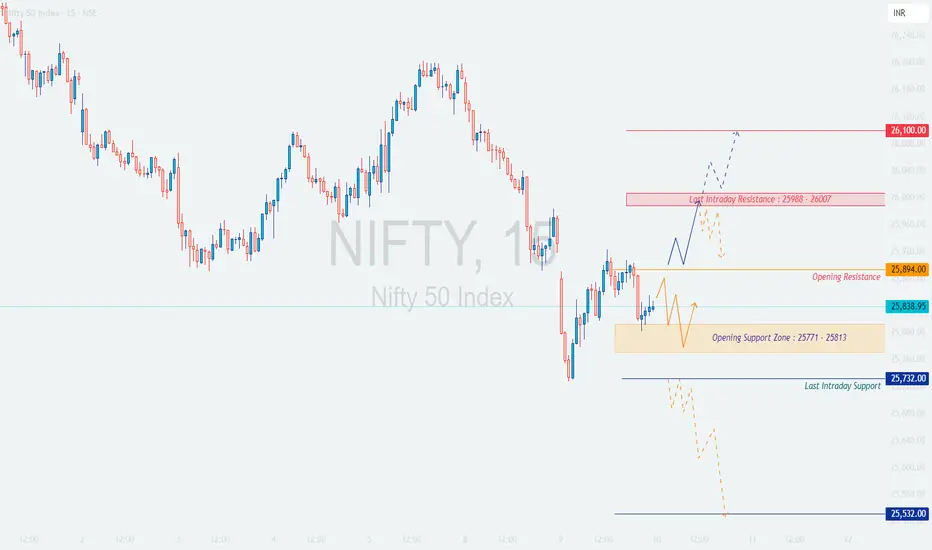
NIFTY : Trading levels and Plan for 10-Dec-2025📊 NIFTY TRADING PLAN — 10 DEC 2025
Nifty closed near 25,839, sitting just below the Opening Resistance (25,894) and just above a broad Opening Support Zone (25,771–25,813).
Major levels from the chart:
• Opening Resistance: 25,894
• Last Intraday Resistance: 25,988 – 26,007
• Major Resistance: 26,100
• Opening Support Zone: 25,771 – 25,813
• Last Intraday Support: 25,732
• Deep Support: 25,532
Tomorrow’s opening direction near these zones will define the intraday trend.
🚀 1. GAP-UP OPENING (100+ points)
A gap-up above 25,930–25,950 takes price close to the major resistance cluster.
1. If price opens above 25,894 and retests the level successfully
• Avoid jumping in on the first candle.
• Wait for a retest of 25,894 — if it holds with bullish wicks or CHoCH → Long entry.
• Targets: 25,988 → 26,007 → 26,100.
• Book partial profits near 26,007 (previous rejection zone).
2. If price opens directly inside 25,988–26,007 (Last Intraday Resistance)
• Avoid fresh longs — very high chance of sellers reacting here.
• Look for rejection → If price drops back below 25,894, safe short entries activate with downside targets:
→ 25,850 → 25,800.
3. If price breaks above 26,100 and sustains
• Signals strong bullish momentum.
• Upside extension possible toward 26,150–26,180.
• Trail SL aggressively to protect profits.
📌 Educational Note:
Gap-ups often run into overhead supply. A retest-based entry confirms institutional participation and filters out false breakouts.
⚖ 2. FLAT OPENING (around 25,820–25,860)
This scenario offers clean structural trades as the market develops organically.
1. If price reclaims and sustains above 25,894
• Bullish momentum begins.
• Break + retest of 25,894 triggers long entries.
• Targets: 25,950 → 25,988 → 26,007.
2. If price rejects 25,894
• Bearish structure appears with lower highs.
• Short trades valid toward the Opening Support Zone (25,771–25,813).
• Break below this support opens next target: 25,732.
3. If price remains between 25,813–25,894
• Range-bound behavior highly likely.
• Trade only extremes:
– Buy near 25,771–25,813 (with confirmation).
– Sell near 25,894 (with confirmation).
📌 Educational Note:
Flat opens reveal trend direction slowly but clearly. Early structure (higher-lows or lower-highs) guides bias for the rest of the session.
📉 3. GAP-DOWN OPENING (100+ points)
A gap-down toward 25,700–25,750 places Nifty near major liquidity zones.
1. If price opens near 25,771–25,813 (Opening Support Zone)
• This zone is designed to catch liquidity.
• Avoid shorting immediately.
• Look for bullish reversal signs → If confirmed → Long toward 25,850 → 25,894.
2. If price opens around 25,732 (Last Intraday Support)
• Expect a potential sharp reaction.
• Buyers may step in aggressively.
• Reversal = Long opportunities toward 25,800 → 25,894.
3. If price opens near or below 25,532 (Deep Support)
• Do NOT catch a falling knife.
• Wait for a strong reversal or retest.
• If price retests 25,532 and rejects → Short continuation toward 25,480–25,450.
• If reversal occurs → Long back toward 25,650–25,700.
📌 Educational Note:
Gap-downs often sweep stops before reversing. Your edge lies in patience and confirmation, not prediction.
🛡 RISK MANAGEMENT TIPS FOR OPTIONS TRADERS
1. Avoid trading the first 5 minutes of market open during gap scenarios.
Premiums behave irrationally.
2. Do NOT buy far OTM calls/puts after big gaps.
IV crush + theta decay = rapid losses.
3. Use price-level-based stop-loss, not premium SL.
Price structure is more reliable.
4. Risk per trade = maximum 1–2% of capital.
5. High IV → Prefer selling strategies (credit spreads).
Low IV → Buying strategies become more efficient.
6. Always book partial profits at marked levels:
25,894 / 25,988 / 26,007 / 26,100.
7. Avoid revenge trading — protect capital first.
📌 SUMMARY & CONCLUSION
• Bullish bias only above 25,894, with upside toward 25,988 → 26,007 → 26,100.
• Range zone between 25,771–25,894 until a breakout occurs.
• Strong reversal opportunities near support zones:
– 25,771–25,813
– 25,732
– 25,532
• Always trade breakout + retest or reversal confirmation.
• Proper risk management is more important than direction.
⚠ DISCLAIMER
I am not a SEBI-registered analyst.
This trading plan is purely for educational purposes and must not be considered investment advice.
Always apply your own judgment and strict risk management while trading.
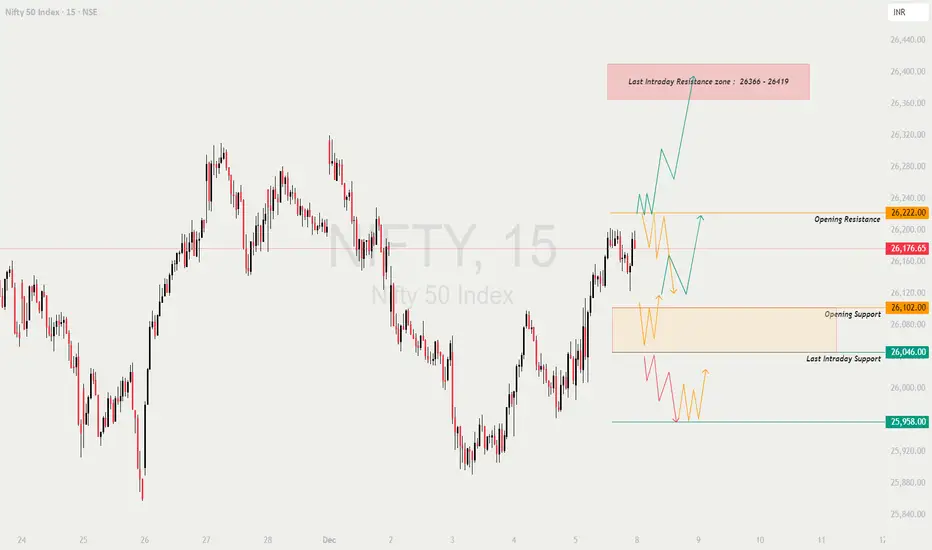
NIFTY : Trading levels and Plan for 08-Dec-2025📊 NIFTY TRADING PLAN — 08 DEC 2025
NIFTY closed around 26,176, sitting just between the Opening Resistance (26,222) and the Opening Support zone (26,102).
Tomorrow’s opening reaction at these levels will decide whether Nifty continues upward into the major resistance zone or retraces back into support.
Levels from the chart:
• Opening Resistance: 26,222
• Opening Support: 26,102
• Last Intraday Support: 26,046
• Major Buyer’s Support: 25,958
• Last Intraday Resistance Zone: 26,366 – 26,419
A clear directional move will come only after Nifty exits the Opening Support–Opening Resistance region.
🚀 1. GAP-UP OPENING (100+ points)
A gap-up above 26,260+ puts Nifty near or above the Opening Resistance and may trigger trend continuation.
1. If price opens above 26,222 and retests it
• Avoid jumping in at the open.
• Wait for price to retest 26,222 and show bullish structure (wick rejections, CHoCH).
• Once confirmed → Long entry toward 26,300 → 26,366 → 26,419 (resistance zone).
• Book partial profits inside the resistance zone.
2. If price opens directly inside 26,366–26,419 (Last Intraday Resistance Zone)
• Avoid fresh longs here — high probability of intraday rejection.
• Look for bearish wick rejections → Short opportunity back toward 26,300 → 26,222.
3. If price gives a strong breakout above 26,419
• This indicates momentum expansion.
• Upside targets open toward 26,480–26,520.
• Trail your stop-loss below the breakout candle.
📌 Educational Note:
Gap-ups must be traded with confirmation and retests, not emotions. Institutions test breakout zones before continuing trend.
⚖ 2. FLAT OPENING (around 26,160–26,190)
A flat open near the middle of the chart’s structure gives excellent clarity for level-by-level trading.
1. Sustained move above 26,222
• Break + retest above this level activates longs.
• Targets: 26,300 → 26,366 → 26,419.
2. If price rejects 26,222
• Look for bearish rejection or CHoCH.
• Short trade valid toward 26,102.
• Break below 26,102 extends move to 26,046.
3. If price trades inside 26,102–26,222 zone
• Expect consolidation / whipsaws.
• Trade only extremes:
– Long only near 26,102 with confirmation.
– Short only near 26,222 with confirmation.
📌 Educational Note:
Flat opens allow structure to form naturally. Higher-lows = bullish. Lower-highs = bearish. Avoid guessing—react to levels.
📉 3. GAP-DOWN OPENING (100+ points)
A gap-down toward 26,000 → 25,960 puts NIFTY directly into major supports.
1. If price opens near 26,046 (Last Intraday Support)
• This is a strong reaction zone.
• Do NOT short blindly here.
• Look for reversal candles → If confirmed → Long toward 26,102 → 26,176.
2. If price opens inside 25,958 (Major Buyer’s Support)
• Expect buyers to defend this level aggressively.
• Ideal place for a reversal trade.
• Once reversal confirmed → Target 26,046 → 26,102.
3. If price breaks below 25,958 decisively
• Avoid catching falling knives.
• Wait for a retest of 25,958 zone.
• If retest rejects → Short continuation target becomes 25,900–25,870.
📌 Educational Note:
Gap-downs often create liquidity sweeps. Smart money accumulates positions at support before pushing price higher. Always trade reaction, not prediction.
🛡 RISK MANAGEMENT TIPS FOR OPTIONS TRADERS
1. Avoid trading first 5 minutes during gap openings.
High volatility = premium traps.
2. Do NOT buy far OTM calls/puts after big gaps.
IV crush + theta → Fast losses.
3. Always use price-action-based stop losses, not premium-based ones.
4. Never risk more than 1–2% of capital per trade.
5. High IV → Prefer option selling (credit spreads).
Low IV → Option buying becomes favourable.
6. Take partial profits at important levels such as:
26,102 / 26,222 / 26,366 / 26,419.
7. Avoid revenge trading — protect capital at all costs.
📌 SUMMARY & CONCLUSION
• Bullish bias above 26,222, with targets: 26,300 → 26,366 → 26,419.
• Range-bound structure likely between 26,102–26,222 until breakout.
• Strong reversal zones:
– 26,046
– 25,958
• Gap openings must be handled with retest-based entries only.
• Trade level-to-level with strict risk management.
⚠ DISCLAIMER
I am not a SEBI-registered analyst.
This trading plan is strictly for educational purposes and not investment advice.
Market behaviour can change quickly—always use your own judgment and risk controls.
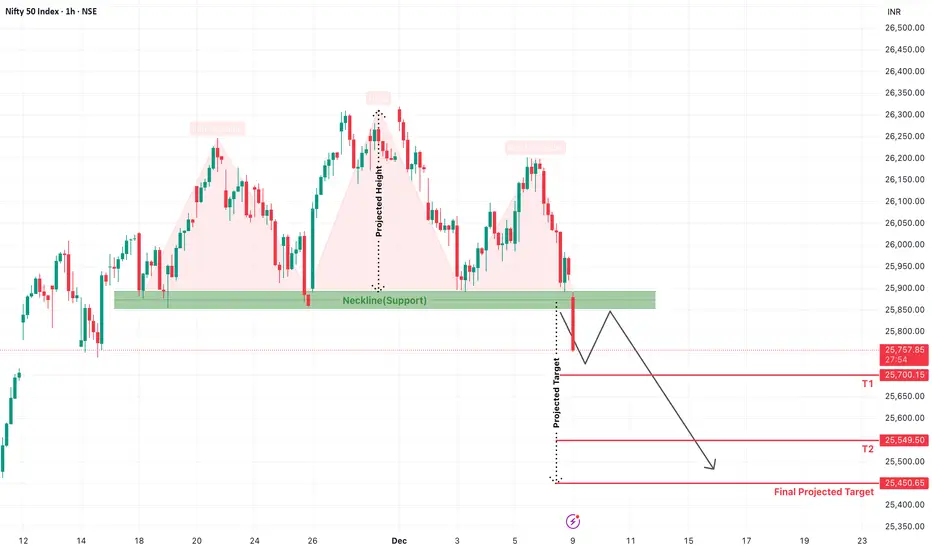
Nifty 50 Forms a Bearish Head & Shoulders PatternThe Nifty 50 index has officially broken below a crucial support zone, completing a classic Head & Shoulders reversal pattern on the 1-hour chart. This bearish structure normally appears at the top of an uptrend and indicates a potential trend reversal — and that’s exactly what the current setup suggests.
Key Technical Highlights
The Left Shoulder, Head, and Right Shoulder are clearly visible.
Nifty attempted multiple bounces from the Neckline support zone (around 25,850–25,900) but failed to sustain.
Today’s clean breakdown below this neckline confirms the reversal pattern.
According to the projected height method, Nifty may extend its decline towards the following levels:
Downside Targets
T1: 25,700
T2: 25,549
Final Projected Target: 25,450
What to Expect Next?
A short pullback or retest of the neckline is possible, which may attract sellers again. As long as Nifty trades below the neckline zone, the bias stays bearish and deeper corrections remain likely.
# Learning -->> Price ActionHi Friends,
I've tried to put in something about PRICE ACTION . If you like it , dont forget to hit BOOST
You're most welcome to add & if this one works for you, i'll come up with Part # 2
Main sab kuch layman + practical trader mindset se explain karunga
PART # 1️⃣
A Simple 10-Step Price Action Strategy
Isko aap apna basic trading framework maan sakte ho.
Step 1: Decide Timeframe
Intraday: 5m / 15m + 1h for trend
Swing: Daily + Weekly
👉 Rule: Pehle badi timeframe se trend dekho, phir chhoti pe entry dhoondo.
Step 2: Identify Main Trend
On higher timeframe (Daily / 1h):
Uptrend: Higher Highs, Higher Lows
Downtrend: Lower Highs, Lower Lows
Sideways: Price range ke andar idhar-udhar
👉 Trade mostly with trend, not against it.
Step 3: Mark Key Levels
Chart khol ke manually mark karo:
Strong Support (jahan se price baar-baar upar gaya)
Strong Resistance (jahan se baar-baar neeche aaya)
Recent swing high/low
Ye levels aapke decision zones hain.
Entry beech mein nahi, levels ke aas-paas chahiye.
Step 4: Wait for Price to Come to Your Level
Ab sabse important part:
Price ko aane do support / resistance ke paas
Forced trade mat lo
👉 Trading = Waiting game, not “always doing something”.
Step 5: Look for Candle Signal (Price Action Pattern)
Jab price level pe aaye, tab dekho:
Reversal signs:
Hammer / Pin bar
Engulfing candle
Long wick rejection
Continuation signs:
Marubozu
Small pullback + strong follow-through candle
Entry tab socho jab candle aapke side ka indication de.
Step 6: Confirm with Structure / Confluence
Confluence = 2–3 cheezein ek saath:
Support + bullish candle
Resistance + bearish candle
Trendline + horizontal level
Level + gap area / previous demand / supply
👉 Jitni zyada confluence, utna high-probability setup.
Step 7: Define SL (Stop Loss) BEFORE Entry
Fixed rule:
SL always candle ke neeche/ upar (for swings)
Intraday: thoda tight but logical (level break/nikalne ke baad)
Fixed % nahi, price structure based SL
If SL too big → Skip the trade. FOMO nahi.
Step 8: Position Size Calculate karo
Risk decide karo:
Example: Capital = 1,00,000
Risk per trade = 1% = ₹1,000
Agar SL = ₹10 per share, toh quantity:
1000 / 10 = 100 shares
👉 Pehle risk calculate, baad mein trade.
Step 9: Define Targets & Management Plan
Simple logic:
1st target: Risk ka at least 1.5x–2x
Part profit book at T1
SL ko cost pe trail after T1
Trend strong ho toh runner quantity chhod do (T2/T3 ke liye)
Step 10: Log, Review, Repeat
Har trade note karo:
Kyu liya?
Entry, SL, Target
Result
Emotion (fear / greed / FOMO?)
Har 20–30 trades ke baad review →
Improvement automatic ho jaayega.
Hope You Liked iT >>> if yes, HIT BOOST
For more insights & trade ideas,
📲 Visit my profile and hit Follow
Warm regards,
Naresh G
SEBI Registered Research Analyst

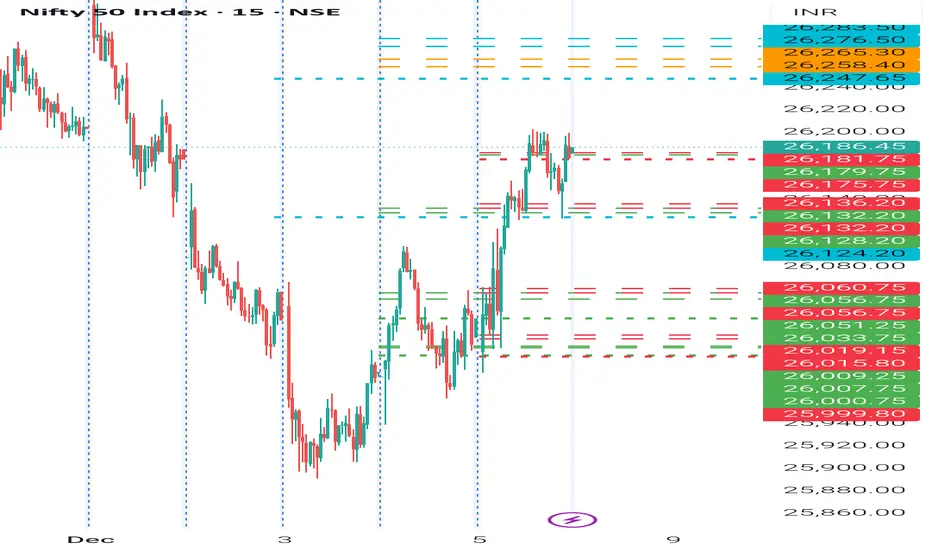
Bounce Expected but Weakness Still There in Market NSE:NIFTY moved exactly the way we expected — a bounce with weakness. You can clearly see this behavior on the chart.
Now let’s look at what today’s data says about tomorrow:
- Candle is green and bounced from the dynamic support zone
- Trend health turned Red today
- Macro Index fell
Buyers’ volume was +32 million in the - morning but dropped to only +4 million by close
- Structure is still bullish
- Momentum is weak
- Pivot has moved up to 26023
So as you can see, only two points indicate bullishness, while the rest lean towards weakness.
Based on this, we can expect a bounce on the index, but the upside may stay limited.
Resistance sits at 26126/26222 if the bounce continues.
However, if Nifty breaks any of above mentioned resistances and sustains below it, we can short again.
Pivot Percentile is extremely tight, meaning whichever move comes — bounce or fall — will be sharp.
My plan for tomorrow:
1. Plan A: Sell-on-Rise near the resistance
2. Plan B: Short below 26000
Selective setups from Auto, IT, and Banks look strong for intraday plays.
That’s all for now.
Take care.
Have a profitable tomorrow.

NIFTY bCOME WEAKNifty After long time forms clear NEGETIVE BREATH .In One Hour chart it has formed bearish HEAD AND SLODER pattern which make it weaker. Closest support is 25890( cash level)
Now we shall remain short till nifty break 26189 level in up side. If it breaks 26189 and sustain above than only we can change out short

No clear direction yet!As we can see NIFTY couldn't break either side of the dojo candle despite its strength showing signs of indecision hence as long as we are between that range, we should remain unbiased and trade according to market sentiments so plan your trades accordingly and cautiously.

NIFTY- Intraday Levels - 8th December 2025If NIFTY sustain above 26186 then 26247/83 above this bullish then around 26371/414 above more bullish this wait
If NIFTY sustain below 26175 below this bearish then 2636/124 support below this more bearish below this wait more levels marked on chart
My view :-
"My viewpoint, offered purely for analytical consideration, The trading thesis is: Nifty ( bullish tactical approach: buy on dip) The market is anticipated to form a top for this expiry.
This analysis is highly speculative and is not guaranteed to be accurate; therefore, the implementation of stringent risk controls is non-negotiable for mitigating trade risk."
Consider some buffer points in above levels.
Please do your due diligence before trading or investment.
**Disclaimer -
I am not a SEBI registered analyst or advisor. I does not represent or endorse the accuracy or reliability of any information, conversation, or content. Stock trading is inherently risky and the users agree to assume complete and full responsibility for the outcomes of all trading decisions that they make, including but not limited to loss of capital. None of these communications should be construed as an offer to buy or sell securities, nor advice to do so. The users understands and acknowledges that there is a very high risk involved in trading securities. By using this information, the user agrees that use of this information is entirely at their own risk.
Thank you.
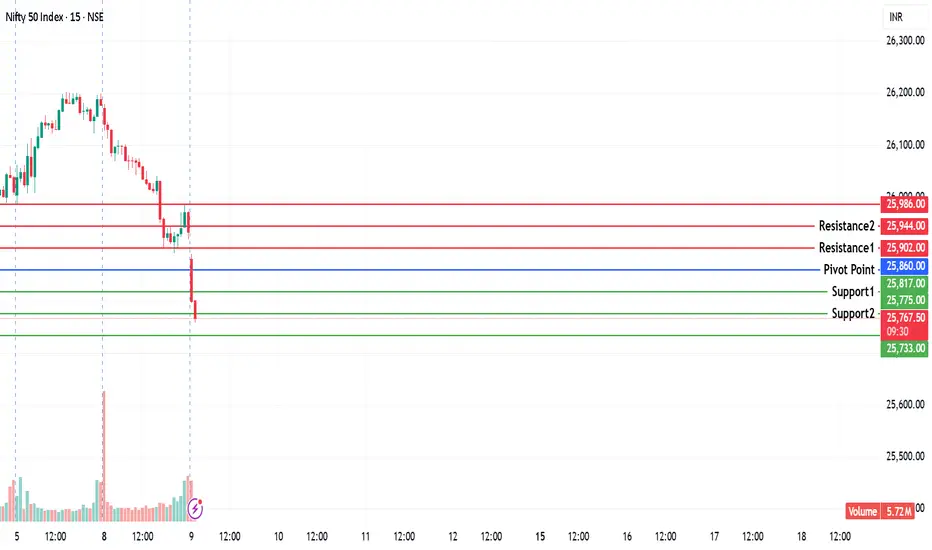
NIFTY KEY LEVELS FOR 09.12.2025NIFTY KEY LEVELS FOR 09.12.2025
Timeframe: 3 Minutes
If the candle stays above the pivot point, it is considered a bullish bias; if it remains below, it indicates a bearish bias. Price may reverse near Resistance 1 or Support 1. If it moves further, the next potential reversal zone is near Resistance 2 or Support 2. If these levels are also broken, we can expect the trend.
When a support or resistance level is broken, it often reverses its role; a broken resistance becomes the new support, and a broken support becomes the new resistance.
If the range(R2-S2) is narrow, the market may become volatile or trend strongly. If the range is wide, the market is more likely to remain sideways
please like and share my idea if you find it helpful
📢 Disclaimer
I am not a SEBI-registered financial adviser.
The information, views, and ideas shared here are purely for educational and informational purposes only. They are not intended as investment advice or a recommendation to buy, sell, or hold any financial instruments.
Please consult with your SEBI-registered financial advisor before making any trading or investment decisions.
Trading and investing in the stock market involves risk, and you should do your own research and analysis. You are solely responsible for any decisions made based on this research
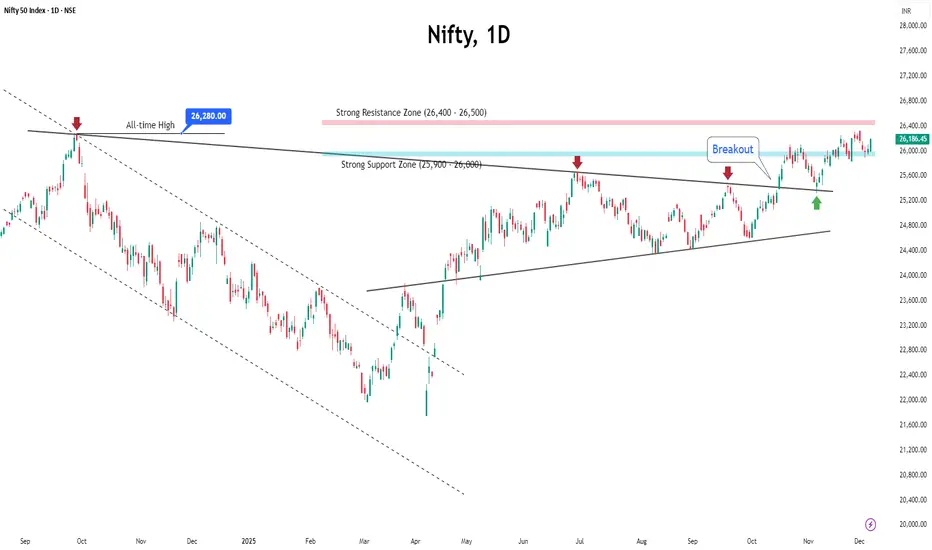
Nifty Holds Support — Is a Fresh Momentum Wave Ahead?The Nifty ended last week almost flat, up 0.6% at 26,186. The index started weak due to profit-booking, FII outflows, and a record-low rupee, but sentiment improved after the RBI cut the repo rate by 25 bps to 5.25%.
Adding to the positive tone, India VIX dropped over 11% to 10.315, highlighting a sharp cooling in volatility and a more stable trading environment.
◉ Technical Setup
Nifty has once again respected its strong support zone between 25,900 and 26,000, bouncing firmly from this level. This zone is expected to remain a key cushion for the coming week as well.
On the upside, the index faces a strong resistance around 26,400–26,500, which will be crucial to watch. A breakout above this could unlock further strength.
For now, the market is likely to trade within this range, oscillating between support and resistance until a clear signal emerges.
◉ Key Trigger This Week
US Fed Meeting (Dec 9–10)
Markets expect a 25 bps rate cut, but mixed signals from Fed officials keep uncertainty high.
A hawkish tone could weigh on global sentiment.
A dovish stance would likely support global markets, especially India.
◉ Suggested Strategy
Investors should adopt a balanced and selective approach:
Favour large caps and sectors that stand to benefit from the RBI rate cut, such as financials and autos,
Export and IT stocks may continue to draw support from the weaker rupee.
For traders, buy-on-dips remains the preferred strategy near strong support levels. Focus on stock-specific setups, maintain moderate position sizes, and stay flexible ahead of the crucial FOMC outcome.
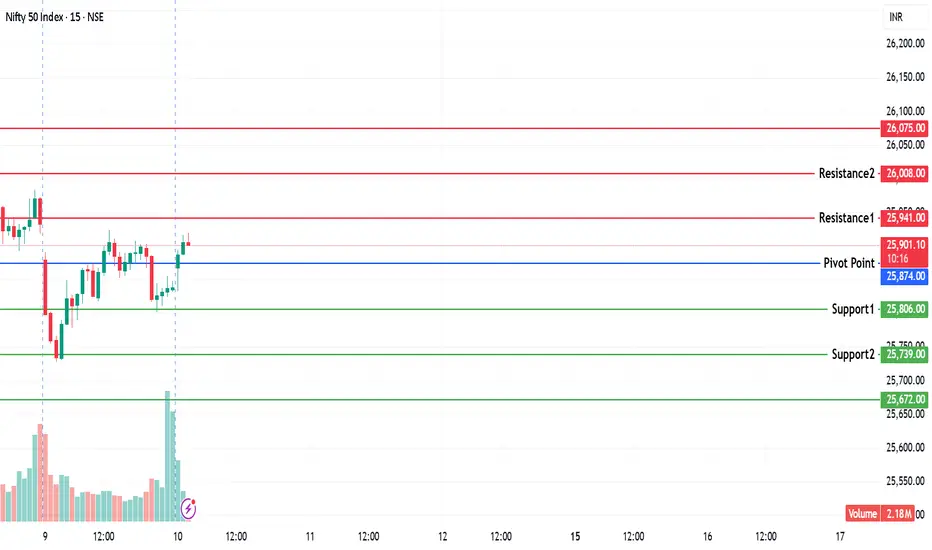
NIFTY KEY LEVELS FOR 10.12.2025NIFTY KEY LEVELS FOR 10.12.2025
Timeframe: 3 Minutes
If the candle stays above the pivot point, it is considered a bullish bias; if it remains below, it indicates a bearish bias. Price may reverse near Resistance 1 or Support 1. If it moves further, the next potential reversal zone is near Resistance 2 or Support 2. If these levels are also broken, we can expect the trend.
When a support or resistance level is broken, it often reverses its role; a broken resistance becomes the new support, and a broken support becomes the new resistance.
If the range(R2-S2) is narrow, the market may become volatile or trend strongly. If the range is wide, the market is more likely to remain sideways
please like and share my idea if you find it helpful
📢 Disclaimer
I am not a SEBI-registered financial adviser.
The information, views, and ideas shared here are purely for educational and informational purposes only. They are not intended as investment advice or a recommendation to buy, sell, or hold any financial instruments.
Please consult with your SEBI-registered financial advisor before making any trading or investment decisions.
Trading and investing in the stock market involves risk, and you should do your own research and analysis. You are solely responsible for any decisions made based on this research
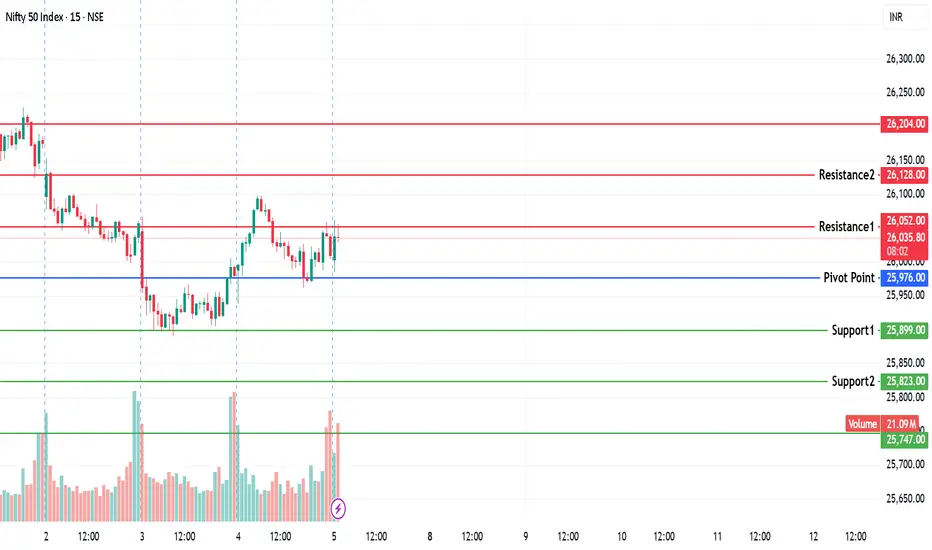
Nifty Intraday Analysis for 05th December 2025NSE:NIFTY
Index has resistance near 26225 – 26275 range and if index crosses and sustains above this level then may reach near 26450 – 26500 range.
Nifty has immediate support near 25850 – 25800 range and if this support is broken then index may tank near 25625 – 25575 range.
Volatility expected on either side as per the RBI MPC outcome and growth forecast for financial year 2025-26.

Elaborative analysis on Nifty: 10/12/25Watch till the end, it will be a little lengthy in comparison to my earlier videos.
This video will cover not only levels of nifty to consider but also a few educational points.
If there is any query regarding any point, mention it in the comment, so I will try to make it in the next video.
Still, no clear trend for Nifty is evident, but be ready for either side of the trend.

Nifty Trend Turns Bearish — Sell-on-Rise Back in FocusNifty Trend Turns Bearish — Sell-on-Rise Back in Focus
Today’s move in NSE:NIFTY was completely unplanned.
And when the market doesn’t move the way I expect, I don’t trade.
So today remained a blank day for me — exactly as it should be.
Now the Nifty trend has officially turned Bearish on the daily chart.
Pivot has moved down to 26010, which shifts the approach back to Sell-on-Rise near the Pivot.
The first resistance is now at 26000, and the next support on Nifty sits at 25750.
On the stock side, #INDIGO looks like an opportunity even in this weakness.
Today’s candle clearly shows buying pressure.
We only need a green confirmation candle to validate the setup.
#BankNifty trend has also changed.
I will short it only if it trades below 59100.
That’s all I have for today.
Take care. Have a profitable tomorrow.
📊 Levels at a Glance:
Pivot: 26010
Resistance: 26000 (Sell-on-Rise zone)
Support: 25750
BankNifty Trigger: Short below 59100
Bias: Sell-on-Rise in index
Stock to Watch: NSE:INDIGO (needs green confirmation)

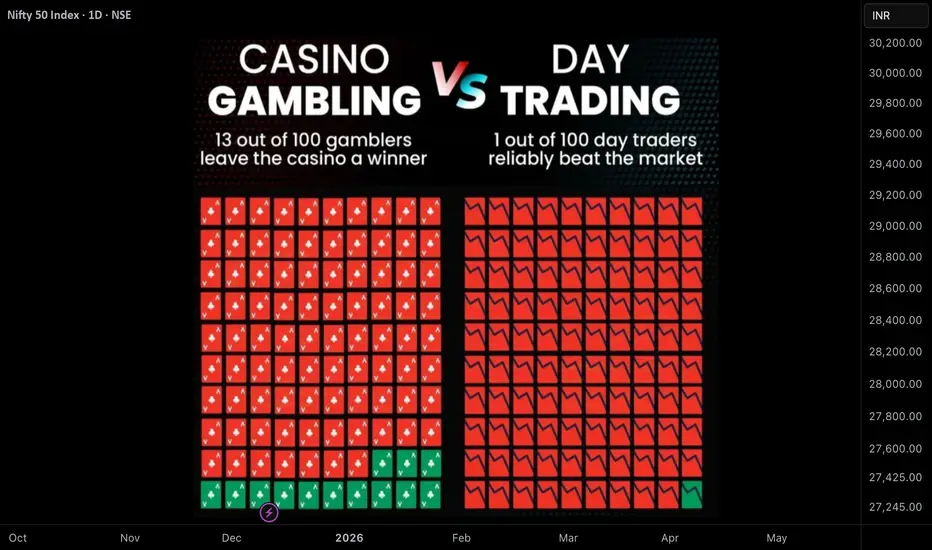
Trading is a SCAM?Is Trading Really Just Glamourized Gambling?
You’ve heard the line. You’ve probably even believed it at some point.
“Trading is just gambling with a fancy name.”
Add to that the widely quoted SEBI number—99% of traders lose money—and it feels like the argument ends right there. Case closed.
Except…it’s not.
People repeat this statistic as if it’s proof that trading is a doomed activity. But very few pause to ask the actual question:
Why do 99% lose?
Not because the game is broken.
Not because success is impossible.
But because most people don’t treat trading like what it truly is.
⸻
Trading is Not Gambling.
Trading is a sport.
And it’s a business.
Let’s break that down.
⸻
1. Trading is a Sport
Athletes don’t step onto the field and expect to win without training.
They practice. They review their performance. They train skills, build endurance, repeat drills thousands of times.
Successful traders do the same.
They learn, observe, analyze.
They train their mind as an athlete trains their body.
But the majority? They come in with zero preparation and expect instant profit.
When reality hits hard, they blame the market instead of acknowledging lack of discipline.
⸻
2. Trading is a Business
Every trade is like a business decision—based on research, risk, planning, and execution.
No business survives without budgeting, strategy, or performance tracking.
Yet most traders operate with no framework, no journal, no clarity.
They buy randomly, exit emotionally, and hope luck carries them.
But business doesn’t run on hope.
Neither does the market.
⸻
The Real Problem Is Not Trading—It’s Approach
Imagine a restaurant owner who never tracks expenses.
Imagine a sprinter who never practices.
Failure would be expected, right?
That’s exactly why most traders lose.
Not because trading is gambling.
But because they gamble instead of trading like professionals.
⸻
The 1% Think Differently
They treat trading like a craft.
They respect losses.
They follow rules.
They focus on long-term consistency—not overnight miracles.
That’s why they win.
⸻
Final takeaway
The next time someone says “trading is gambling,” remember this:
Trading only becomes gambling when you enter unprepared.
Treat it like a sport.
Build it like a business.
Master the game with intention and discipline.
And suddenly, the odds don’t stay at 99% anymore.
#stockmarkets #mindset
Nifty Analysis for Dec 09/10/11, 2025Wrap-up:
Nifty is forming a wxy pattern in wave C of major wave 5 has completed wave w at 25153 and wave x at 24587 and heading towards internal wave y of wave 5. In wave y, wave a is completed at 26104 and b is expected to be completed at 25728 once nifty breaks and sustains above 25908. Thereafter, Nifty will head towards its final wave c of wave y of wave 5.
What I’m Watching for Dec 09/10/11, 2025 🔍
Buy nifty if it breaks and sustains above 25908 for at least 25 min. SL 25728 for a target of 26142-26093.
Disclaimer: Sharing my personal market view — only for educational purpose not financial advice.

Nifty 50 Index Elliot Wave Analysis monthly TFNifty 50 Now in correction face of Grand super cycle . Already Wave A and B Completed. C wave starts now (forming Expanded / Irregular Flat) end up to Minimum Fib Retrace 38.2% to 50% level so expected for correction in nifty 50 through Elliott wave theory so investors proper hedge your position and big buying opportunity is coming soon...

NIFTY KEY LEVELS FOR 05.12.2025NIFTY KEY LEVELS FOR 05.12.2025
Timeframe: 3 Minutes
If the candle stays above the pivot point, it is considered a bullish bias; if it remains below, it indicates a bearish bias. Price may reverse near Resistance 1 or Support 1. If it moves further, the next potential reversal zone is near Resistance 2 or Support 2. If these levels are also broken, we can expect the trend.
When a support or resistance level is broken, it often reverses its role; a broken resistance becomes the new support, and a broken support becomes the new resistance.
If the range(R2-S2) is narrow, the market may become volatile or trend strongly. If the range is wide, the market is more likely to remain sideways
please like and share my idea if you find it helpful
📢 Disclaimer
I am not a SEBI-registered financial adviser.
The information, views, and ideas shared here are purely for educational and informational purposes only. They are not intended as investment advice or a recommendation to buy, sell, or hold any financial instruments.
Please consult with your SEBI-registered financial advisor before making any trading or investment decisions.
Trading and investing in the stock market involves risk, and you should do your own research and analysis. You are solely responsible for any decisions made based on this research
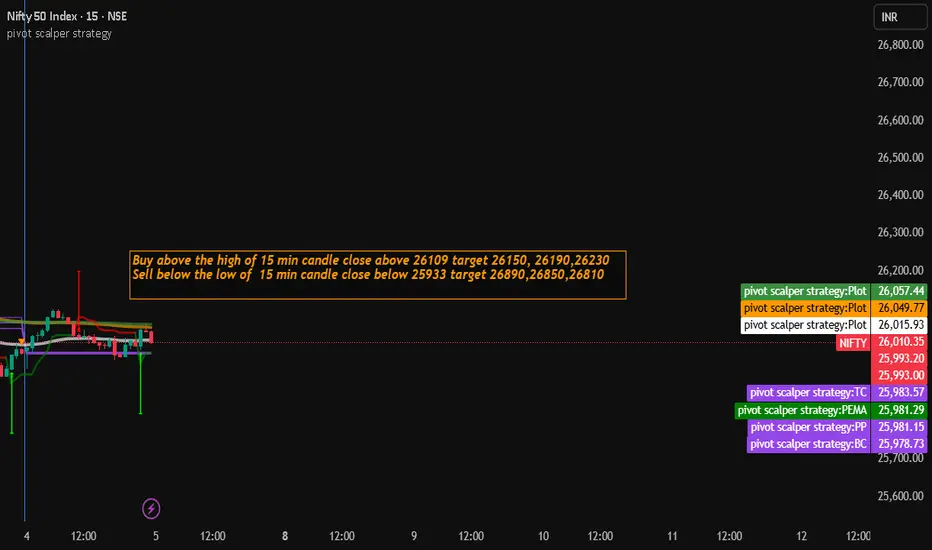
Nifty Trading Strategy for 05th December 2025📊 NIFTY INTRADAY TRADE SETUP – 15 MIN BREAKOUT STRATEGY
🟩 BUY SETUP (LONG TRADE)
🔔 Entry Condition
Wait for a 15-minute candle to CLOSE above ₹26,109
Entry triggers only if the breakout candle closes above the level, not just a wick spike
A strong body candle + increasing volume increases accuracy
📈 Buy Entry Level:
➡️ Buy Above: ₹26,109
🎯 Targets:
TP1: ₹26,150
TP2: ₹26,190
TP3: ₹26,230
🛡 Stop-Loss Suggestion:
SL ideally below the breakout candle low
📌 Important Notes for BUY Trade:
Prefer entries when price retests the breakout zone → Support turns into Support
Avoid taking trades right before major economic events (RBI, Fed, unemployment data, etc.)
Watch for rejection candles around TP1 – Trail SL once TP1 hits
Volume confirmation = stronger probability of continuation
🟥 SELL SETUP (SHORT TRADE)
🔔 Entry Condition
Wait for a 15-minute candle to CLOSE below ₹25,933
Entry only after a clear close below the level
📉 Sell Entry Level:
➡️ Sell Below: ₹25,933
🎯 Targets:
TP1: ₹25,890
TP2: ₹25,850
TP3: ₹25,810
🛡 Stop-Loss Suggestion:
SL above the breakdown candle high
📌 Important Notes for SELL Trade:
Avoid selling into strong support zones—mark previous swing lows
Prefer entries when breakdown retests happen
If volume is weak, avoid as false breakouts are common in NIFTY
Trail SL once TP1 is hit
🧭 GENERAL GUIDELINES FOR BOTH TRADES
🌀 Trade during high liquidity sessions: 9:20 AM – 11:30 AM and 1:45 PM – 3:10 PM
📏 Maintain proper risk management: Never risk more than 1–2% per trade
📊 Use indicators only for confirmation: VWAP, Supertrend, Volume, and Market Structure
⚠️ No revenge trading; wait for clean candle close confirmations
🧠 Stick to your plan—Don’t chase moves
⚠️ DISCLAIMER
📜 I am not a SEBI-registered analyst.
All the analysis shared is purely for educational and informational purposes only.
Trading in stock markets involves high financial risk, and you should consult your financial advisor before taking any trades.
You are fully responsible for your profits, losses, and trading decisions.