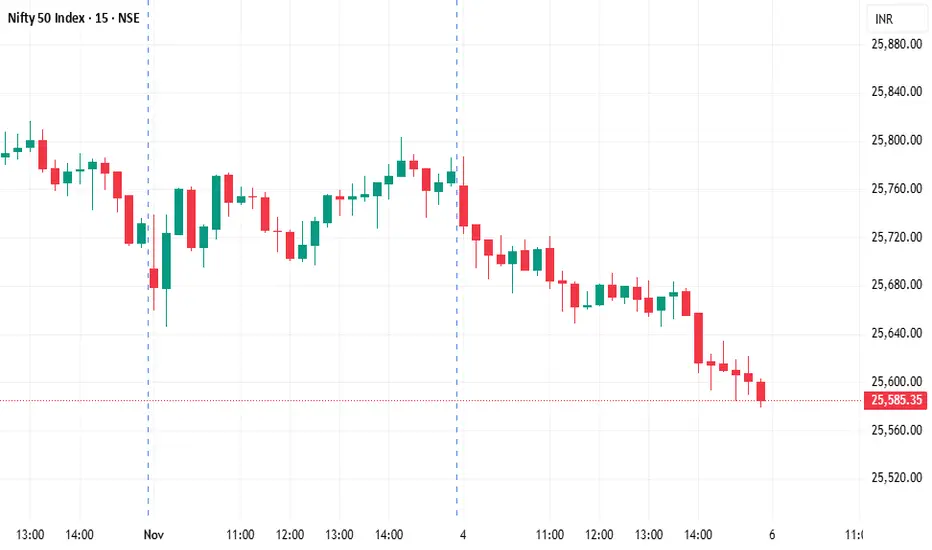
#NIFTY Intraday Support and Resistance Levels - 06/11/2025Nifty is expected to open with a gap up near the 25,750 zone, showing early signs of recovery after a recent decline. The opening above the immediate resistance area indicates potential buying interest, but sustained momentum will be key to confirming a reversal.
If Nifty holds above 25,750–25,780, it may extend its move toward 25,850, 25,900, and 25,950+. A breakout above 25,950 could trigger further upside toward 26,000–26,050, strengthening the short-term bullish bias.
On the downside, initial support lies near 25,700–25,650. A failure to sustain above this zone could lead to renewed selling pressure toward 25,600, 25,550, and 25,500, which remains a crucial support level for the day.
Overall, with a gap up opening near 25,750, sentiment is expected to remain mildly positive as long as the index sustains above 25,700. Traders should monitor price action near the 25,900 zone for potential resistance and use a trailing stop loss to protect profits in case of volatility.
Trade ideas

NIFTY Levels for TodayHere are the NIFTY's Levels for intraday (in the image below) today. Based on market movement, these levels can act as support, resistance or both.
Please consider these levels only if there is movement in index and 15m candle sustains at the given levels. The SL (Stop loss) for each BUY trade should be the previous RED candle below the given level. Similarly, the SL (Stop loss) for each SELL trade should be the previous GREEN candle above the given level.
Note: This idea and these levels are only for learning and educational purpose.
Your likes and boosts gives us motivation for continued learning and support.
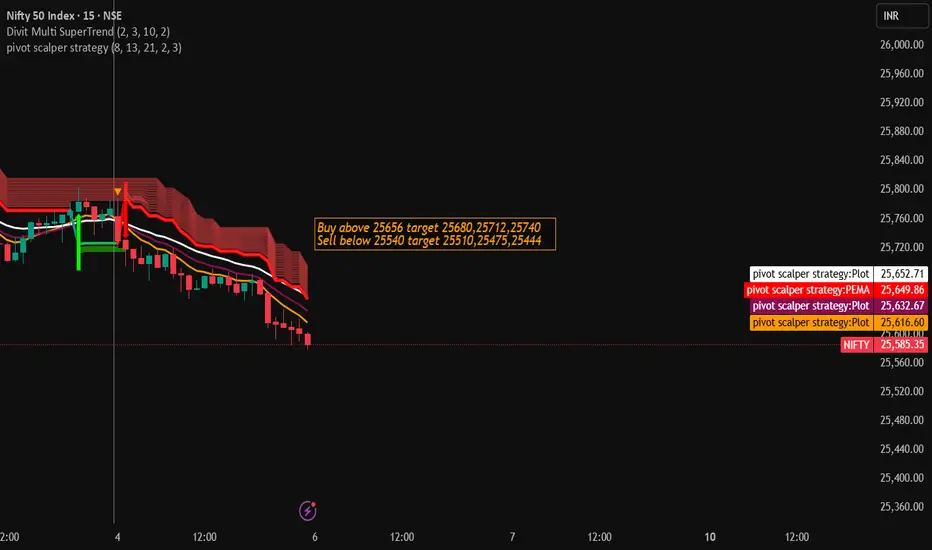
Nifty Trading Strategy for 06th November 2025📊 NIFTY Intraday Trading Plan (15-Min Chart)
🕒 Strategy:
Wait for the 15-minute candle to close before taking any trade.
🟩 BUY Setup
✅ Condition:
Buy only if the 15-min candle closes above ₹25,656
🎯 Targets:
1️⃣ ₹25,680
2️⃣ ₹25,712
3️⃣ ₹25,740
🛑 Stop Loss (SL): Below the 15-min candle low
🟥 SELL Setup
✅ Condition:
Sell only if the 15-min candle closes below ₹25,540
🎯 Targets:
1️⃣ ₹25,510
2️⃣ ₹25,475
3️⃣ ₹25,444
🛑 Stop Loss (SL): Above the 15-min candle high
📌 Guidelines for Beginners:
⚡ Always wait for candle close confirmation (don’t jump in early).
💰 Risk small — never risk more than 1–2% of your capital per trade.
📉 Avoid trading during major news events or gap openings.
📊 Use basic indicators like Volume and VWAP for confirmation.
🧘 Stay calm and follow your plan — discipline is key!
⚠️ Disclaimer:
I am not a SEBI registered analyst.
This setup is for educational and informational purposes only — trade at your own risk.
💼 Do your own analysis before taking any trade.
Strategy on netweb technology Buy price : 3450
Stop loss : 3200
Tgt : 3800
Nifty strategy :
Sell nifty : 25700
Stop loss: 25900
Target : 25400
Disclaimer : I am not a Sebi research analyst please seek advice from your financial advisor before enter into trade above script
Real Knowledge of MarketCore Foundational Knowledge
Derivatives Basics: Options are derivative contracts, meaning their value is derived from an underlying asset (stocks, indices, commodities, etc.).
Key Terminology: A trader must be fluent in terms like call options (right to buy), put options (right to sell), strike price, premium, expiration date, intrinsic value, and time value.
Rights vs. Obligations: Understanding that option buyers have the right, but not the obligation, to exercise, while option sellers (writers) have the obligation if exercised, is fundamental to risk assessment.
Leverage: Options offer significant leverage, meaning a small amount of capital can control a large position in the underlying asset, which amplifies both potential profits and losses.

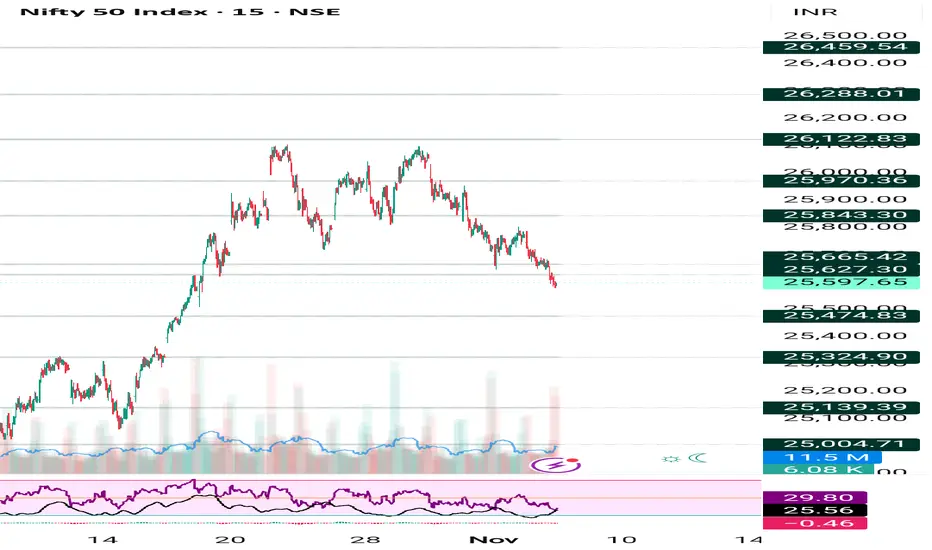
Nifty 50 Nov–Dec 2025 OutlookNifty remains in a structural uptrend (above 200-DMA, healthy weekly setup), currently undergoing a short-term consolidation phase after a strong October rally.
The November expiry may witness mild mean reversion toward 25,200–25,400, but the broader setup favours a rebound toward 26,300–26,500 into December.
Technical Structure
Metric Value Interpretation
Current Close 25,597 –
50-DMA 25,179 Short-term support, flattening trend
200-DMA 24,353 Long-term trend bullish
RSI (14) 27.9 Oversold – near exhaustion zone
Weekly RSI 58.7 Cooling, still in bullish territory
Daily MACD Mild negative Reflects consolidation, not reversal
Nifty has slipped below its 20-DMA but continues to hold above the 50-DMA.
Weekly candles show a pause after an extended move — classic base-building before continuation.
Option Market Positioning (as of Nov 2025)
Side Strike Open Interest Takeaway
Top Call OI 26,650 9.9 lakh Resistance zone
Top Put OI 24,600 10 lakh Strong support base
Suggests short-term expiry drift lower but no breakdown risk.
Macro Context
Indicator Current Trend Market Implication
FPI Flows +₹11,493 Cr recent Improving Gradual re-entry of foreign money
DXY ~104.7 Soft bias EM positive
US10Y ~4.1% Stable Valuation comfort restored
Global macros have shifted from headwind to neutral/supportive — favouring a December recovery phase.
Probable Pathway
Phase 1 (Nov expiry):
- Drift toward 25,200–25,400 as OI rolls and short-term longs unwind.
- RSI to stabilize near 40–45.
Phase 2 (Post-expiry rebound):
- FPI inflows + RSI recovery above 50 triggers renewed momentum.
- 50-DMA (~25,200) acts as springboard.
Phase 3 (Dec upmove):
- Target zone 26,300–26,500.
- Key confirmation: daily close >25,800 with rising RSI & MACD turn.

Nifty Analysis - 6/11/25Market is in downtrend so look for PE trades. Sell on rise t be followed. We can look for CE only if a 15 minutes candles closes above 20 EMA, till then do not look for CE trades at all. There will be premium eating in the first 15 minutes as it was holiday today. 26700 is strong resistance and 25500 is strong support as per option chain.

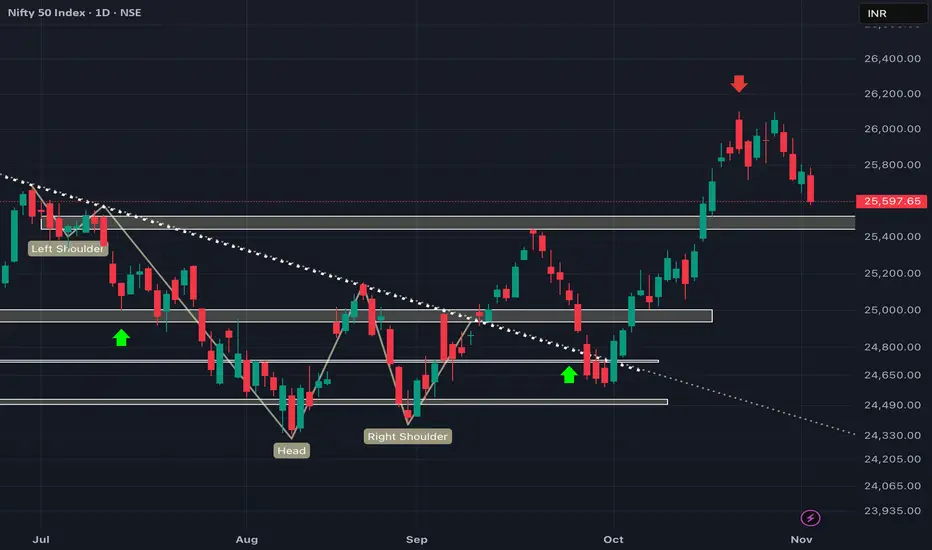
NIFTY getting closer to our target! What's next!?As we can see NIFTY fell more like unidirectionally exactly as analysed in our previous analysis and about to reach 25500 which had been our initial target. Now that it is about to reach our important demand zone, we may see NIFTY taking SUPPORT as this zone can act as a retest to the breakout and cam show substantial upmove from there if signs of REVERSAL is seen around the demand zone but if fails to take support and closes its candle below 25500 then that zone will act as a RESISTANCE which would lead to more fall so keeping all these in consideration, plan your trades accordingly and keep watching everyone.
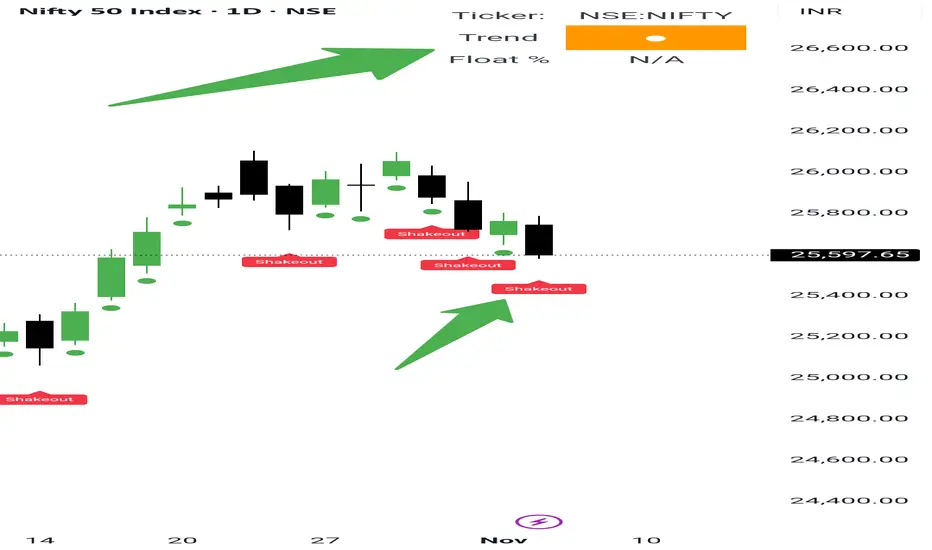
Bulls accumulating with Shakeouts in index! Stay sharp. NSE:NIFTY has now closed below our support level of 25666, exactly as we discussed over the last few days.
You guys were already warned back on October 24 that Nifty’s health was turning “Orange”, so if still your portfolio is showing losses, it’s time to take learning seriously. First you learn, then you earn.
Also remember, when the overall market environment turns weak, your intraday and momentum stocks won’t work the same way they usually do. It’s okay. It’s normal.
We might need to wait through this week. From next week, conditions should start improving as the monthly breadth continues to get stronger.
Yesterday, #Nifty gave a big red candle, but it was just a shakeout within the ongoing uptrend. The overall market health is still orange and hasn’t turned red yet.
Now, Nifty’s Pivot has slipped slightly lower to 25654. This will act as intraday resistance for tomorrow. Once this level breaks, we could see sharp short covering.
Remember — this is just a shakeout within a normal pullback, and bulls are still accumulating quietly.
The next key support is at 25550. If that breaks too, 25350 would be the next target. However, that’s less likely since the broader trend remains bullish. But still, market is market — so stay alert.
Short-term traders should keep an eye on #Defence, #Finance, and #Auto_Ancillaries sectors.
Long-term investors should study #Infra, #Metals, #NewAgeTech, and #ShipBuilding sectors — including their proxy plays.
This is a good time to accumulate quality stocks with a TechnoFunda approach. Focus on companies showing strong sales growth, rising earnings, improving EPS, and high accumulation on technical charts.
📊Levels at a glance:
Pivot: 25654 (Intraday resistance)
Support: 25550 / 25350
Market Health: Orange (cautious accumulation phase)
Bias: Bullish long term, short-term shakeout ongoing
Sectors for short term: Defence, Finance, Auto Ancillaries
Sectors for long term: Infra, Metals, New Age Tech, Ship Building
Strategy: Accumulate quality stocks with strong TechnoFunda setup
That’s all for the day. Take care and have a profitable tomorrow.
Nifty key levels for 6.11.2025Marked zones are the places where nifty may take reversals or breakouts. Take entry in 5 or 3 minute timeframe.
Positional Trading and Swing Trading in the Indian Market1. What Is Positional Trading?
Positional trading is a strategy where traders hold their positions for several weeks to months, depending on the trend and potential price movement. It’s based on the belief that once a trend starts, it will continue for a considerable period. Traders focus on identifying such long-lasting trends and patiently ride them out, ignoring short-term volatility.
Unlike intraday trading, positional trading doesn’t require constant monitoring. Traders rely heavily on fundamental analysis and technical indicators to determine the stock’s overall direction. The idea is simple — find fundamentally strong companies or technical setups that show signs of an uptrend or downtrend and hold them until the trend matures.
For example, if a trader notices a breakout on a weekly chart with strong volume and expects the stock to rise due to positive earnings or sectoral growth, they may hold the position for weeks or even months.
2. What Is Swing Trading?
Swing trading, on the other hand, is a short- to medium-term trading strategy aimed at capturing price “swings” that occur within a trend. These swings typically last from a few days to a few weeks. Swing traders don’t aim to catch the entire trend; instead, they seek to profit from smaller, predictable moves within the broader market direction.
In the Indian context, swing traders often focus on stocks with high liquidity, such as those in the Nifty 50 or Bank Nifty, since these provide enough volatility and volume to generate consistent opportunities.
Swing traders rely heavily on technical analysis, using indicators such as moving averages, RSI (Relative Strength Index), MACD, Fibonacci retracements, and candlestick patterns to time their entries and exits.
3. Tools and Analysis Methods
Both strategies depend on technical analysis, but positional traders often combine it with fundamental research, while swing traders primarily depend on price action.
For Positional Traders:
Fundamental Analysis: Checking company earnings, management quality, sectoral growth, and macroeconomic indicators.
Technical Tools: Weekly charts, long-term moving averages (50-day, 200-day), support and resistance zones, and trendlines.
Volume Analysis: Confirmation of trend strength through increased trading volume.
Sentiment Indicators: Market breadth or institutional buying trends.
For Swing Traders:
Technical Indicators: RSI, MACD, Bollinger Bands, Fibonacci retracements, and pivot points.
Candlestick Patterns: Reversals (Hammer, Shooting Star, Engulfing), breakouts, or continuation patterns.
Momentum Indicators: Used to identify short bursts of price action.
News Flow & Events: Earnings announcements, RBI policy, or global cues that can move prices quickly.
4. Risk and Reward Dynamics
Risk management is central to both trading styles, but the approach differs:
Positional Trading Risks:
Since positions are held for weeks or months, traders face overnight risk and gap-up/gap-down openings due to news, results, or global market movements. However, since the focus is on the bigger trend, small fluctuations are ignored. Positional traders often use stop losses based on weekly chart structures and risk smaller capital per trade.
Swing Trading Risks:
Swing traders face short-term volatility and need to manage tight stop losses. Since they target quick gains, even a minor reversal can affect profits. The advantage is limited exposure time — positions are not held too long, reducing prolonged uncertainty.
Reward-wise, positional trades often yield higher returns per trade but take time to materialize, while swing trades produce frequent smaller gains that can compound effectively.
5. Market Conditions for Each Strategy
Market conditions greatly influence which strategy works best:
Positional Trading Works Best In:
Trending markets — either bullish or bearish. Stocks or indices showing clear breakouts or breakdowns after consolidation phases.
Example: During a sectoral bull run (like IT in 2020–21 or PSU banks in 2023), positional traders could hold positions for months and ride the trend.
Swing Trading Works Best In:
Range-bound or moderately volatile markets. When the Nifty oscillates between support and resistance, swing traders capitalize on those moves.
Example: When Nifty trades between 22,000–23,000 for several weeks, swing traders buy near the support zone and sell near resistance.
6. Capital and Margin Requirements
In India, both strategies can be implemented using cash or futures and options (F&O).
Positional Trading: Typically requires more capital because trades are held longer, and margin funding costs can add up. Investors in delivery mode (cash segment) need full capital but have no daily margin calls.
Swing Trading: Requires less capital since traders can use leverage or trade in F&O. However, due to short holding periods, frequent transaction costs and taxes can slightly reduce profits.
7. Emotional and Psychological Factors
Positional Trading Psychology:
Demands patience and discipline. Traders must tolerate price pullbacks and avoid reacting to daily market noise. Emotional stability and conviction in analysis are crucial.
Swing Trading Psychology:
Requires quick decision-making and emotional agility. Traders must be comfortable with fast-paced setups, quick exits, and booking partial profits. Impulsiveness or hesitation can lead to missed opportunities.
8. Examples in the Indian Context
Let’s understand through two practical examples:
Positional Trade Example:
Suppose Tata Motors shows a breakout above ₹950 on a weekly chart after months of consolidation with rising volumes and improving earnings outlook. A positional trader buys and holds, targeting ₹1,200–₹1,300 over 2–3 months while keeping a stop loss at ₹880.
Swing Trade Example:
HDFC Bank rebounds from support near ₹1,450 with bullish candles and RSI divergence. A swing trader buys and holds for 4–6 trading days, aiming for a move to ₹1,520–₹1,550, keeping a tight stop loss at ₹1,435.
9. Which Strategy Is Better for Indian Traders?
There is no universal answer — the better strategy depends on one’s capital base, personality, and time commitment.
Choose Positional Trading if you:
Have a full-time job and cannot monitor markets daily.
Prefer fundamental strength and long-term trend riding.
Can tolerate drawdowns and be patient.
Choose Swing Trading if you:
Can actively watch markets for setups.
Enjoy technical analysis and momentum trading.
Prefer quicker profits and short-term engagement.
Many successful Indian traders blend both — they maintain positional trades in trending sectors and take swing trades for short-term opportunities.
10. Conclusion
Positional and swing trading are two of the most practical and flexible trading styles in the Indian market. While positional trading is about patience, conviction, and trend-following, swing trading emphasizes timing, agility, and momentum capture. Both demand disciplined risk management, a solid understanding of technicals, and awareness of market sentiment.
In essence, positional trading builds wealth gradually, while swing trading builds income through active participation. A balanced trader who understands when to switch between the two — depending on market conditions — can truly harness the best of both worlds in India’s dynamic stock market.

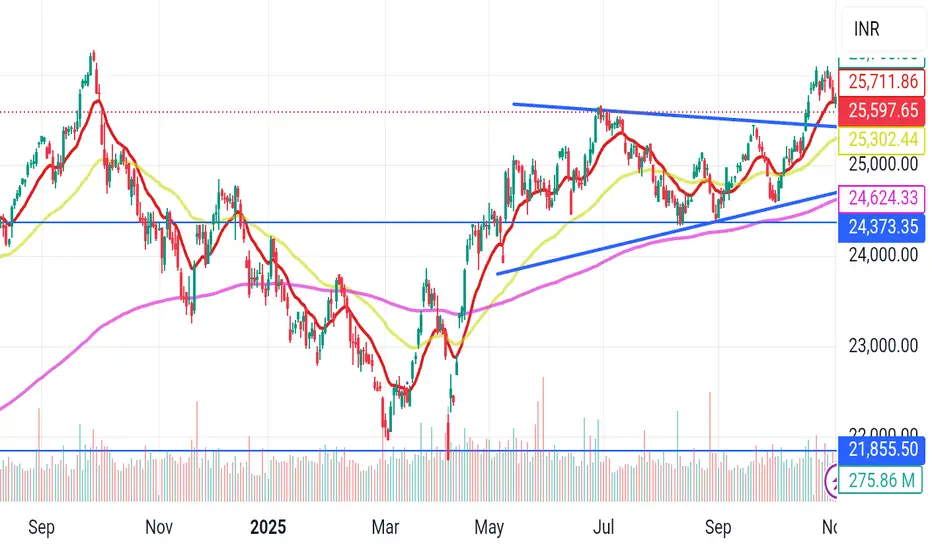
NIFTY : Bullish channel long term but bearish in short termNIFTY BULLISH Channel
trade can be taken for short-term bearish, but long term is still bullish.
T1 : 25430
T2 : 25130
- *Trend Channel:*
The Nifty is trading within a clearly defined upward sloping channel. This channel is marked by parallel upper and lower trendlines, encapsulating the price movement. The price has consistently respected these boundary lines from July through November 2025, bouncing off both support and resistance.
- *Current Position:*
At the latest observation, the Nifty is near the upper part of this channel. After touching the top end, a short-term reversal or pullback has occurred, consistent with typical channel dynamics.
- *Volume Analysis:*
Volume bars at the bottom show a mix of accumulation and distribution phases, with some spikes on days of strong moves. However, there is no extraordinary volume suggesting panic or euphoria.
- *Labeled Support Levels (T1, T2):*
Two horizontal lines are marked below the current price action, labeled T1 and T2. These likely represent key support or target zones where price could find support if the current correction continues. Historically, price has reacted at these levels during past consolidations within the channel.


Nifty bounce possible from current price avoid sell trades cmp
Nifty avoid any fresh sell trade at current price bounce possible
How My Harmonic pattern projection Indicator work is explained below :
Recent High or Low :
D-0% is our recent low or high
Profit booking zone ( Early / Risky entry) : D 13.2% -D 16.1 % is
range if break them profit booking start on uptrend or downtrend but only profit booking, trend not changed
SL reversal zone (Safe entry ) : SL 23.1% and SL 25.5% is reversal zone if break then trend reverse and we can take reverse trade
Target : T1, T2, T3, T4 and .
Are our Target zone
Any Upside or downside level will activate only if break 1st level then 2nd will be active if break 2nd then 3rd will be active.
Total we have 7 important level which are support and resistance area
Until , 16% not break uptrend will continue if break then profit booking will start.
If break 25% then fresh downtrend will start then T1, T2,T3 will activate
1,3,5,10,15,20 minutes are short term levels.
30 minutes 60 minutes , 2 hours,3 hours, ... 1 day and 1 week chart positional and long term levels
Nifty Intraday Analysis for 04th November 2025NSE:NIFTY
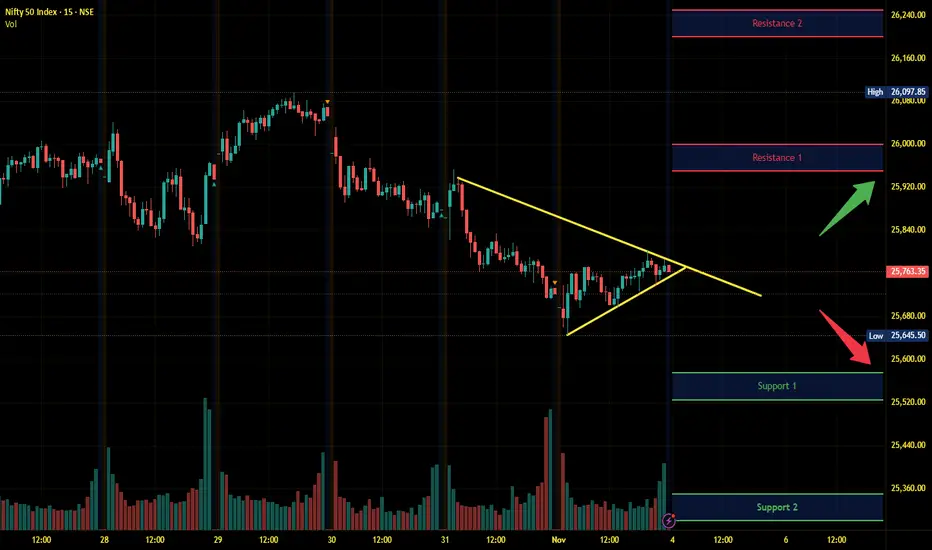
Index has resistance near 25950 – 26000 range and if index crosses and sustains above this level then may reach near 26200 – 26250 range.
Nifty has immediate support near 25575 – 25525 range and if this support is broken then index may tank near 25350 – 25300 range.
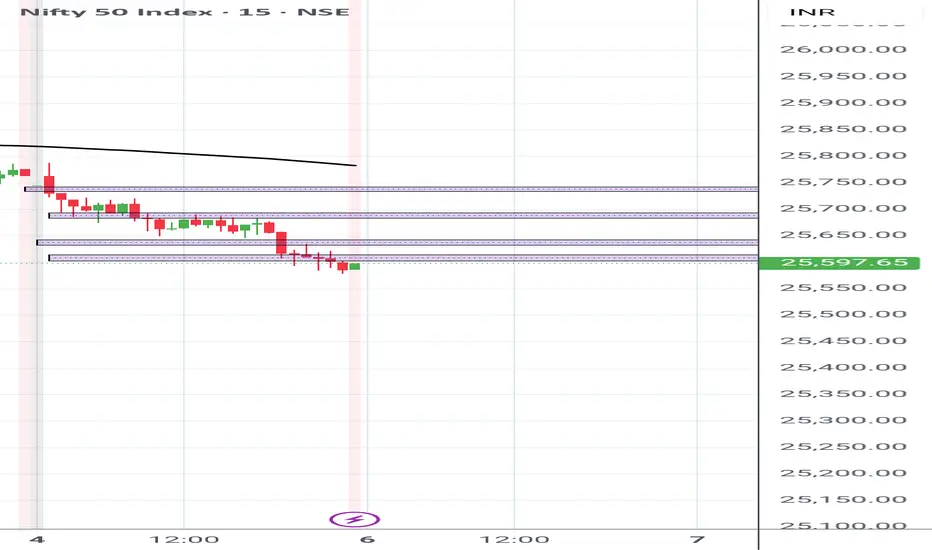
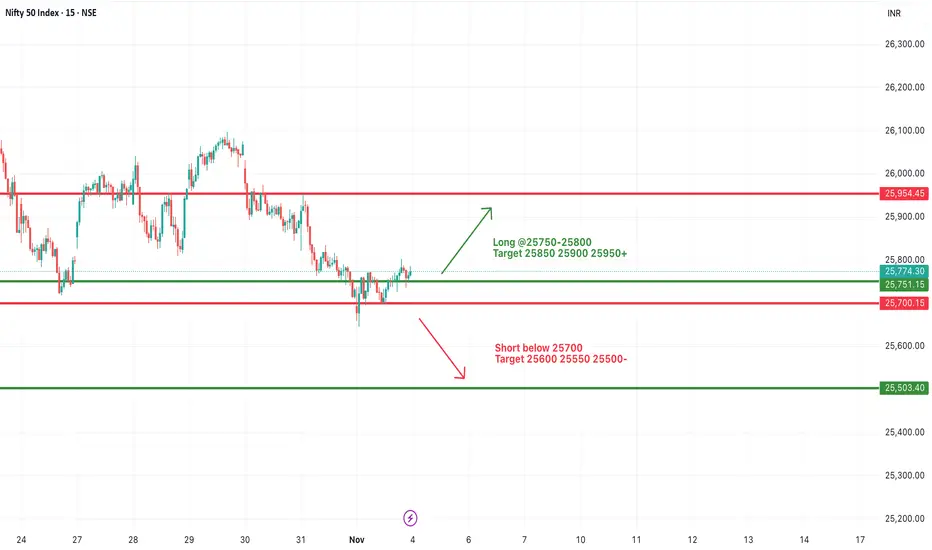
Nifty - Expiry day analysis Nov 4Price moved within the range of 25650 to 25780 today, and these levels are acting as strong support/resistance. Nearby support is at 25500, and resistance is at 25900. And still the price is inside the falling wedge.
Buy above 25820 with the stop loss of 25780 for the targets 25860, 25900, 25940 and 25980.
Sell below 25720 with the stop loss of 25760 for the targets 25680, 25640, 25600 and 25540.
The expected expiry day range is 25600 to 25900.
Always do your analysis before taking any trade.

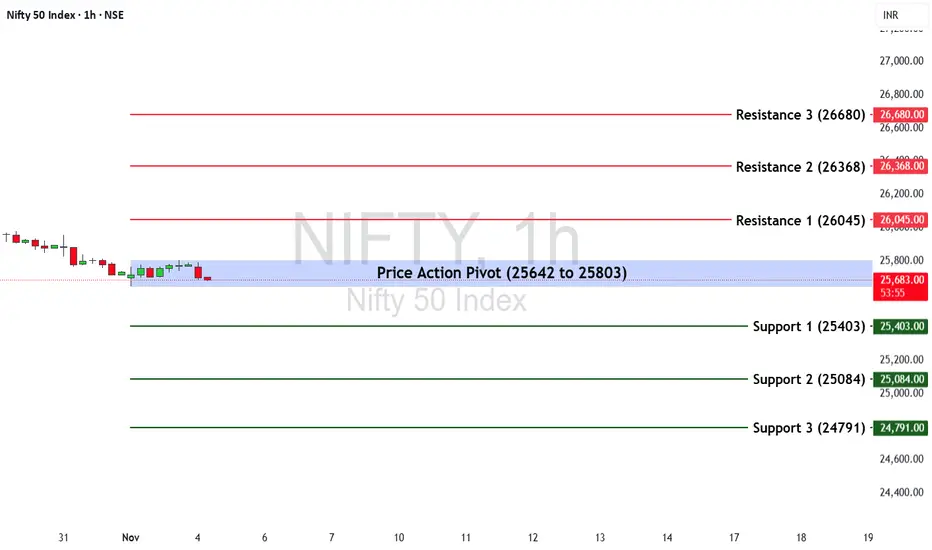
Nifty 50 Weekly Outlook ( 3rd Nov – 7th Nov 2025)The Nifty 50 Index last week ended at 25,722.10, posting a -0.28% decline. The index showed mild profit-booking near resistance after a sharp rally in recent weeks, suggesting a potential consolidation phase before the next directional move.
🔹 Key Levels for the Upcoming Week
📌 Price Action Pivot Zone:
25,642 to 25,803 – This blue-shaded zone represents the key decision area. Sustaining above this range may attract renewed buying interest, while a breakdown below could trigger short-term profit booking.
🔻 Support Levels:
S1: 25,403
S2: 25,084
S3: 24,791
🔺 Resistance Levels:
R1: 26,045
R2: 26,368
R3: 26,680
📈 Market Outlook
✅ Bullish Scenario:
If Nifty holds above 25,803, a breakout move could lift the index toward R1 (26,045). Sustained momentum above this level may extend gains toward R2 (26,368) and R3 (26,680) in the coming sessions.
❌ Bearish Scenario:
If the index slips below 25,642, short-term weakness could drag it toward S1 (25,403), followed by S2 (25,084) and S3 (24,791).
Disclaimer: lnkd.in
NIFTY KEY LEVELS FOR 04.11.2025NIFTY KEY LEVELS FOR 04.11.2025
Timeframe: 3 Minutes
If the candle stays above the pivot point, it is considered a bullish bias; if it remains below, it indicates a bearish bias. Price may reverse near Resistance 1 or Support 1. If it moves further, the next potential reversal zone is near Resistance 2 or Support 2. If these levels are also broken, we can expect the trend.
When a support or resistance level is broken, it often reverses its role; a broken resistance becomes the new support, and a broken support becomes the new resistance.
If the range(R2-S2) is narrow, the market may become volatile or trend strongly. If the range is wide, the market is more likely to remain sideways
please like and share my idea if you find it helpful
📢 Disclaimer
I am not a SEBI-registered financial adviser.
The information, views, and ideas shared here are purely for educational and informational purposes only. They are not intended as investment advice or a recommendation to buy, sell, or hold any financial instruments.
Please consult with your SEBI-registered financial advisor before making any trading or investment decisions.
Trading and investing in the stock market involves risk, and you should do your own research and analysis. You are solely responsible for any decisions made based on this research.

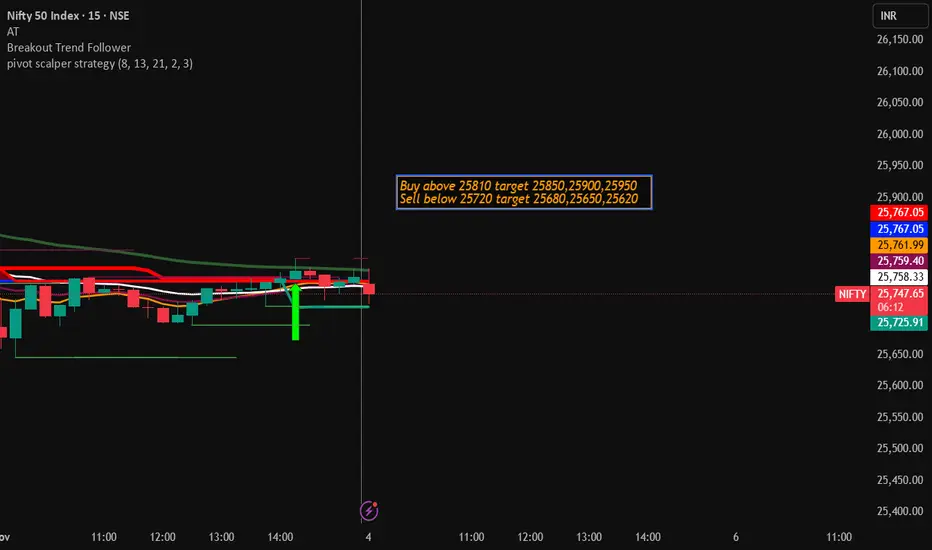
Nifty Trading Strategy for 04th November 2025📊 NIFTY INTRADAY PLAN (For Educational Purpose Only)
📈 BUY SETUP
✅ Buy Above: High of 15-min candle, after closing above 25,810
🎯 Targets:
🎯 1st Target – 25,850
🎯 2nd Target – 25,900
🎯 3rd Target – 25,950
🔒 Stop Loss: Below 25,780 (or the candle low)
📉 SELL SETUP
❌ Sell Below: Low of 15-min candle, after closing below 25,720
🎯 Targets:
🎯 1st Target – 25,680
🎯 2nd Target – 25,650
🎯 3rd Target – 25,620
🔒 Stop Loss: Above 25,750 (or the candle high)
🧭 How to Trade
Wait for the 15-minute candle to close — don’t enter early.
If the price closes above 25,810, take a buy trade above the candle’s high.
If the price closes below 25,720, take a sell trade below the candle’s low.
Always keep a stop loss to protect your capital.
Book profits step by step at the target levels mentioned.
Avoid trading if the market is too volatile or moving sideways.
⚠️ Disclaimer:
I am not SEBI registered.
This analysis is for educational and informational purposes only — not financial advice.
Please do your own research or consult a certified advisor before taking any trades.
#NIFTY Intraday Support and Resistance Levels - 04/11/2025Nifty is expected to open flat near the 25,750–25,780 zone, indicating a neutral start as the market looks for fresh cues after a consolidation phase. The index is currently holding near key support, suggesting that both buyers and sellers are waiting for a breakout from this range to take control.
If Nifty sustains above 25,800, it may trigger a short-covering rally toward 25,850, 25,900, and 25,950+ levels. A move beyond 25,950 could further strengthen momentum toward 26,000–26,050.
On the downside, immediate support lies near 25,700–25,650. A breakdown below 25,700 could lead to weakness toward 25,600, 25,550, and 25,500, where the next major support zone lies.
Overall, with a flat opening, Nifty is likely to remain range-bound between 25,700–25,900 in the early session. Traders should wait for a clear breakout or breakdown before initiating fresh positions and use strict stop losses in this narrow consolidation phase.
Nifty Expiry Analysis - 4/11/25 Market is in down trend look for PE on every rise. CE can taken above 25850. Premiums are around 150 for the ATM and ITM strike price so we can have limited movement on either side, book profits fast and do not sit in any trade for more than 15 minutes.

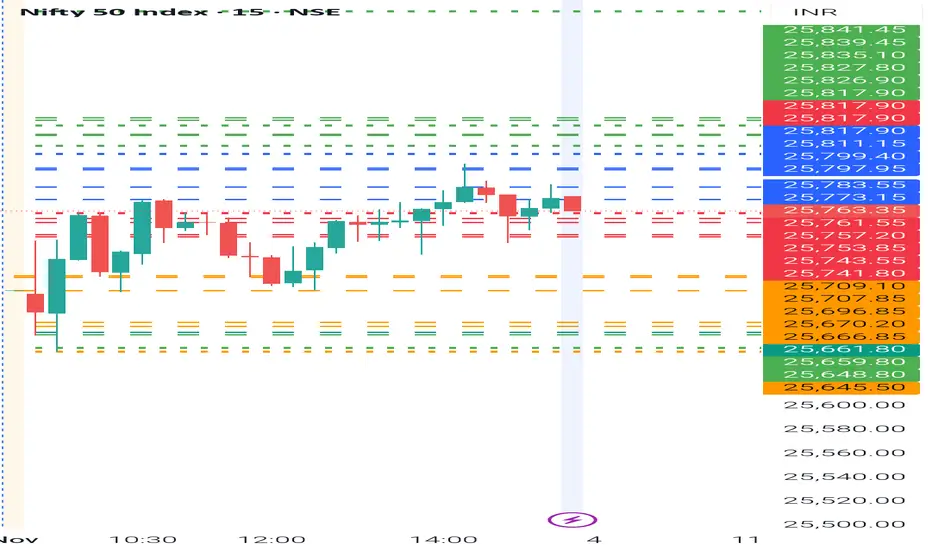
NIFTY- Intraday Levels - 4th November 2025
If NIFTY sustain above 25773/83 above this bullish then around 25797/99 then 25811/17 above this more bullish 25826/27/35/41 then above this wait
If NIFTY sustain below 25761/53 below this bearish then around 25743/41 then 25709/ 26696 then 25670/66/61/59/48/45 below this more bearish then below this wait
My view :-
"My viewpoint, offered purely for analytical consideration, is that the market will exhibit volatility with movement in both directions due to weekly expiry and November 5th is a trading holiday . And November 6th seems to be sell on rise so .. not much bullish movement will be expected.. some spike may come may be for position making ..
The trading thesis is: Nifty (bullish tactical approach: buy on dip ). This analysis is highly speculative and is not guaranteed to be accurate; therefore, the implementation of stringent risk controls is non-negotiable for mitigating trade risk."
Consider some buffer points in above levels.
Please do your due diligence before trading or investment.
**Disclaimer -
I am not a SEBI registered analyst or advisor. I does not represent or endorse the accuracy or reliability of any information, conversation, or content. Stock trading is inherently risky and the users agree to assume complete and full responsibility for the outcomes of all trading decisions that they make, including but not limited to loss of capital. None of these communications should be construed as an offer to buy or sell securities, nor advice to do so. The users understands and acknowledges that there is a very high risk involved in trading securities. By using this information, the user agrees that use of this information is entirely at their own risk.
Thank you.
NIFTY Levels for Today
Here are the NIFTY's Levels for intraday (in the image below) today. Based on market movement, these levels can act as support, resistance or both.
Please consider these levels only if there is movement in index and 15m candle sustains at the given levels. The SL (Stop loss) for each BUY trade should be the previous RED candle below the given level. Similarly, the SL (Stop loss) for each SELL trade should be the previous GREEN candle above the given level.
Note: This idea and these levels are only for learning and educational purpose.
Your likes and boosts gives us motivation for continued learning and support.
