Nifty Structure Analysis & Trade Plan: 4th NovemberDetailed Market Structure Breakdown
4-Hour Chart (Macro Trend)
Structure: The Nifty is currently in a Correction/Consolidation Phase within its broader uptrend. The price broke down from the aggressive ascending channel last week and is now attempting to stabilize. The last 4H candle is a Doji-like/small bullish candle, showing indecision but managing to hold the immediate support from the previous day's close.
Key Levels:
Major Supply (Resistance): 25,950 - 26,100. This area (the breakdown high and the "double-top" zone) is the critical overhead hurdle. Sustained trade above 25,950 is essential to revive bullish momentum.
Major Demand (Support): 25,500 - 25,600. This is the most critical support zone, aligning with the 20-day EMA (25,593) and major Fibonacci retracement levels. A decisive close below 25,500 would accelerate selling.
Outlook: The short-term bias is Bearish-to-Range-Bound. A move toward 25,850 - 25,900 is likely to face selling pressure ("sell-on-rise").
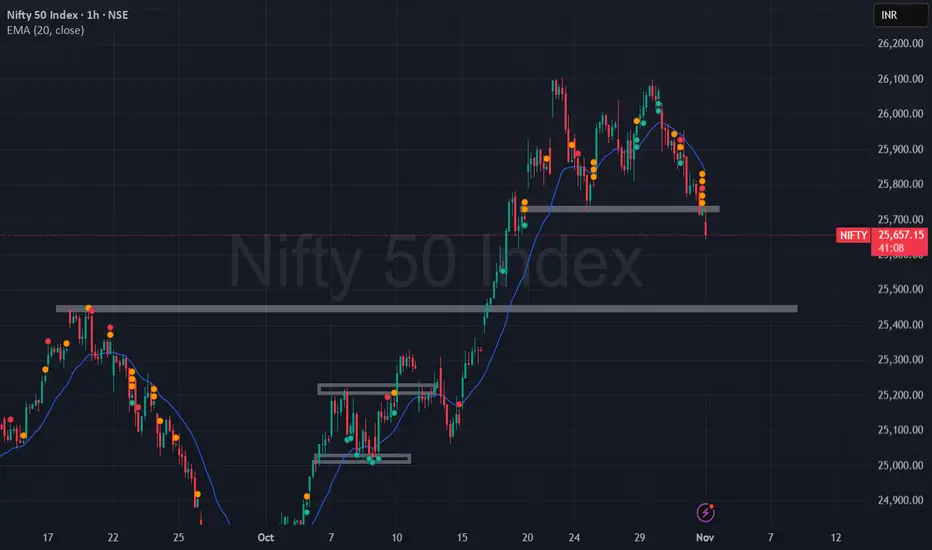
1-Hour Chart (Intermediate View)
Structure: The 1H chart shows the price failed to regain its momentum on Monday, remaining confined within the descending channel formed during the correction. The market closed right at the midpoint of this corrective channel.
Key Levels:
Immediate Resistance: 25,850 - 25,900 (Upper boundary of the descending channel).
Immediate Support: 25,700 (Lower boundary of the intraday range).
15-Minute Chart (Intraday View)
Structure: The 15M chart confirms the intraday range-bound action, with the price oscillating between 25,700 and 25,800 for most of the session. The index is trading below the 9-period EMA in the short term, maintaining a cautious stance.
Key Levels:
Intraday Supply: 25,800.
Intraday Demand: 25,700.
Outlook: Neutral-to-Cautious. The primary focus is on a breakout from the 25,700 - 25,800 range.
📈 Structure Analysis & Trade Plan: 4th November
Market Outlook: Nifty is consolidating after snapping a two-day losing streak. The market is expected to remain range-bound with a bearish undertone. The "Sell on Rise" strategy near the upper resistance is favored.
Bearish Scenario (Primary Plan: Sell on Rise/Breakdown)
Justification: The weekly chart shows a "Shooting Star" pattern, and the 4H chart shows a potential "Double-Top" formation near 26,100. The structure favors a move to fill the liquidity gap below.
Entry 1 (Sell on Rise): Short entry on a retest and rejection of the 25,850 - 25,900 level (upper channel resistance).
Entry 2 (Breakdown): Short entry on a decisive break and 15-minute close below 25,700.
Stop Loss (SL): Place a stop loss above 25,960 (above the recent swing high/upper channel).
Targets:
T1: 25,600 (Major support/20-DEMA).
T2: 25,500 (Key macro support).
Bullish Scenario (Counter-Trend/Reversal)
Justification: The broader trend remains positive as long as 25,500 holds. A breakout above the short-term descending channel is needed.
Trigger: A sustained move and close above 26,000.
Entry: Long entry on a confirmed 15-minute close above 26,000.
Stop Loss (SL): Below 25,850.
Targets:
T1: 26,100 (Recent high).
T2: 26,300 (ATH zone/Extension).
Key Levels for Observation:
Immediate Decision Point: 25,700 - 25,850 zone.
Bearish Confirmation: Sustained trade below 25,700.
Bullish Confirmation: A move back above 25,950.
Line in the Sand: 25,500. Below this, the risk of a deep correction increases significantly.
Trade ideas
Nifty Intraday Analysis for 03rd November 2025NSE:NIFTY
Index has resistance near 25950 – 26000 range and if index crosses and sustains above this level then may reach near 26200 – 26250 range.
Nifty has immediate support near 25550 – 25500 range and if this support is broken then index may tank near 25350 – 25300 range.

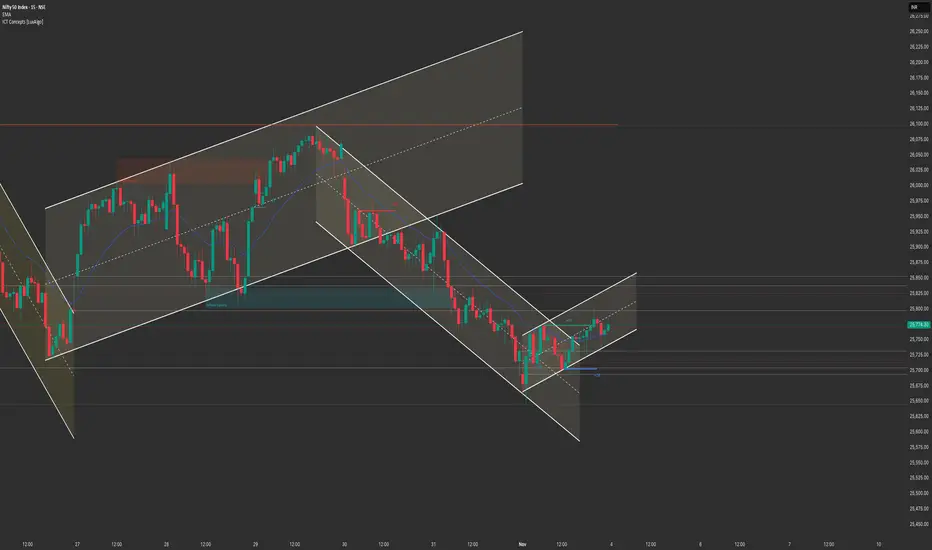
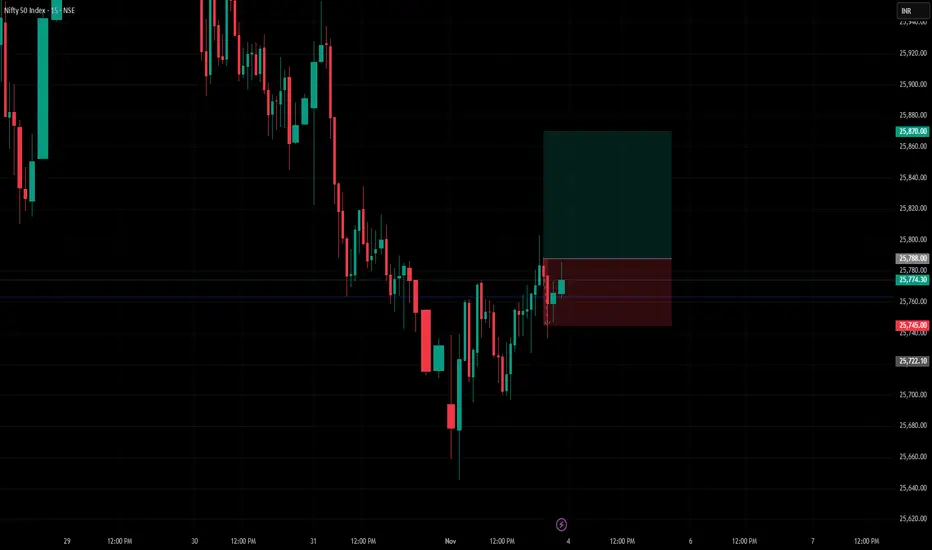
Nifty Intraday Long, Stop Loss and Target Levels markedExpecting bulls to be aggressive if nifty crosses strong above 25788 and the target will be 25870.
In case if nifty falls below 25745, then the bears will take the control.
Accordingly marked the chart with long, target and stop loss points
Nifty 1 Hour Time Frame ✅ Key Supports
Around 25,600-25,700: Short-term pullbacks may find support in this zone.
Deeper support near 25,300: If the above fails, this next level may become relevant.
🚧 Key Resistances
Roughly 26,000-26,250: This zone appears to be a meaningful resistance band.
If price clears above that, next resistance could emerge near 26,300-26,500 (though less clearly defined in current data).
nifty look good for down sideIN morning session nifty look weaker good time to short for small target
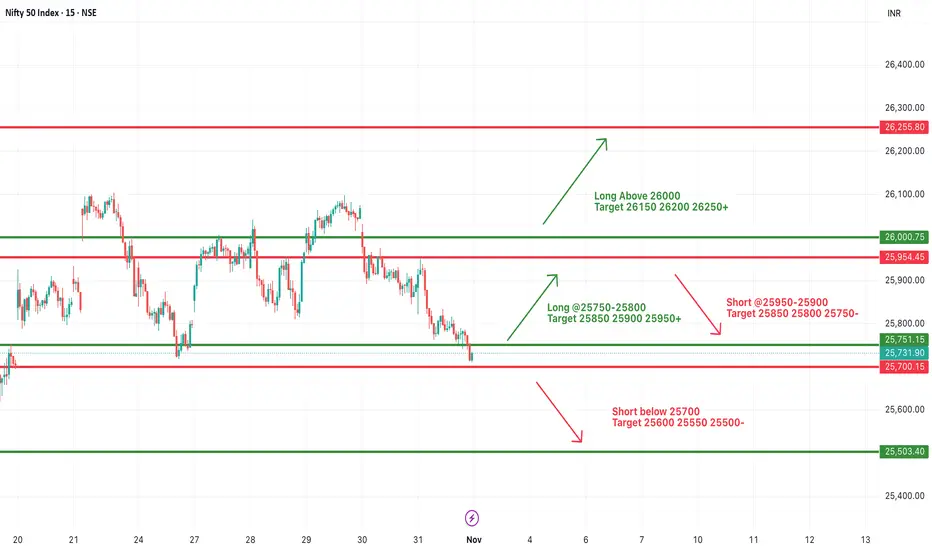
#NIFTY Intraday Support and Resistance Levels - 03/11/2025Nifty is expected to open slightly gap up near the 25,750–25,800 zone, showing a mild recovery attempt after recent selling pressure. However, the index continues to trade near its lower support band, indicating that buyers need to defend this zone to avoid a deeper correction.
If Nifty sustains above 25,800, a short-covering move toward 25,850, 25,900, and 25,950+ levels can be expected. Further strength above 26,000 will open the path toward 26,150–26,250, signaling a reversal from the current downtrend.
On the downside, immediate support lies around 25,700–25,650. A breakdown below 25,700 may lead to extended weakness toward 25,600, 25,550, and 25,500 levels, where fresh buying interest could emerge.
Overall, with a slightly gap up opening, Nifty may witness initial range-bound movement between 25,700–25,900. Traders should stay cautious and focus on price action near the 25,700 and 25,900 zones, as a breakout on either side will likely decide the intraday trend.
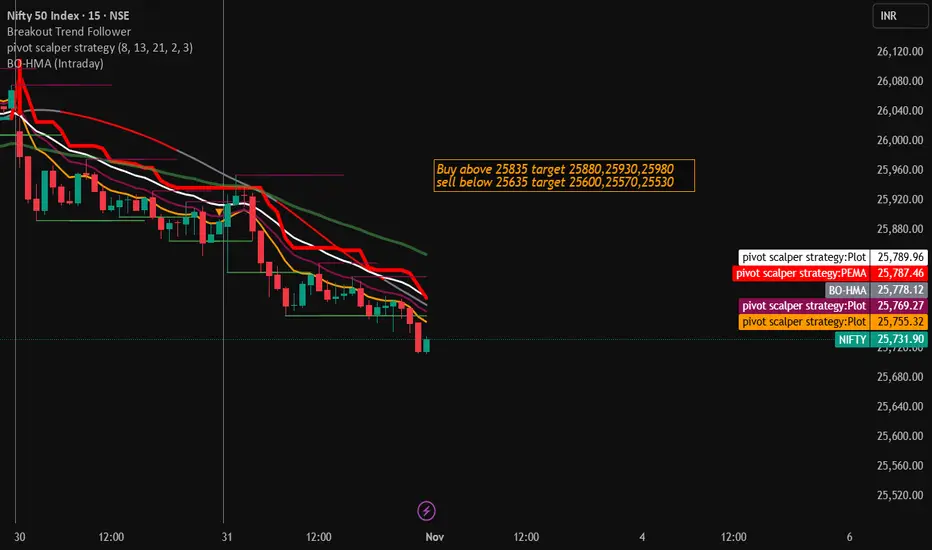
Nifty Trading Strategy for 03rd November 2025📈 NIFTY INTRADAY TRADE SETUP (15-Min Chart)
🕒 Timeframe: 15-Min Candle Strategy
📅 Today’s Plan: Watch for breakout confirmation after candle close
🟢 BUY SETUP (Bullish Scenario)
🔹 Trigger: Enter only if the 15-min candle closes above 25,835
🔹 Buy Above: 25,835 (after candle close)
🎯 Targets:
• T1: 25,880
• T2: 25,930
• T3: 25,980
🛑 Stop Loss: Below 25,780 (or as per risk tolerance)
💡 Note: Wait for a decisive close above 25,835 — not just a wick breakout.
🔴 SELL SETUP (Bearish Scenario)
🔹 Trigger: Enter only if the 15-min candle closes below 25,635
🔹 Sell Below: 25,635 (after candle close)
🎯 Targets:
• T1: 25,600
• T2: 25,570
• T3: 25,530
🛑 Stop Loss: Above 25,680 (or as per your risk management)
💡 Note: Confirm momentum before shorting — avoid false breakdowns.
⚖️ TRADE MANAGEMENT TIPS
📊 Follow strict risk–reward ratio (minimum 1:2).
⏱️ Avoid overtrading — wait for candle close confirmation.
💬 Always trail your stop loss once T1 is achieved.
⚠️ DISCLAIMER
🚫 I am not a SEBI-registered analyst.
📢 All levels shared are for educational purposes only.
💰 Please do your own analysis or consult your financial advisor before taking any trades.
Nifty 3/11/2025Sideways or bearish, global cues are strong, but the previous close and gift nifty movements show weakness. therefore, a mixed move is expected, with a possible gap-down opening followed by a downward move.

Nifty 50 Technical Analysis Nov 3-7, 2025Next Week Vibes: Nov 3-7, 2025
~~ 25,722 close, Nifty eyes a breakout above 26,400 for glory towards 28k—or a dip test at 25,300 support if breaks then bears roar. Metal & PSU Banks stealing the show; will bulls charge or profit-book?
Disclaimer
High Risk Investment
Trading or investing in assets like crypto, equity, or commodities carries high risk and may not suit all investors.
Analysis on this channel uses recent technical data and market sentiment from web sources for informational and educational purposes only, not financial advice. Trading involves high risks, and past performance does not guarantee future results. Always conduct your own research or consult a SEBI-registered advisor before investing or trading.
This channel, Render With Me, is not responsible for any financial loss arising directly or indirectly from using or relying on this information.

NIFTY : Trading levels and Plan for 03-Nov-2025🔹 NIFTY Trading Plan for 03-Nov-2025
(Based on psychological correction zones and technical confluences)
Chart Reference Levels:
🟩 Opening & Important Support: 25,644 – 25,682
🟧 Opening Resistance: 25,773
🟥 Last Intraday Resistance: 25,905
🩶 Last Intraday Support: 25,614
🩵 Extended Support Zone: 25,459
🟢 Scenario 1: Gap-Up Opening (100+ points above previous close)
If Nifty opens above 25,830 – 25,860, monitor how prices react near 25,905 (Last Intraday Resistance). A sustained move above this level with good momentum can trigger an upward extension towards 26,015.
However, if rejection appears near 25,905, expect a possible intraday correction back toward 25,773 (Opening Resistance), which could now act as support.
For option traders: Look for quick scalps on CE side only after confirmation (e.g., 15-min candle closes above 25,905). Avoid chasing if volatility spikes immediately after opening.
📘 Educational Note: Gap-ups often trap late buyers, so patience during the first 15–30 minutes can help identify genuine breakouts versus false moves.
🟠 Scenario 2: Flat Opening (±50 points from previous close around 25,730)
In this case, early trade will revolve around the Opening and Important Support zone (25,644–25,682). A bounce from this region could create a base for testing 25,773 and possibly 25,905 if momentum builds.
On the other hand, a clear break and sustained move below 25,644 may attract selling pressure, pushing prices toward 25,614 and later 25,459.
Intraday traders can focus on range-bound strategies initially, buying near support and selling near resistance, until a decisive breakout occurs.
📘 Educational Note: Flat openings provide balanced opportunities — observe where institutional participation appears before committing. Price confirmation > prediction.
🔴 Scenario 3: Gap-Down Opening (100+ points below previous close)
A gap-down below 25,650 immediately places Nifty near or inside the support pocket (25,644–25,682). Watch for signs of reversal (hammer-type candles or volume spikes).
If Nifty fails to hold above 25,614, bears could dominate, targeting 25,459 as the next logical intraday support.
However, if Nifty stabilizes and closes back above 25,682, it could turn into a short-covering day with recovery potential up to 25,773.
📘 Educational Note: Gap-downs usually trigger emotional trades. Stay calm — wait for structure confirmation instead of reacting impulsively to open volatility.
💡 Tips for Risk Management in Options Trading
Always define your risk per trade — never risk more than 1–2% of your total capital on a single position.
Use stop-loss based on hourly candle close rather than fixed points for better accuracy in volatile sessions.
Avoid averaging in loss-making trades; instead, re-enter only on confirmation of trend reversal.
Focus on delta-neutral spreads (like Bull Call / Bear Put) on volatile days to manage premium decay effectively.
Remember: preserving capital is more important than chasing every move. The market will always provide new opportunities.
📊 Summary & Conclusion:
Above 25,905 → Bulls regain control, eyeing 26,015 as the next target.
Between 25,682–25,773 → Neutral zone, ideal for short-term reversals.
Below 25,614 → Bears dominate, with possible slide towards 25,459.
In essence, the session for 03-Nov-2025 may open with uncertainty near key support zones, so disciplined observation and reaction-based trading will be the key to consistent results.
⚠️ Disclaimer:
I am not a SEBI-registered analyst . This analysis is shared purely for educational and informational purposes. Traders are advised to conduct their own research or consult a certified financial advisor before taking any investment or trading decisions.

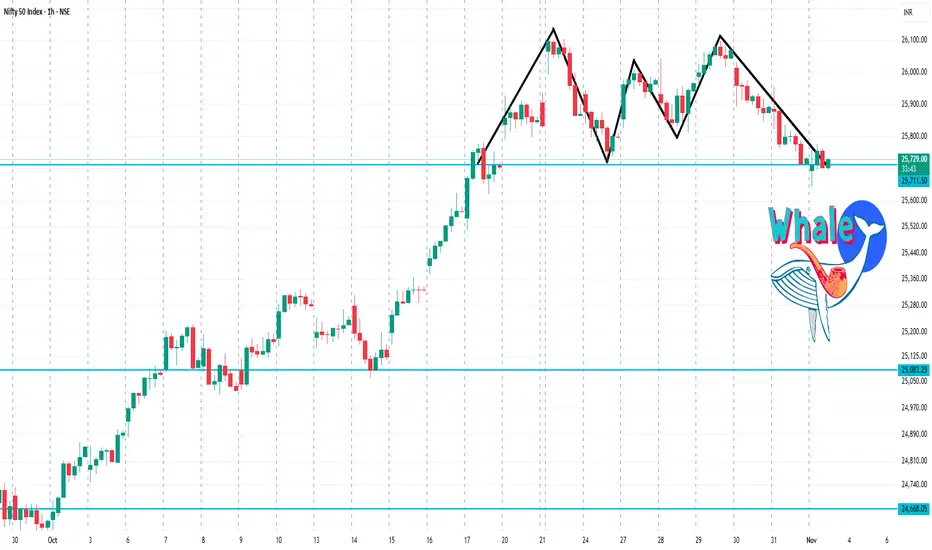
NIFTY might get weaker below 25700!!As we can see NIFTY has fallen exactly as analysed as it couldnt sustain itself above 26000 level. Now that it has closed below 26000, and also fomed M kinda pattern in bigger time frame which is a REVERSAL kinda pattern moreover we can see a strong bearish candle in WEEKLY time frame which can add fuel to fire hence sticking to our view, we will keep selling keeping target of 25500 in coming trading session so plan your trades accordingly.
31 Oct 2025 - Finally, we are short-selling Nifty + PostMortemNifty Stance Bearish 🐻
In last week's postmortem report, we said the Diwali rally would be coming to an end. I guess I said that too early, as I was hoping for a reversal on Monday or Tuesday, but the reversal came only on Friday.
Our last long signal was on the 3rd of October and a short-reversal came only on the 31st, which again shows how Nifty spent an entire month in bullish mode. The profits gained in this period is a whopping 985 points ~ 3.97%.
We have now formed a decent double top at the 26086 level and a faint double bottom on an upward-sloping trendline. As we all know, only one of them will actually work, and the double top is here to stay.
The upcoming support levels are 25681, 25219 and 25003. If we break the 25681 on Monday, the next 400 pts fall could come quite easily as more shorts could enter the system.
Meanwhile, the new rules on Nifty bank look really promising as the weightage of each component should not exceed 20% and a total of 14 banks have to be present in the index. The downside to this rule is that HDFC and ICICI banks, which have a weightage above 20% currently, may have to face outflows to reduce the weightage, or their weightage may have to be controlled via a formula.

NIFTY D ChartNIFTY making lower close, loer highs, lower lows since last 3 days.
Bearish
Support: 25550-25650
Resistance: 25800-25850

PCR Trading StrategesKey Components of an Option Contract
To understand option trading deeply, it’s essential to know its core components:
Underlying Asset: The financial asset on which the option is based (e.g., Nifty index, Reliance stock).
Strike Price: The fixed price at which the option holder can buy or sell the asset.
Premium: The price paid by the option buyer to the seller for acquiring the contract.
Expiry Date: The date on which the option contract ceases to exist.
Lot Size: Each option represents a set number of shares, known as a lot (e.g., NIFTY lot size is 50).

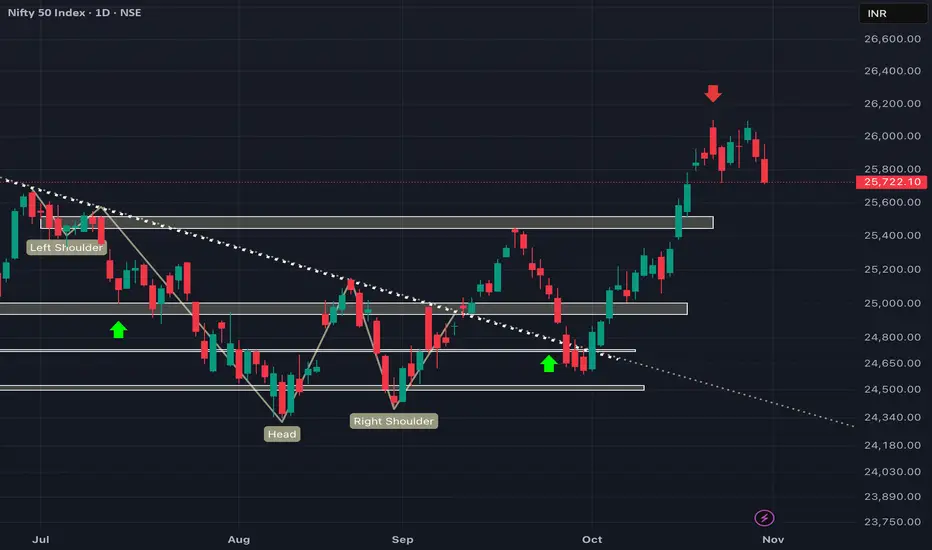
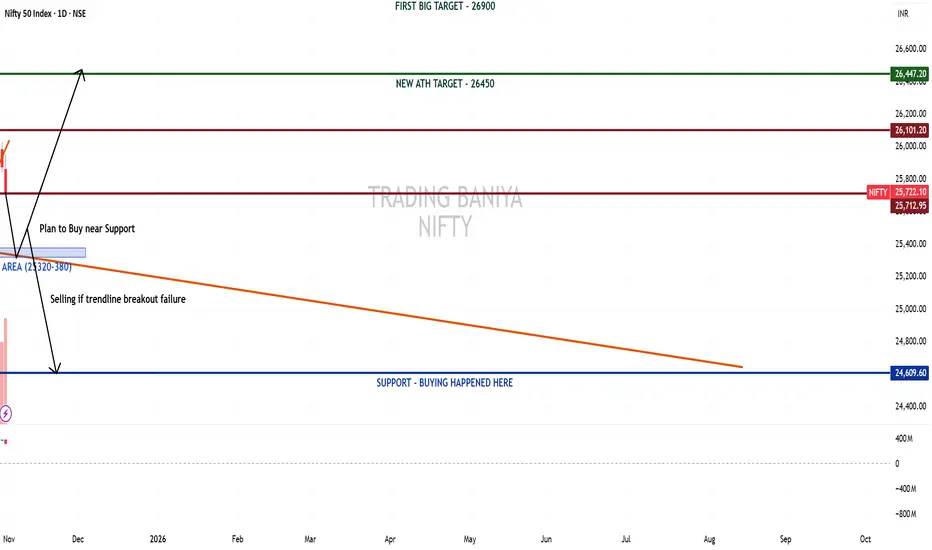
NIFTY – M Pattern Breakdown, Pullback Likely Before New ATH RallNifty has shown strong bullish momentum on the monthly charts, maintaining its long-term uptrend structure. The larger trend continues to be positive, and once the ongoing consolidation completes, there's a high probability of the market heading towards a new all-time high around 26450.
On the weekly charts, Nifty appears to be taking a pause at the top, currently at a crucial decision zone. Price action here will decide the next major leg:
Sustained strength above 25800 will likely resume the uptrend toward ATH levels.
Failure to hold could trigger a short-term correction.
On the daily chart, an M pattern has formed at the top, accompanied by a trendline breakdown. This suggests a possible short-term pullback toward the support area between 25320 – 25380, which aligns with a previous breakout zone and near-term demand region.
This zone can act as a buying opportunity near support if price stabilizes and reverses.
However, if this area also breaks decisively, expect a sharper decline toward 24600 (major support where buying previously emerged).
Trade Plan:
📉 Short-term: Expect dip toward 25320–25380.
📈 Medium-term: Look for reversal signs near support to ride the next rally toward 26,100 and 26450 (ATH).
❌ Invalidation: Breakdown below 25,320 with volume and failure to reclaim trendline.
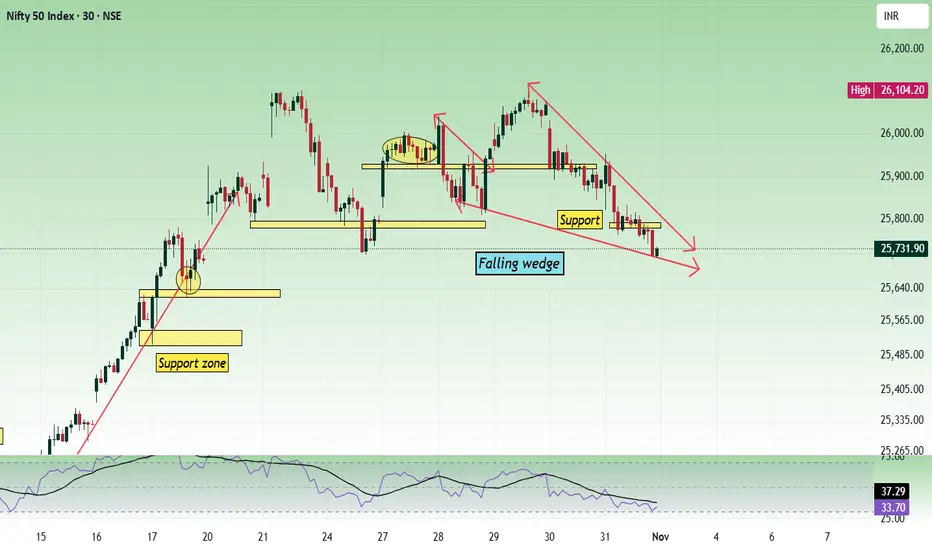
Nifty - Weekly Review Nov 3 to Nov 7Nifty in the lower time frame has formed a falling wedge, which is a bullish sign and also price is at the important crucial zone 25700. In the daily time frame, the price is showing bearish strength.
If the price breaks the 25680 - 25720 zone with bearish strength, 25500 can be tested.
Buy above 25740 with the stop loss of 25690 for the targets 25780, 25840, 25900, 25940, 25980, 26040 and 26080.
Sell below 25640 with the stop loss of 25690 for the targets 25600, 25560, 25520, 25460, 25400, 25360 and 25320.
Important levels to watch are 25500, 25700 and 25900 zones.
Always do your analysis before taking any trade.
The Relationship Between Risk and Position Size1. Understanding Risk in Trading
Risk in trading refers to the potential for financial loss on a given trade or investment. Every time you enter a trade, you expose yourself to uncertainty — the market may move in your favor, but it can also move against you.
Traders quantify risk in several ways:
Monetary Risk: The amount of money that could be lost on a trade.
Percentage Risk: The portion of total account capital that could be lost if the trade fails.
Market Risk: The possibility of price movement against your position due to volatility, news, or macroeconomic factors.
For instance, if you have a ₹100,000 trading account and you risk ₹2,000 on a single trade, your risk per trade is 2% of your capital. Managing this risk percentage is fundamental to long-term survival in the markets.
2. What Is Position Size?
Position size determines how much of your total trading capital you allocate to a specific trade. It’s not just about how many shares or contracts you buy; it’s about how much money you’re willing to risk on that position.
For example, suppose you buy 100 shares of a stock at ₹500 with a stop-loss at ₹490. Your risk per share is ₹10, and the total risk on the trade is ₹1,000 (100 shares × ₹10). If your maximum risk per trade is ₹1,000, then your position size (100 shares) aligns perfectly with your risk tolerance.
Thus, position size acts as a bridge between your risk limit and market volatility.
3. The Risk-Position Size Equation
The core relationship between risk and position size can be summarized in one simple formula:
Position Size = Account Risk Amount / Trade Risk per Unit
Where:
Account Risk Amount = (Total account balance × Percentage of risk per trade)
Trade Risk per Unit = (Entry price − Stop-loss price)
Example:
Let’s say:
Account size = ₹200,000
Risk per trade = 2% (₹4,000)
Entry = ₹1,000, Stop-loss = ₹980 (₹20 risk per share)
Then:
Position Size = ₹4,000/ ₹20 = 200 shares
This means you can safely buy 200 shares of that stock while keeping risk under 2% of your capital.
4. Why Position Sizing Is Critical
Position sizing is one of the most effective tools for controlling risk and ensuring longevity in trading. Even if you have an excellent strategy, poor sizing can wipe out your account after just a few losing trades.
Here’s why it matters:
Capital Preservation: Proper position sizing ensures you never lose too much on a single trade.
Emotional Stability: Knowing your risk in advance helps reduce emotional stress during volatile market movements.
Consistency: By maintaining a fixed risk percentage per trade, your results become more predictable and controlled.
Compounding Growth: Smaller, consistent losses allow capital to compound over time rather than being eroded by large drawdowns.
5. The Role of Stop-Loss in Position Sizing
Stop-loss orders are essential in defining how much you risk per trade. Without a stop-loss, you can’t calculate your position size accurately because you don’t know where the trade is invalidated.
When traders set their stop-loss, they define:
The maximum loss per share/unit, and
The total amount they’re willing to lose on that trade.
For instance, a wider stop-loss (say ₹50 per share) means you must take a smaller position to maintain the same total risk. Conversely, a tighter stop-loss (₹10 per share) allows for a larger position. Thus, stop-loss distance directly affects position size.
6. Fixed Fractional Position Sizing
One of the most common risk management methods is Fixed Fractional Position Sizing, where you risk a fixed percentage (usually 1–2%) of your total account on every trade.
If your account grows, your risk amount grows proportionally; if your account shrinks, the amount you risk decreases automatically. This approach ensures you adapt to both profits and drawdowns dynamically.
Example:
Account Size 2% Risk per Trade ₹ Risk Amount Stop Loss (₹10) Position Size
₹100,000 2% ₹2,000 ₹10 200 shares
₹120,000 2% ₹2,400 ₹10 240 shares
₹80,000 2% ₹1,600 ₹10 160 shares
This method helps traders scale their positions safely as they grow their capital.
7. Risk-to-Reward Ratio and Position Size
While position size controls risk, the risk-to-reward ratio (R:R) determines whether a trade is worth taking. Traders typically look for trades where the potential reward outweighs the risk — often at least 1:2 or 1:3.
For instance, if your stop-loss is ₹10 below entry and your target is ₹30 above, your R:R is 1:3. Even with a 40% win rate, you can still be profitable because your winning trades yield more than your losses.
Position sizing ensures that even if you lose multiple trades in a row, your average loss remains small, while profitable trades make up for the setbacks.
8. The Psychological Connection
Traders often underestimate the psychological comfort that comes from correct position sizing. Over-leveraging — taking oversized positions relative to account size — leads to stress, fear, and impulsive decisions. On the other hand, trading too small may limit returns and confidence.
A well-calibrated position size:
Reduces fear of loss
Prevents emotional overreaction
Builds trading discipline
Psychologically, traders who respect their risk limits are more consistent because they are not emotionally attached to single trades — they think in terms of probabilities rather than outcomes.
9. Advanced Approaches to Position Sizing
Professional traders often use adaptive or dynamic position sizing models, which adjust based on volatility, performance, or confidence level.
Volatility-Based Position Sizing: Uses tools like Average True Range (ATR) to adjust position size. If volatility increases, position size decreases to maintain consistent risk.
Kelly Criterion: A mathematical model used to maximize long-term growth by balancing risk and return.
Equity Curve-Based Adjustments: Increasing risk slightly after winning streaks or reducing it during drawdowns to manage performance-based emotions.
These methods fine-tune the balance between aggression and safety.
10. The Balance Between Risk and Opportunity
The relationship between risk and position size is about finding equilibrium — taking enough risk to grow your capital but not so much that you blow up after a few losses.
Trading is not about avoiding risk entirely; it’s about controlling and pricing it intelligently. When position sizing is aligned with your risk tolerance, trading edge, and emotional stability, you achieve consistency — the key to long-term profitability.
Conclusion
The relationship between risk and position size defines the foundation of successful trading. Without proper position sizing, even the best strategies can fail due to uncontrolled losses. By managing risk per trade, setting disciplined stop-losses, and aligning position size with account capital, traders can survive drawdowns and thrive during profitable phases.
Ultimately, trading is not about predicting every move — it’s about managing uncertainty. Position sizing transforms that uncertainty into a controlled and measurable risk, giving traders the confidence and consistency needed to succeed in any market environment.
In short: Position sizing is not just a number — it’s your safety net, your strategy, and your survival plan.
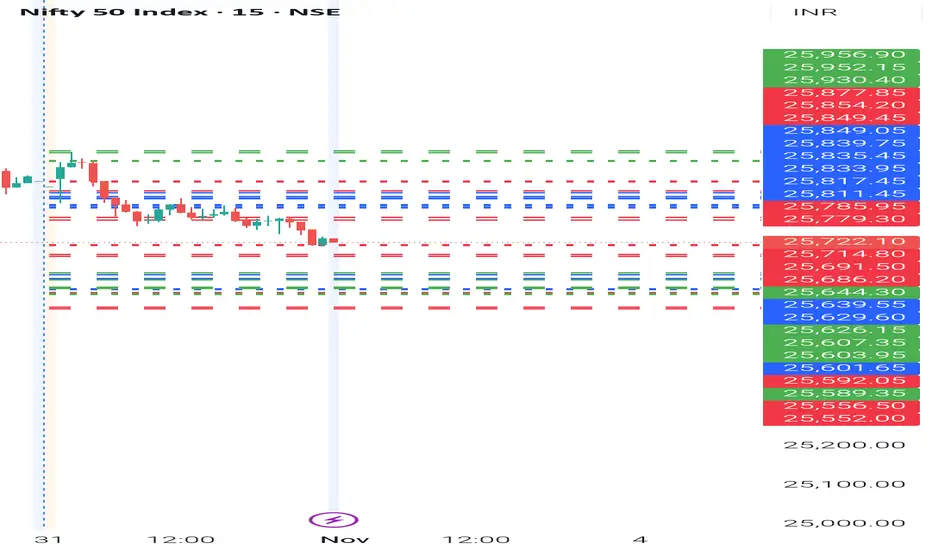
NIFTY- Intraday Levels - 3rd November 2025If NIFTY sustain above 25779/85 above this bullish then around 25811/17 then 25833/39 above this more bullish 25849/54/77 then above this wait
If NIFTY sustain below 25714/25691/86 below this bearish then around 25644/39/29/26 strong level then 25607/03/01 very very strong level day closing below this will indicate more seeling pressure however I'm hoping the market to make a bottom at this level ?? then 25592/89 below this more bearish then 25556/52 below this wait
My view :-
"My viewpoint, offered purely for analytical consideration, is that the market will exhibit volatility with movement in both directions as it seeks a bottom for this expiration cycle. The trading thesis is: Nifty (bearish tactical approach: sell on rise) and Bank Nifty (bullish tactical approach: buy on dip). This analysis is highly speculative and is not guaranteed to be accurate; therefore, the implementation of stringent risk controls is non-negotiable for mitigating trade risk."
Consider some buffer points in above levels.
Please do your due diligence before trading or investment.
**Disclaimer -
I am not a SEBI registered analyst or advisor. I does not represent or endorse the accuracy or reliability of any information, conversation, or content. Stock trading is inherently risky and the users agree to assume complete and full responsibility for the outcomes of all trading decisions that they make, including but not limited to loss of capital. None of these communications should be construed as an offer to buy or sell securities, nor advice to do so. The users understands and acknowledges that there is a very high risk involved in trading securities. By using this information, the user agrees that use of this information is entirely at their own risk.
Thank you.
NIFTY Weekly OutlookNIFTY Weekly Outlook
NIFTY has closed almost flat but with bearish sentiment last week, ending at lows. 2 Consecutive rejection candles at 26100 has been formed in weekly TF. Hourly major swings are placed 26115 and 25690. Neutrally we should wait for breakout of any to plan the directional trade.
After a small pullback if index breaks 25690 then index will test 25100 zone as per Half Bat pattern.
By any chance if low of the current week does not break and breaks 26115 in the higher side, index will show double force move above 26115 to a new All Time High.
I am Not SEBI Registered
This is my personal analysis for my personal trading. Kindly consult your financial advisor before taking any actions based on this.


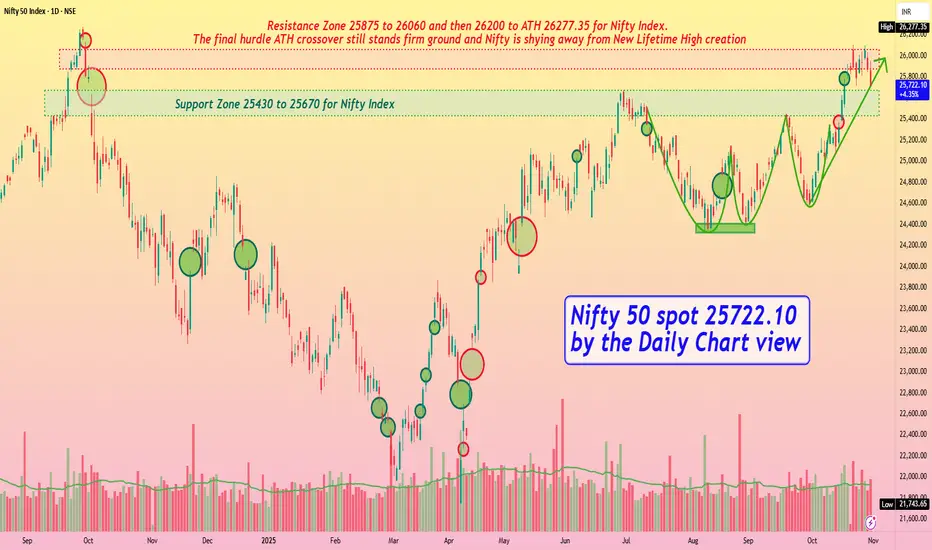
Nifty 50 spot 25722.10 by the Daily Chart view - Weekly UpdateNifty 50 spot 25722.10 by the Daily Chart view - Weekly Update
- Support Zone 25430 to 25670 for Nifty Index
- Rising Support Trendline seems in active mode but may be broken
- Nifty below Resistance Zone but taking rest tad above the Support Zone
- Resistance Zone 25875 to 26060 and then 26200 to ATH 26277.35 for Nifty Index
- Bullish Rounding Bottoms seems active but continued skepticism keeping the Nifty index weak
- The final hurdle ATH crossover still stands ground and Nifty shying away from New Lifetime High creation
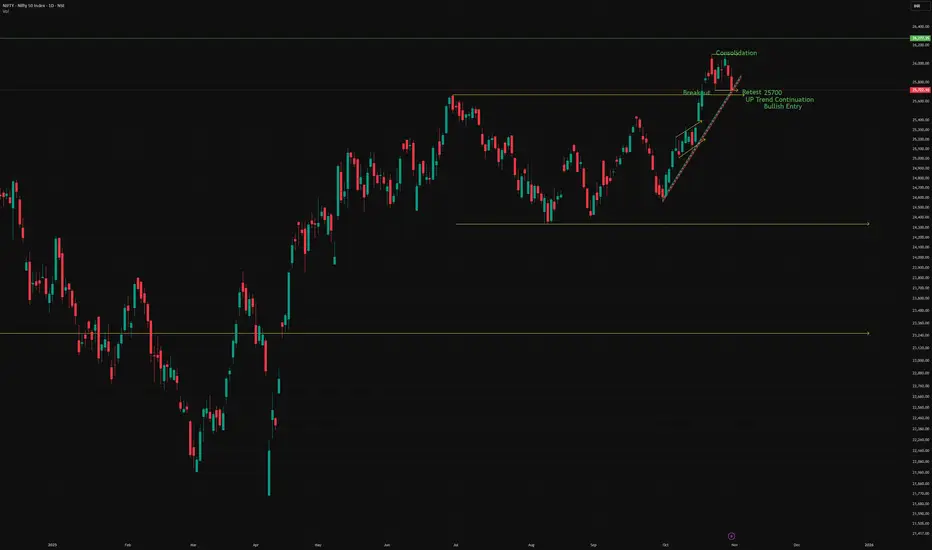
Nifty Breakout and retestNifty breakout in Monthly chart
after breakout it has consolidated for 8 trading sessions above the breakout level
25650 to 25700 potential Trend continuation entry level
As long as Nifty holds this breakout level only looking for bullish setups
Algorithmic & Quantitative TradingIntroduction
Over the past two decades, the global financial markets have transformed from bustling trading floors filled with human brokers shouting orders to high-speed electronic exchanges dominated by algorithms. This shift represents one of the most profound technological revolutions in finance — the rise of Algorithmic and Quantitative Trading (AQT).
These two closely related fields leverage mathematics, statistics, and computing to make trading more efficient, data-driven, and disciplined. They have not only changed how trades are executed but also how investment decisions are made. Understanding algorithmic and quantitative trading is therefore essential for grasping how modern financial markets truly function today.
1. Understanding Algorithmic Trading
1.1 Definition and Core Concept
Algorithmic trading (Algo trading) refers to the use of computer algorithms — step-by-step sets of coded instructions — to execute trades automatically based on pre-defined criteria such as price, timing, volume, or market conditions.
In simpler terms, instead of a human clicking a buy or sell button, a computer program makes the decision and executes it faster than any human could.
An algorithm can be designed to:
Identify trading opportunities,
Execute trades at optimal prices,
Manage risk through stop-loss or profit-taking rules, and
Adjust its strategy dynamically as the market evolves.
The central goal of algorithmic trading is to eliminate human emotion and delay from the trading process, thereby increasing speed, precision, and consistency.
2. The Evolution of Algorithmic Trading
Algorithmic trading began in the 1970s with electronic trading systems like NASDAQ. The real explosion came in the 1990s and early 2000s with advances in computing power and connectivity. By 2010, a significant portion of trading volume in developed markets such as the U.S. and Europe was algorithmic.
Today, algorithms are responsible for over 70% of equity trades in the U.S. and an increasing share of trades in emerging markets like India. The evolution has moved through stages:
Simple Execution Algorithms – Used to break large institutional orders into smaller parts to minimize market impact.
Statistical Arbitrage and Pairs Trading – Exploiting small price inefficiencies between related securities.
High-Frequency Trading (HFT) – Using ultra-fast systems to exploit millisecond-level market movements.
AI-Driven and Machine Learning Algorithms – Continuously adapting strategies using live market data.
3. How Algorithmic Trading Works
Algorithmic trading operates through a set of coded rules implemented in trading software. A basic algorithm typically includes the following components:
3.1 Strategy Definition
This is where the logic of the trade is specified. For instance:
Buy 100 shares of XYZ if the 50-day moving average crosses above the 200-day moving average (a “Golden Cross”).
Sell a stock if its price falls 2% below the previous day’s close.
3.2 Market Data Input
Algorithms consume real-time and historical data — prices, volumes, order book depth, and even news sentiment — to make decisions.
3.3 Signal Generation
Based on input data, the algorithm identifies a trading opportunity, generating a buy or sell signal.
3.4 Order Execution
The algorithm automatically places orders in the market, sometimes splitting large orders into smaller “child orders” to minimize price impact.
3.5 Risk Management
Modern algorithms include risk controls, such as maximum position size, stop losses, or exposure limits, to prevent major losses.
3.6 Performance Monitoring
Traders or institutions continuously monitor the algorithm’s performance and make parameter adjustments when required.
4. Understanding Quantitative Trading
4.1 Definition
Quantitative trading (Quant trading) focuses on using mathematical and statistical models to identify profitable trading opportunities. While algorithmic trading automates execution, quantitative trading focuses on the design and development of the trading strategy itself.
In essence:
Quantitative Trading = The science of building strategies using data and math.
Algorithmic Trading = The engineering of executing those strategies efficiently.
Most modern trading operations combine both — a quant model discovers the opportunity, and an algorithm executes it automatically.
5. The Building Blocks of Quantitative Trading
5.1 Data Collection and Cleaning
Quantitative trading begins with data — historical prices, volume, fundamentals, economic indicators, sentiment data, etc. This data must be cleaned, normalized, and structured for analysis.
5.2 Hypothesis Development
A quant trader might form a hypothesis such as “small-cap stocks outperform large-caps after earnings surprises.” The model then tests this hypothesis statistically.
5.3 Backtesting
The strategy is simulated on historical data to measure performance, risk, and robustness. Metrics such as Sharpe Ratio, drawdown, and win rate are used to evaluate success.
5.4 Optimization
Parameters are fine-tuned to improve results without overfitting (a common trap where a model performs well historically but fails in live markets).
5.5 Execution and Automation
Once validated, the strategy is deployed through algorithmic systems for live execution.
6. Common Quantitative Strategies
Quantitative trading covers a wide range of strategies, including:
Statistical Arbitrage – Exploiting temporary mispricings between correlated assets.
Mean Reversion – Betting that prices will return to their long-term average after deviations.
Momentum Trading – Riding the wave of stocks showing strong price trends.
Market Making – Providing liquidity by continuously quoting buy and sell prices.
Event-Driven Strategies – Trading based on corporate actions like earnings announcements or mergers.
Machine Learning Models – Using AI to identify hidden patterns or predict price movements.
7. Role of Technology in Algorithmic and Quantitative Trading
Technology is the backbone of AQT.
Key technological pillars include:
7.1 High-Speed Connectivity
Millisecond-level latency can determine profitability in markets dominated by speed.
7.2 Co-location and Proximity Hosting
Firms place their trading servers physically close to exchange servers to minimize transmission delay.
7.3 Advanced Programming Languages
Languages like Python, C++, and Java are used to develop models and execution systems.
7.4 Big Data and Cloud Computing
Handling terabytes of market data requires scalable computing environments.
7.5 Artificial Intelligence and Machine Learning
AI systems can continuously learn from new data, adapt to market changes, and improve their predictive accuracy.
8. Advantages of Algorithmic & Quantitative Trading
8.1 Speed and Efficiency
Algorithms execute trades in microseconds, ensuring optimal entry and exit points.
8.2 Emotion-Free Decisions
Trading based on predefined rules eliminates emotional biases such as fear or greed.
8.3 Better Execution and Reduced Costs
Execution algorithms reduce slippage (difference between expected and actual trade prices) and transaction costs.
8.4 Backtesting and Strategy Validation
Traders can test strategies on historical data before risking capital.
8.5 Diversification
Algorithms can manage multiple strategies and asset classes simultaneously, reducing overall portfolio risk.
9. Challenges and Risks
Despite its sophistication, algorithmic and quantitative trading comes with notable risks:
9.1 Overfitting and Model Risk
A strategy that performs brilliantly on past data might fail miserably in live markets if it’s over-optimized.
9.2 Market Volatility Amplification
Algorithms can sometimes intensify volatility, as seen during events like the 2010 “Flash Crash.”
9.3 Technical Failures
Software glitches, connectivity losses, or coding errors can lead to massive financial losses.
9.4 Competition and Saturation
As more firms adopt similar strategies, profit opportunities diminish — leading to a “race to the bottom.”
9.5 Regulatory and Ethical Issues
Market regulators constantly monitor algorithmic activity to prevent manipulation such as spoofing or layering.
10. Regulation of Algorithmic Trading
Globally, regulators have imposed frameworks to ensure transparency and fairness.
For example:
U.S. SEC & FINRA regulate algorithmic practices under strict risk control requirements.
MiFID II in Europe demands algorithmic systems undergo stress testing and registration.
SEBI (India) has guidelines requiring brokers to seek prior approval before deploying any algo strategy and maintain strong risk controls.
The goal is to ensure that the speed advantage of technology does not compromise market integrity.
11. The Role of Data Science and Machine Learning
The next frontier in AQT lies in Machine Learning (ML) and Artificial Intelligence (AI). These technologies go beyond rule-based systems by allowing algorithms to learn from experience.
For instance:
Neural Networks can predict short-term price direction based on complex non-linear relationships.
Natural Language Processing (NLP) can analyze news headlines or social media sentiment to anticipate market reactions.
Reinforcement Learning allows algorithms to evolve and optimize trading behavior through trial and feedback.
The integration of ML transforms traditional models into adaptive, self-learning systems capable of functioning even in rapidly changing environments.
12. The Human Element in a Quant World
Despite the automation, humans remain central to algorithmic and quantitative trading.
Quantitative analysts (“quants”) design and validate models, while risk managers ensure systems operate within limits.
Moreover, intuition and judgment still matter — particularly in interpreting data, handling market anomalies, or adjusting strategies during unexpected events like geopolitical crises or pandemics.
Thus, the future of AQT is not about replacing humans but enhancing their decision-making power through technology.
13. Future Trends in Algorithmic & Quantitative Trading
The future of AQT is shaped by several emerging trends:
AI-Driven Adaptive Systems: Fully autonomous algorithms capable of evolving in real time.
Quantum Computing: Expected to dramatically enhance processing speeds and optimization capacity.
Blockchain Integration: Smart contracts could enable decentralized, algorithmic trading platforms.
Retail Algorithmic Access: Platforms like Zerodha’s Streak or Interactive Brokers’ APIs are democratizing algo trading for retail investors.
Sustainability and ESG Integration: Algorithms now factor in environmental and social data to align with ethical investing trends.
These innovations will make markets more efficient but also more complex, demanding greater regulatory oversight and risk awareness.
Conclusion
Algorithmic and Quantitative Trading represent the perfect blend of mathematics, technology, and finance. Together, they have revolutionized the way markets operate — making trading faster, more efficient, and more data-driven than ever before.
While algorithms dominate execution, quantitative models drive strategy formulation. The synergy between them defines modern finance’s competitive edge. Yet, success in this domain requires not just technical skill but also rigorous risk control, continuous learning, and a deep understanding of market behavior.
As we look ahead, the boundary between human intelligence and artificial intelligence in markets will continue to blur. The future trader will be part mathematician, part programmer, and part strategist — operating in a world where data is the new currency and algorithms are the engines that power the markets of tomorrow.