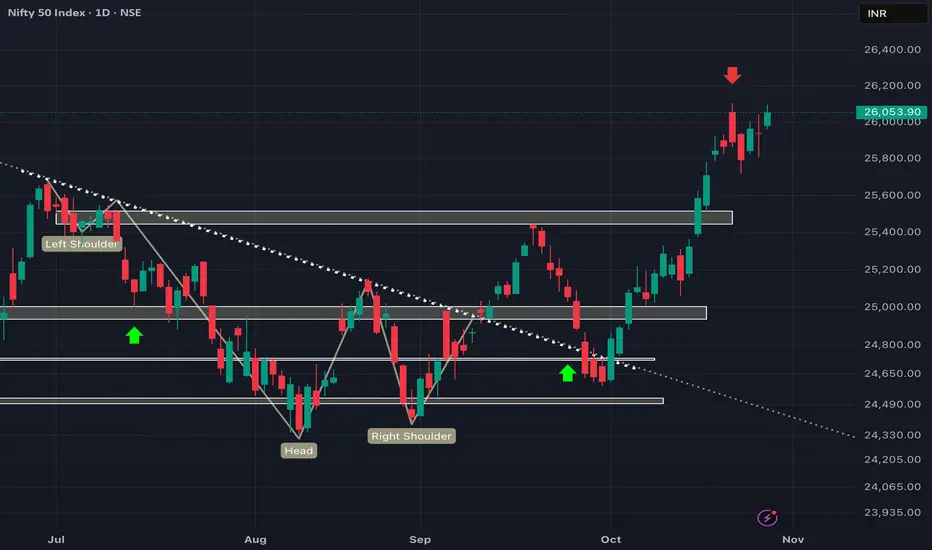
Nifty has formed a cup and handle ready to break outNifty has formed a cup and handle ready to break out. Nifty and Indian markets may start a positive trajectory.
Trade ideas

Nifty outlookBased on nifty performance, Index looks like double top near 26000!. After a tremendous bull run in the month of October reached new 52 week high. Despite this run even on monthly expiry day nifty failed to reach all time high!!. After that fed action failed to fuel the bulls. I think till next trigger like Bihar election, US - India trade deal nifty will oscillate in a range between 26100 - 25500

Nifty Outlook Based on nifty performance, Index looks like double top near 26000!!. After a tremendous bull run in the month of October reached new 52 week high. Despite this run even on monthly expiry day nifty failed to reach all time high!!. After that fed action failed to fuel the bulls. I think till next trigger like Bihar election, US - India trade deal nifty will oscillate in a range between 26100 - 25500

NIFTY- Intraday Levels - 31st October 2025If NIFTY sustain above 25986/91 or 26005 above this bullish then 26069/76 or 97/26107 above this more bullish 26154/64/84/94 then above this wait
If NIFTY sustain below 25877 below this bearish then around 25854/47/35/31 then 25817/11 strong level below this more bearish then 25779/75 then 25761/52 then last hope 25724/14 below this wait
My view :-
For the purpose of your study and analytical review only, my strategy is a 'sell on rise for 31st oct and also 3rd November (Monday)' approach. I must emphasize that this analysis carries an inherent risk of being inaccurate, and the use of stringent risk management protocols is absolutely essential for trade protection
Consider some buffer points in above levels.
Please do your due diligence before trading or investment.
**Disclaimer -
I am not a SEBI registered analyst or advisor. I does not represent or endorse the accuracy or reliability of any information, conversation, or content. Stock trading is inherently risky and the users agree to assume complete and full responsibility for the outcomes of all trading decisions that they make, including but not limited to loss of capital. None of these communications should be construed as an offer to buy or sell securities, nor advice to do so. The users understands and acknowledges that there is a very high risk involved in trading securities. By using this information, the user agrees that use of this information is entirely at their own risk.
Thank you.
Nifty Intraday Analysis for 30th October 2025NSE:NIFTY
Market volatility is expected after the US FOMC meeting scheduled tonight, particularly in response to any rate cuts and the Federal Reserve's commentary.
Index has resistance near 26225 – 26275 range and if index crosses and sustains above this level then may reach near 26450 – 26500 range.
Nifty has immediate support near 25900 – 25850 range and if this support is broken then index may tank near 25700 – 25650 range.
Nifty Structure Analysis & Trade Plan: 31st OctoberBased on the charts and the market's performance on Wednesday, October 30, the Nifty experienced a sharp reversal/correction in the last half of the session, pulling back significantly from the high established earlier in the day. The index closed below a critical short-term support level.
Detailed Market Structure Breakdown
4-Hour Chart (Macro Trend)
Structure: The Nifty is now in a Corrective Phase within its broader uptrend. The price broke out of the ascending channel to the upside in the morning but was aggressively rejected from the 26,100 - 26,200 supply zone (All-Time High area). The final 4H candle is a large bearish candle, confirming the Market Structure Shift (MSS) to the downside. The price closed right on the 9-period EMA (blue line on the chart).
Key Levels:
Major Supply (Resistance): 26,000 - 26,100. This area (the breakdown level and psychological mark) is the immediate overhead resistance.
Major Demand (Support): 25,750 - 25,800. This area, which includes the lower boundary of the previous steep channel and a key FVG (Fair Value Gap), is the must-hold zone for the medium-term rally.
Outlook: The short-term bias is Bearish. The sharp reversal suggests strong profit-booking, and the market is likely to seek lower support levels.
1-Hour Chart (Intermediate View)
Structure: The 1H chart clearly shows the massive selling pressure that followed the failure to break the high. The price has broken below the lower trendline of the immediate ascending channel and has formed a distinct descending channel during the last hours of trading.
Key Levels:
Immediate Resistance: 25,950 (The breakdown level and upper boundary of the descending channel).
Immediate Support: 25,750 - 25,800.
15-Minute Chart (Intraday View)
Structure: The 15M chart confirms the steep descending channel and strong intraday bearish control. The market closed near its low, indicating bears are dominant for the open.
Key Levels:
Intraday Supply: 25,950.
Intraday Demand: 25,750 - 25,800.
Outlook: Strongly Bearish for the session open. A "Sell on Rise" strategy is highly favored.
📈 Structure Analysis & Trade Plan: 31st October
Market Outlook: The Nifty witnessed an aggressive reversal after failing to make a new ATH. The primary strategy is to sell the breakdown or sell into any weak rise.
Bearish Scenario (Primary Plan: Correction Continuation)
Justification: The aggressive rejection from the supply zone and the breakdown of the short-term bullish structure favor continuation toward the main FVG support.
Entry: Short entry on a decisive break and 15-minute candle close below 25,750. Alternatively, short a retest and rejection of the 25,950 level (upper channel/FVG).
Stop Loss (SL): Place a stop loss above 26,100 (above the high of the breakdown).
Targets:
T1: 25,600 (Next major support).
T2: 25,400 - 25,500 (Major FVG demand zone).
Bullish Scenario (Counter-Trend/Reversal)
Justification: Only valid if the Fed decision was extremely dovish, leading to a strong gap-up that negates the current selling structure.
Trigger: A sustained move and close above 26,100.
Entry: Long entry on a confirmed 15-minute close above 26,100.
Stop Loss (SL): Below 25,900.
Targets:
T1: 26,277 (All-Time High retest).
T2: 26,500 (Extension target).
Key Levels for Observation:
Immediate Decision Point: 25,750 - 25,950 zone.
Bearish Confirmation: Sustained trade below 25,750.
Bullish Warning: A move back above 26,000.
Line in the Sand: 25,750. Below this level, the short-term bias is strongly bearish.
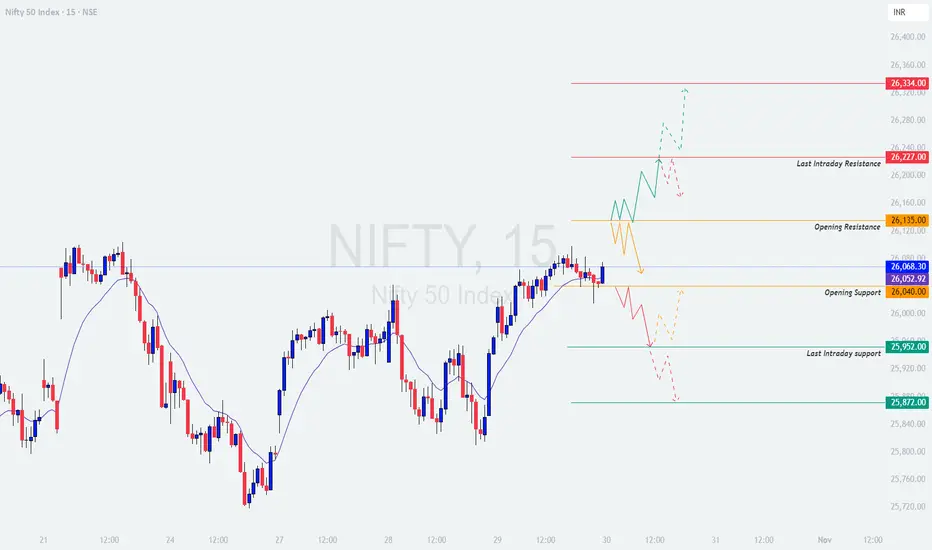
NIFTY : Trading levels and Plan for 30-Oct-2025NIFTY TRADING PLAN – 30-Oct-2025
📊 Prepared by LiveTradingBox | Based on 15-min chart structure & key intraday reference zones
🔍 Key Levels to Watch:
🟥 Last Intraday Resistance: 26,227
🟥 Next Resistance Extension: 26,334
🟧 Opening Resistance: 26,135
🟦 Opening Support: 26,040
🟩 Last Intraday Support: 25,952
🟢 Major Support Zone: 25,872
🟢 1. Gap-Up Opening (Above 26,135 – 100+ points)
If Nifty opens with a Gap-Up above 26,135 , it enters the higher resistance zone. The immediate focus will shift to whether it can sustain above this level. Sustained price action above 26,135 may trigger momentum buying toward 26,227 and possibly 26,334 if strength continues.
Plan of Action:
Wait for the first 15-minute candle to close. Avoid chasing the initial spike.
If price sustains above 26,135, consider entering long positions targeting 26,227–26,334 zone.
Keep a strict stop loss below 26,040 on a closing basis.
If rejection occurs near 26,227, book profits partially and trail your stop to cost.
If Nifty fails to sustain above 26,135 and slips below 26,040, avoid longs and prepare for a pullback toward 25,952.
📘 Educational Insight:
A strong gap-up requires confirmation. Many traders jump in early, but waiting for price to hold above the opening resistance helps avoid fake breakouts.
🟦 2. Flat Opening (Around 26,040 ±50 points)
A flat start near 26,040 suggests balanced sentiment between buyers and sellers. Directional clarity will emerge once either the resistance or support levels are broken.
Plan of Action:
Allow the first 30 minutes for market stabilization.
A sustained move above 26,135 with volume indicates strength — target 26,227 with a stop loss below 26,040.
If Nifty stays range-bound between 26,135–26,040, expect sideways movement — best avoided for options trading.
Breakdown below 26,040 will open short opportunities targeting 25,952–25,872 zones.
For option buyers, avoid overtrading in sideways phases to reduce premium decay.
📘 Educational Insight:
Flat openings are often “wait-and-watch” setups. Avoid predicting direction; instead, react once key levels confirm strength or weakness.
🔻 3. Gap-Down Opening (Below 25,952 – 100+ points)
If Nifty opens below 25,952, it reflects weak sentiment and profit booking pressure. The index will test demand near 25,872, which serves as the final intraday support zone.
Plan of Action:
Monitor price reaction near 25,872 — if it holds and rebounds, expect a short-covering rally toward 26,040.
If Nifty remains below 25,952 without recovery, maintain a bearish stance with a target of 25,820 (psychological level).
Place a stop loss above 26,040 on an hourly close.
Avoid bottom fishing; wait for confirmation candles before considering reversals.
📘 Educational Insight:
Gap-down setups usually trigger panic trades. Professionals wait for stabilization before entering, while retail traders often get trapped during early volatility.
🧠 Risk Management Tips for Options Traders:
Always define your risk — use stop-loss orders and don’t hold losing trades beyond your comfort zone.
Avoid trading both sides of the market; pick one directional bias.
Stick to ATM or slightly ITM options to manage time decay efficiently.
Avoid aggressive trades during the first 15–30 minutes after the market opens.
Maintain proper position sizing — never risk more than 2–3% of your trading capital in a single trade.
📈 Summary & Conclusion:
Above 26,135, the bias remains bullish — expect an extension toward 26,227–26,334.
Between 26,040–26,135, expect choppy consolidation — best to wait for breakout confirmation.
Below 25,952, weakness may extend toward 25,872 or lower if support fails.
Stick to a disciplined approach — react to price, don’t predict it.
⚠️ Disclaimer:
I am not a SEBI-registered analyst . The above analysis is purely for educational and informational purposes. Traders should do their own analysis or consult a financial advisor before taking any positions.
nifty
Nifty
Technical indicators are showing sell signals and an ascending channel pattern is forming.
Watch for a break below 25850/25825 to maintain the bearish bias. If support holds, a retest of 26000/26100 is possible, and further upside could follow from here.
Part 12 Tradig Master ClassUses of Options
Hedging: Investors use options to protect their portfolios against adverse price movements. For instance, a trader holding stocks can buy puts to guard against potential declines.
Speculation: Traders use options to profit from expected price movements with limited initial capital.
Income Generation: Writing (selling) options, especially covered calls, allows investors to earn premium income.
Advantages of Option Trading
Leverage: Options allow control over large positions with smaller capital.
Flexibility: They can be used in various strategies like spreads, straddles, and strangles.
Risk Management: Losses are limited to the premium paid for option buyers.

The Cost of Common Trading Mistakes1. The Price of Poor Risk Management
Perhaps the single most costly mistake in trading is the failure to manage risk effectively. Risk management isn’t exciting — it’s not about predicting which stock will rally or when the market will crash — but it’s what separates long-term survivors from those who blow up their accounts.
The mistake: Traders often risk too much on a single position or fail to use stop-losses. They believe “this trade can’t go wrong,” which is usually when it does.
The cost: A single large loss can wipe out weeks or even months of steady gains. For instance, risking 20% of capital per trade means losing just five trades in a row could reduce your account by over 60%.
The fix: Never risk more than 1–2% of your capital on any single trade. Always define exit points before entering. Position sizing and disciplined stop-loss placement are your best defense against market uncertainty.
In trading, your number one job is not to make money — it’s to protect your capital.
2. Overtrading: When Action Becomes Addiction
Overtrading is one of the most silent killers of profitability. The temptation to “always be in the market” arises from boredom, greed, or the illusion of control.
The mistake: Taking too many trades in a day or week, often without solid setups or edge.
The cost: High transaction costs, emotional fatigue, and poor decision-making. Frequent trades erode profits through brokerage fees and slippage. More importantly, it leads to mental exhaustion, increasing the likelihood of impulsive actions.
The fix: Focus on quality, not quantity. A single high-probability setup can be more profitable than 10 random ones. Define your trading plan and stick to it — trade only when the odds align with your edge.
Remember: patience pays more than constant participation.
3. Ignoring the Power of Emotions
Trading is as much a psychological game as it is a financial one. Emotions like fear, greed, and impatience cloud rational judgment, turning what should be a strategic activity into an emotional rollercoaster.
The mistake: Traders panic-sell during drawdowns or chase prices when they see momentum building.
The cost: Fear often causes traders to exit winning positions too early, while greed makes them hold losing ones for too long. Both habits destroy risk-reward balance and long-term profitability.
The fix: Develop emotional discipline. Stick to predefined rules. Consider journaling your trades and feelings to identify emotional triggers. Meditation, mindfulness, or even stepping away from screens can help maintain balance.
Markets reward logic, not emotion.
4. Lack of a Trading Plan
Without a structured plan, trading becomes guesswork — and guesswork rarely pays.
The mistake: Many traders enter trades based on “gut feeling” or tips from others. They lack clear entry and exit rules, risk limits, or defined objectives.
The cost: Inconsistent results and an inability to measure performance. Without a plan, traders don’t know what’s working or failing, making improvement impossible.
The fix: Every trader should build a Trading Plan that includes:
Market selection (e.g., equities, commodities, forex)
Entry/exit rules
Stop-loss and take-profit strategy
Risk per trade
Maximum drawdown tolerance
Time commitment and review schedule
Once you have a plan — follow it with discipline. Adjust it only after analyzing sufficient data, not on emotion.
5. The Dangers of Averaging Down
Averaging down — buying more of a losing position — is one of the most expensive mistakes traders make. It stems from ego and denial.
The mistake: When a stock drops, traders add more, believing it’s “cheaper now.” They hope the market will reverse.
The cost: If the trend continues downward, losses multiply quickly. Averaging down can turn a small, manageable loss into a portfolio disaster.
The fix: Respect stop-losses. Never add to a losing trade unless it’s part of a pre-tested, rule-based scaling strategy. The best traders add to winning positions, not losing ones.
Hope is not a trading strategy.
6. FOMO and Chasing Trends
The Fear of Missing Out (FOMO) is a modern-day trading plague. Watching others profit from a sharp rally often triggers impulsive buying — usually right before the trend reverses.
The mistake: Entering trades too late, when prices are overextended.
The cost: Buying at tops and selling at bottoms. The emotional rush of chasing momentum leads to poor entries and steep losses.
The fix: Accept that missing some moves is part of trading. Opportunities never end; markets are infinite. Instead of chasing, plan your entries ahead — set alerts and wait for pullbacks.
Discipline will always beat excitement.
7. Neglecting Market Conditions
A strategy that works in a trending market might fail miserably in a choppy one. Many traders ignore the context in which they are trading.
The mistake: Applying the same approach regardless of volatility, liquidity, or trend conditions.
The cost: Misaligned trades — for example, trend-following in sideways markets or scalping in low-volume environments.
The fix: Always assess market structure before trading. Identify whether the market is trending, consolidating, or reversing. Adjust position size, targets, and stop-loss accordingly.
Adaptation is the hallmark of professional trading.
8. Lack of Continuous Learning
Markets evolve — what worked yesterday might not work tomorrow. Many traders, after some early success, stop learning and refining their edge.
The mistake: Relying on outdated strategies or ignoring new tools like algorithmic signals, volume profiles, or AI-based analysis.
The cost: Reduced performance and missed opportunities. The cost of stagnation is gradual but devastating.
The fix: Treat trading as a lifelong learning process. Read, backtest, follow credible analysts, and review your trades weekly. Stay flexible and open-minded.
In trading, education is cheaper than ignorance.
9. Ignoring Position Sizing
Even with a good strategy, poor position sizing can lead to disaster.
The mistake: Betting too big when confident and too small when uncertain — purely based on emotion.
The cost: Volatile results and emotional burnout. Large positions increase stress and magnify mistakes.
The fix: Use a consistent formula, such as the 2% rule, meaning you risk only 2% of capital per trade. Position sizing should depend on stop-loss distance and account equity, not “gut feeling.”
Consistency builds compounding.
10. Revenge Trading
After a loss, some traders immediately jump into another trade, desperate to recover. This is known as revenge trading — a fast track to bigger losses.
The mistake: Trading emotionally after a setback without analysis or patience.
The cost: Poor entries, disregard for setups, and compounding losses. It also damages psychological balance.
The fix: Accept losses as part of the business. Take a break after significant drawdowns. Review what went wrong before returning to the market.
In trading, emotional control is wealth control.
11. Neglecting Data and Journaling
Professional traders analyze data — amateur traders rely on memory. The absence of trade journaling means lessons are forgotten, and mistakes are repeated.
The mistake: Not recording trades, reasoning, and emotional state.
The cost: Inability to identify patterns of success or failure. Without analytics, improvement is random.
The fix: Maintain a trading journal noting entry/exit points, market context, emotions, and results. Over time, this becomes a goldmine of self-knowledge.
You can’t fix what you don’t measure.
12. Blindly Following Others
Social media, Telegram groups, and “expert” calls have created a dangerous herd mentality in trading.
The mistake: Copying trades of others without understanding the logic behind them.
The cost: When trades go wrong — and they often do — followers panic because they lack conviction. Losses multiply due to delayed exits and emotional confusion.
The fix: Learn from others but think independently. Build your own thesis for every trade. Blind faith in “tips” is financial suicide.
Confidence comes from clarity, not consensus.
13. Neglecting the Broader Picture
Focusing only on charts and ignoring macroeconomic factors is another costly error. Economic data, interest rates, and geopolitical events shape price behavior.
The mistake: Overreliance on technicals without considering news or sentiment shifts.
The cost: Unexpected volatility and stop-loss hits during major announcements.
The fix: Combine technical and fundamental awareness. Track calendars for earnings, policy announcements, and macro events.
Markets move because of context, not just candles.
14. Misunderstanding Leverage
Leverage amplifies both profits and losses. Many traders misuse it, seduced by the idea of “fast money.”
The mistake: Using excessive leverage without understanding margin requirements or potential drawdowns.
The cost: A small price move against your position can trigger a margin call or total account wipeout.
The fix: Use leverage cautiously. Consider it a double-edged sword. If your system isn’t consistently profitable, leverage will only accelerate losses.
Leverage doesn’t make you rich — discipline does.
15. Failure to Accept Mistakes
The most expensive mistake of all is not learning from mistakes. Every loss has a lesson, but many traders refuse to confront their errors, blaming the market instead.
The mistake: Denial of responsibility and lack of self-assessment.
The cost: Repeating the same pattern until the account is gone.
The fix: Treat every loss as data, not defeat. Review trades weekly. Identify recurring errors and eliminate them.
In trading, humility pays compound interest.
Conclusion: Every Mistake Has a Price — Learn Before You Pay
Trading mistakes are inevitable — but repeating them is optional. Every poor decision has a financial cost, an emotional cost, and an opportunity cost. What separates successful traders from struggling ones isn’t luck or genius; it’s the willingness to analyze, adapt, and evolve.
Avoiding these common mistakes won’t make you instantly rich, but it will prevent you from going broke — and in trading, that’s the real foundation of success.
Master your risk, control your emotions, plan your trades, and treat every mistake as a tuition fee paid to the market. Over time, those lessons compound — just like profits do.
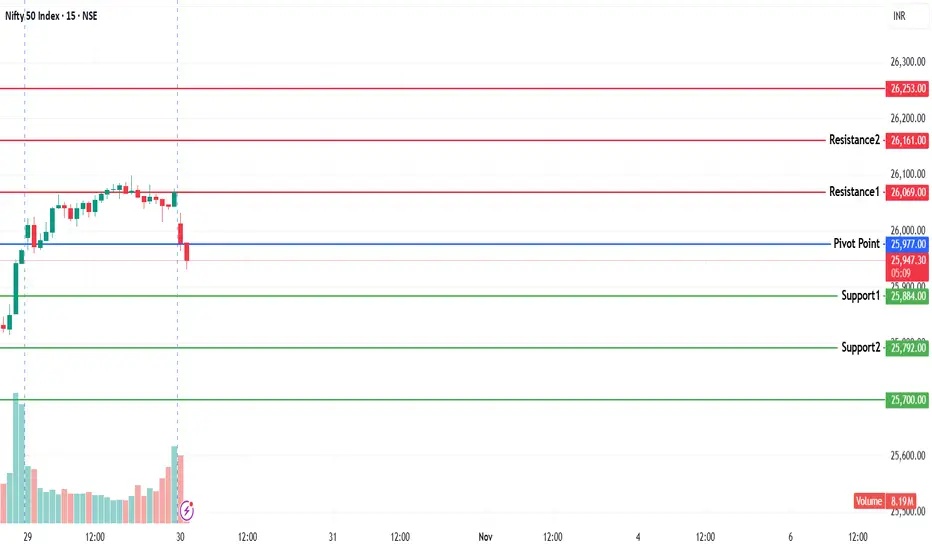
NIFTY KEY LEVELS FOR 30.10.2025NIFTY KEY LEVELS FOR 30.10.2025
Timeframe: 3 Minutes
If the candle stays above the pivot point, it is considered a bullish bias; if it remains below, it indicates a bearish bias. Price may reverse near Resistance 1 or Support 1. If it moves further, the next potential reversal zone is near Resistance 2 or Support 2. If these levels are also broken, we can expect the trend.
When a support or resistance level is broken, it often reverses its role; a broken resistance becomes the new support, and a broken support becomes the new resistance.
If the range(R2-S2) is narrow, the market may become volatile or trend strongly. If the range is wide, the market is more likely to remain sideways
please like and share my idea if you find it helpful
📢 Disclaimer
I am not a SEBI-registered financial adviser.
The information, views, and ideas shared here are purely for educational and informational purposes only. They are not intended as investment advice or a recommendation to buy, sell, or hold any financial instruments.
Please consult with your SEBI-registered financial advisor before making any trading or investment decisions.
Trading and investing in the stock market involves risk, and you should do your own research and analysis. You are solely responsible for any decisions made based on this research.
Update idea
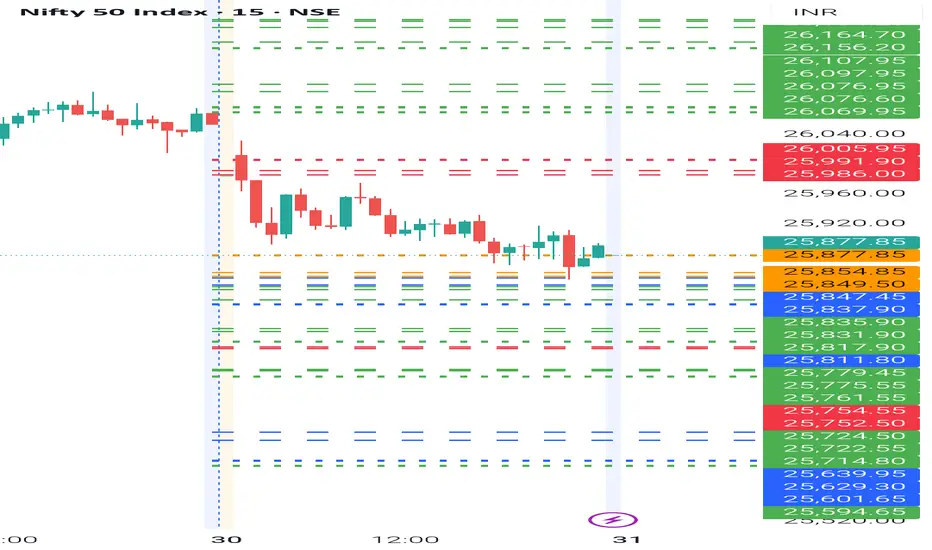
NIFTY Levels for Today
Here are the NIFTY's Levels for intraday (in the image below) today. Based on market movement, these levels can act as support, resistance or both.
Please consider these levels only if there is movement in index and 15m candle sustains at the given levels. The SL (Stop loss) for each BUY trade should be the previous RED candle below the given level. Similarly, the SL (Stop loss) for each SELL trade should be the previous GREEN candle above the given level.
Note: This idea and these levels are only for learning and educational purpose.
Your likes and boosts gives us motivation for continued learning and support.

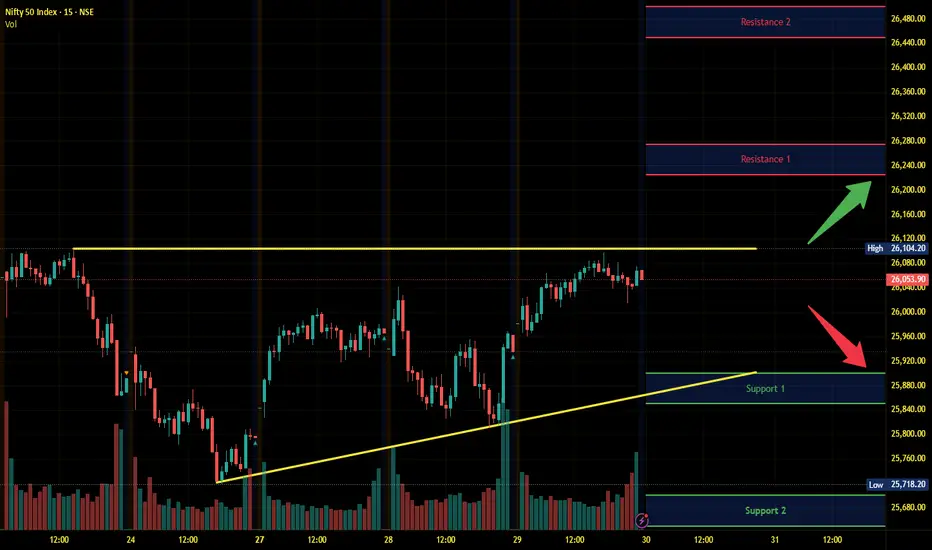
#NIFTY Intraday Support and Resistance Levels - 30/10/2025Nifty is expected to open slightly gap up near the 26,050–26,100 zone, indicating a continuation of positive sentiment seen in the previous sessions. The index has moved out of its recent consolidation phase and is now trading near a key breakout level, suggesting that buyers are gradually regaining control.
If Nifty sustains above 26,100, we could see an upward move toward 26,150, 26,250, and 26,450+ levels. A breakout above 26,250 will confirm strong bullish momentum and could trigger a rally toward 26,450–26,600 in the short term.
On the downside, immediate support lies near 25,950–25,900. A dip below 25,900 might lead to mild profit booking, pulling the index back toward 25,800 and 25,750 levels.
Overall, with a slightly gap up opening, the market sentiment remains positive. Traders should watch for sustained trade above 26,050 for long opportunities while maintaining a trailing stop loss below 25,900 to safeguard gains in case of a pullback.

Remarkable Day Nifty above 26000After 13 months, Nifty has once again closed above 26,000 (last time on 23rd September 2024).
The market now looks poised for an upside move, with the expectation of retesting the all-time high at 26,277 soon.
Resistance: 26,104, 26,277
Support: 25,820

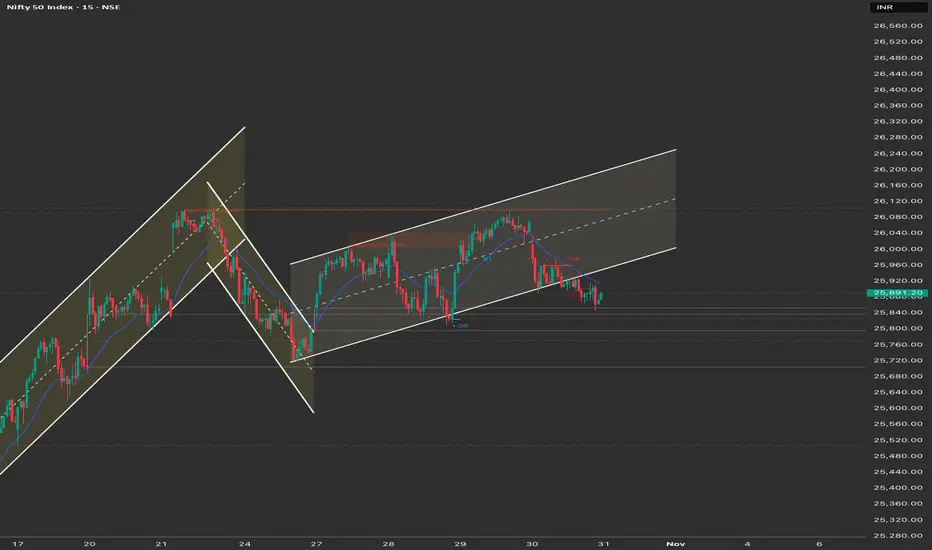
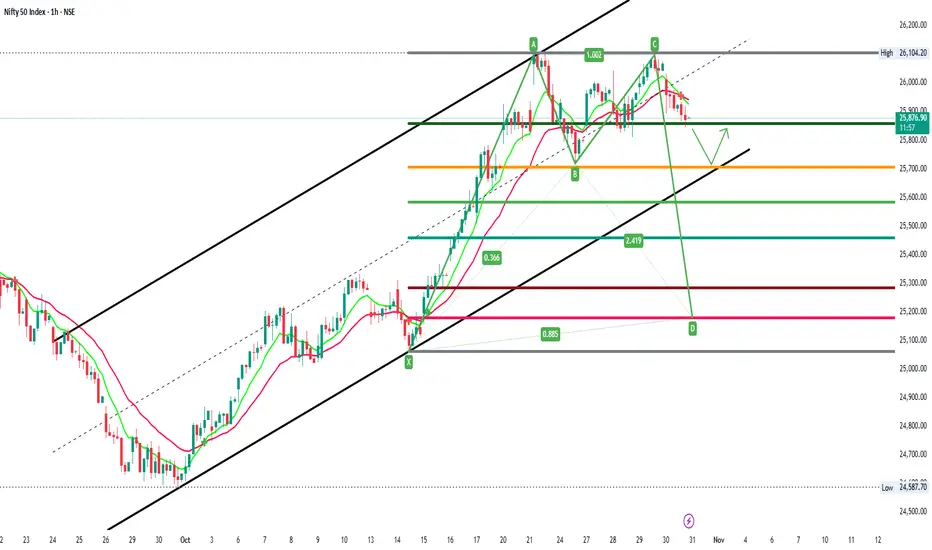
Will only go LONG if weekly candle closes above 26000 level!As we can see NIFTY has shown unidirectional upmove and also managed to close above 26000 level but 2 more days is left to confirm its weekly closing above the resistance level. Till then we stand by our analysis, selling every rise for 25500 keeping stop loss above last swing and high of NIFTY that too closing basis so we must wait patiently to confirm NIFTY's direction keep watching everyone.
Nifty may give sharp move tomorrow! Market is vibrating because of the sudden burst in momentum.
Just buy after the shakeouts — they always reveal the institutional footprints in stocks.
Nifty’s Pivot moved up today even though the index is already stretched from its short-term base.
Also, the Pivot Percentile has been tightening for the last two sessions, which means a strong directional move is developing.
If the index breaks above the 26100 resistance, we’ll likely see new all-time highs.
Support at 26029/25929
But remember — this upmove should be treated as a profit-booking opportunity rather than a place to add fresh longs.
The equity market has been getting stronger for the last two days, and with improving breadth, we’ll see more strong setups forming soon.
The sector that looks best right now is #Energy.
That’s all for the day. Take care and have a profitable tomorrow.
#TrendX #Trading
📊Levels at a glance:
Pivot: 26037
Resistance: 26100 (break = new all-time high)
Support: 26029/25929
Pivot Percentile: Tight (strong move developing)
Bias: Bullish but profit booking advised
Sector to watch: Energy

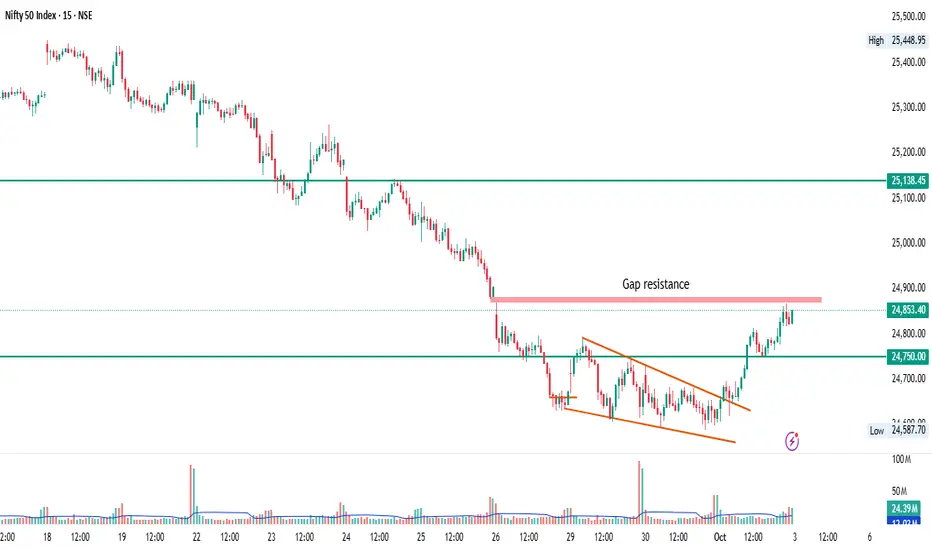
NIFTY 50 – Intraday level 15min TFNIFTY 50 – Gap Resistance Test After Falling Wedge Breakout
Timeframe: 15 min
📌 Key Observations:
Falling wedge pattern formed over the last few sessions, followed by a clean breakout with rising volume.
Price has now rallied toward the gap resistance zone near 24,880–24,900, where supply previously stepped in.
24,750 is acting as immediate support — the level from where the breakout initiated.
Next resistance to watch is 25,138, which aligns with a previous structure zone.
📈 Trading Plan:
✅ Bullish if:
Price sustains above the 24,880–24,900 gap resistance
Then potential upside towards 25,050 / 25,138
⚠️ Caution if:
Price gets rejected at the gap resistance
Watch for pullback retest around 24,750
🔍 Sentiment:
Short-term recovery is in play after a prolonged downtrend, but the current zone is a make-or-break resistance.
NIFTY Intraday Trade Setup For 30 Oct 2025NIFTY Intraday Trade Setup For 30 Oct 2025
Bullish-Above 26110
Invalid-Below 26060
T- 26350
Bearish-Below 25920
Invalid-Above 25970
T- 25690
NIFTY has closed on a bullish note with 0.45% gain today. Index has been consolidating below 26100 since few days. Above 26110 index is all set for a fresh ATH. On a 15 Min candle close above 26110, plan a long for the target of 26345. 25900 zone can be a confluence zone. Plan a short below 25920 on 15 Min candle close, 25690 will be target.
In case of a big gap up/down, wait till 10 o'clock and mark the high and low of the trading range (5MIN). Trade on this range breakout.
==========
I am Not SEBI Registered
This is my personal analysis for my personal trading. Kindly consult your financial advisor before taking any actions based on this.

Nifty Structure Analysis & Trade Plan: 30th OctoberBased on the charts and the market's performance on Tuesday, October 29, the Nifty extended its strong upward rally, closing above the critical 26,000 psychological mark. The underlying structure remains firmly bullish, despite minor profit-booking at the session's high.
Detailed Market Structure Breakdown
4-Hour Chart (Macro Trend)
Structure: The Nifty is in a Strong Bullish Momentum phase. The price is trading within a steep ascending channel, and the strong close on Tuesday (Oct 29th) has confirmed the continuation of the short-term uptrend. The market has taken out immediate liquidity and is poised to challenge the all-time high zone.
Key Levels:
Major Supply (Resistance): 26,100 - 26,200. This area is the immediate hurdle and aligns with the upper boundary of the steep channel and the recent swing high. A decisive breakout above 26,200 would open the path to the All-Time High of 26,277.
Major Demand (Support): 25,850 - 25,900. This area, which includes the lower channel trendline and the strong Order Block (OB) from the recent rally, is the must-hold zone for the short-term uptrend.
Outlook: The short-term bias is Strongly Bullish. The market has the potential to reach its all-time high soon.
1-Hour Chart (Intermediate View)
Structure: The 1H chart shows a clear continuation of structure (BOS) on the upside. The index is trading well above its key moving averages, keeping the bullish bias intact. The formation is a steep, reliable uptrend channel.
Key Levels:
Immediate Resistance: 26,100 (Upper channel resistance).
Immediate Support: 25,900 (Lower channel boundary/key support).
15-Minute Chart (Intraday View)
Structure: The 15M chart confirms a high-momentum close. The price has been making higher highs and higher lows within the ascending channel. The momentum indicators remain supportive of further upside.
Key Levels:
Intraday Supply: 26,100 (Intraday high target).
Intraday Demand: 25,960 (Recent consolidation support).
Outlook: Aggressively Bullish.
📈 Structure Analysis & Trade Plan: 30th October
Market Outlook: The Nifty is bullish and poised to challenge the All-Time High, with strong support at 25,900. The US Fed decision is a key global event today, which may introduce volatility.
Bullish Scenario (Primary Plan: Continuation/Breakout)
Justification: The strong technical structure and close above 26,000 favor continuation.
Entry: Long entry on a decisive break and 15-minute candle close above 26,100. Alternatively, look for a dip entry near 25,900 - 25,940 (the key support zone).
Stop Loss (SL): Place a stop loss below 25,850 (below the immediate major support).
Targets:
T1: 26,180 (Geojit target/Extension).
T2: 26,277 (All-Time High).
T3: 26,300 (Major supply/resistance band).
Bearish Scenario (Counter-Trend/Reversal)
Justification: Only valid if the rally fails dramatically, possibly due to a hawkish Fed statement or strong profit-booking.
Trigger: A sustained break and 1-hour close back below 25,850 (breaking the channel support).
Entry: Short entry below 25,850.
Stop Loss (SL): Above 26,000.
Targets:
T1: 25,700 (Major support/FVG).
T2: 25,600 (Strong weekly support).
Key Levels for Observation:
Immediate Decision Point: 25,900 - 26,100 zone.
Bullish Confirmation: Sustained trade above 26,100.
Bearish Warning: A move below 25,900.
Line in the Sand: 25,850. Below this level, the short-term bullish bias is nullified.
Crucial Event: US Federal Reserve policy meeting outcome (post-market hours, will affect volatility).
Key levels for nifty 30.10.2025Marked zones will act as reversals or breakouts. Take entry in 5 minutes chart or 3 minutes chart as these levels are drawn using 15 minutes time frame.

Nifty 50: 26,100 Rejection →15-min FVG Discount Long Setup Session Recap:
Nifty broke above 26,040 and rallied toward 26,100, where it faced rejection from a key support-turned-resistance zone. Price is now likely to consolidate between 25,950–26,100 before the next directional move.
What I’m Watching for 30 Oct 🔍
I’ll be watching for the market to dip into the discount area of the last swing — ideally near the 15-min FVG zone — for a possible long setup if we see strong rejection and buyer momentum.
💡 Bias: Neutral to Bullish
📍 Key Zones: 25,950–26,100 (range) | 15-min FVG (watch for reaction)
⚡ Plan: Wait for confirmation before entering long from discount area
Sharing my personal market view — not financial advice.

Nifty Intraday Analysis for 29th October 2025NSE:NIFTY
Index has resistance near 26150 – 26200 range and if index crosses and sustains above this level then may reach near 26350 – 26400 range.
Nifty has immediate support near 25750 – 25700 range and if this support is broken then index may tank near 25550 – 25500 range.

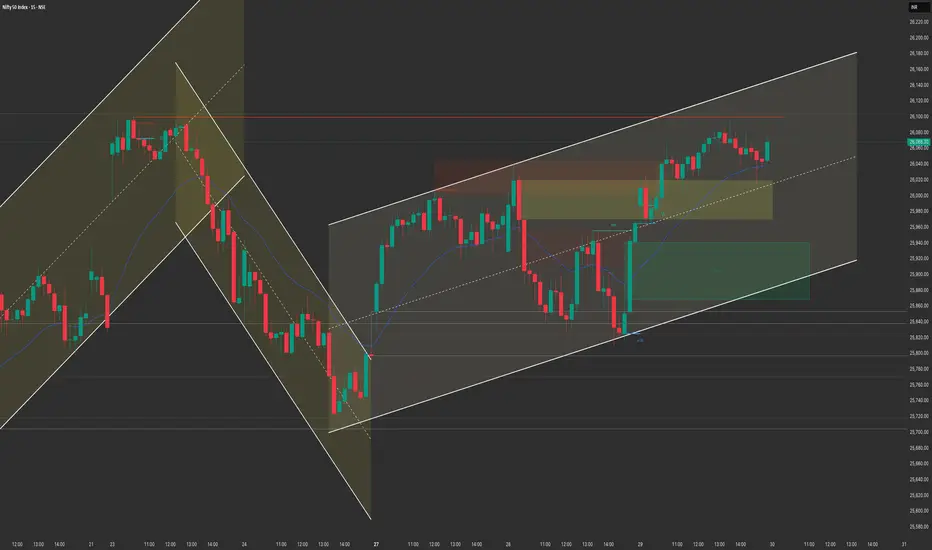
Nifty 50 Breakout & Retest Done – Eyes on 27,000 next!📈 NIFTY 50 – Multi-Level Breakout & Retest Complete | New All-Time High (27,000) on the Horizon
🧠 Educational Analysis
The NIFTY 50 Index (NSE: NIFTY) has completed a multi-level breakout after months of consolidation and resistance rejections.
The index successfully retested the breakout zone and held firm above the rising trendline support (green line) — a classic sign of bullish continuation.
The structure now points toward a potential new all-time high (ATH) as momentum strengthens across key sectors.
🔍 Technical Highlights
🟩 Green Line: Represents trendline support, showing higher lows formation.
🔴 Red Channel: Denotes prior supply zone where price faced rejection; now turned into support.
💬 Label - “MULTILEVEL BREAKOUT DONE”: Confirms breakout above multiple resistance layers.
💬 Label - “SUPPORT RETESTING DONE”: Indicates successful retest and continuation setup.
📈 Projection: Price structure suggests potential rally toward 26,800–27,000 in the short to medium term if momentum sustains.
📘 Educational Purpose
This chart is shared solely for educational analysis, to demonstrate how multi-level breakouts combined with support retests can indicate trend continuation.
The idea highlights price structure, breakout confirmation, and support validation — essential components in trend-following technical setups.
⚠️ Disclaimer
This post is not investment advice.
It is shared purely for learning and educational purposes to explain breakout–retest setups and technical confluence zones.
Please conduct your own analysis or consult a financial advisor before trading or investing.
🏷️ Hashtags
#Nifty #Nifty50 #NiftyAnalysis #Breakout #Retest #TrendlineSupport #TechnicalAnalysis #PriceAction #StockTech #TradingView #SwingTrading #EducationalIdea #NSE #MarketOutlook
