Nifty Trading Strategy for 28th October 2025📊 NIFTY INTRADAY SETUP
🔼 BUY SETUP
Entry: Buy above the high of the 15-min candle that closes above 26,040
🎯 Targets:
🥇 26,070
🥈 26,100
🥉 26,150
🛑 Stop Loss: Below the 15-min candle low
🔽 SELL SETUP
Entry: Sell below the low of the 15-min candle that closes below 25,860
🎯 Targets:
🥇 25,825
🥈 25,790
🥉 25,750
🛑 Stop Loss: Above the 15-min candle high
⚙️ Trading Notes
Wait for 15-min candle close confirmation before entering any trade.
Follow risk management: Never risk more than 1–2% of your capital per trade.
Avoid trading during high volatility (news release, RBI policy, etc.).
⚠️ Disclaimer
🚫 I am not a SEBI-registered analyst.
This setup is for educational and study purposes only.
Please consult your financial advisor before taking any trading decisions.
Trading in the stock market involves risk — trade at your own discretion.
Trade ideas

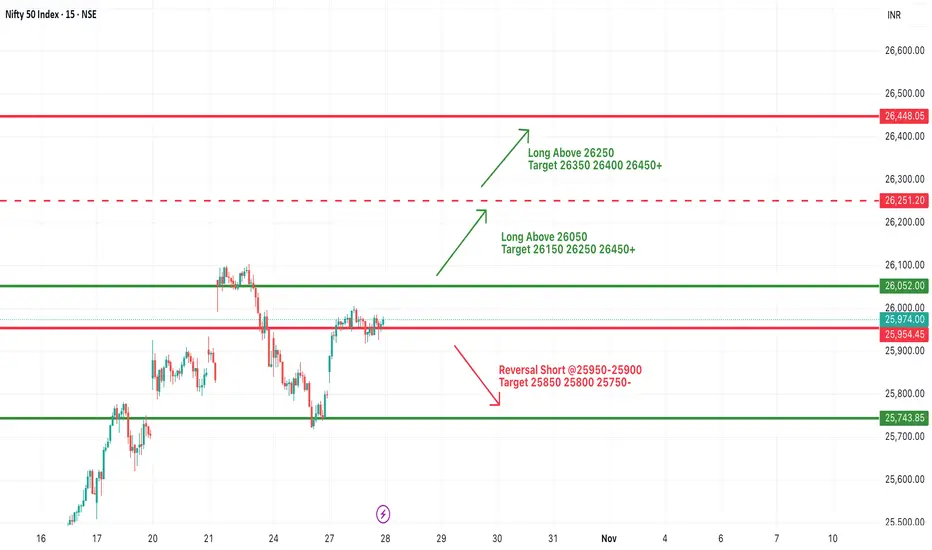
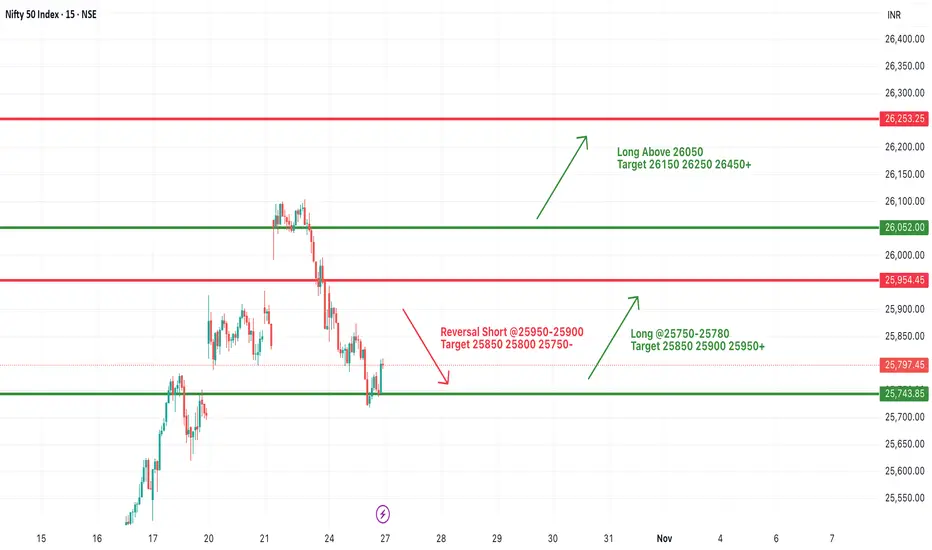
#NIFTY Intraday Support and Resistance Levels - 28/10/2025Nifty is expected to open with a gap up above the 26,050 level, indicating bullish momentum carried over from the previous session. The index has reclaimed a crucial resistance zone and now stands poised for a potential breakout continuation if buying pressure sustains after the opening bell.
If Nifty holds above 26,050, we could see further upside toward 26,150, 26,250, and 26,450+ levels. A breakout above 26,250 may accelerate momentum and push the index toward 26,450–26,600, confirming short-term bullish strength.
On the downside, immediate support lies around 25,950–25,900. A fall below 25,900 may trigger a minor pullback toward 25,800 and 25,750 zones.
Overall, the gap up opening above 26,050 reflects positive sentiment, and as long as Nifty sustains above this level, the trend remains bullish. Traders should focus on trend-following entries on dips and maintain a trailing stop loss below 25,900 to protect profits in case of volatility.
/Nifty Expiry Analysis - /Nifty expiry analysis - Market moved up and stayed sideways afterwards. If we need to trade then look for CE trades as we are in uptrend, do not look for PE until a resistance zone is broken with minutes candle. On every dip try to buy. As per options analysis we have good premiums left on both sides so we can see good movement on both sides.
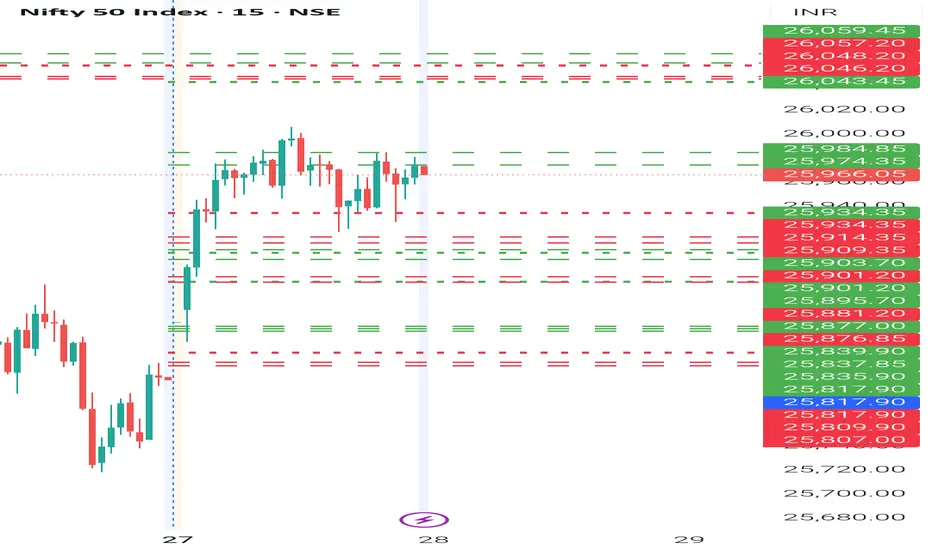
NIFTY- Intraday Levels - 28th October 2025Monthly expire special levels
If NIFTY sustain above 25974/84 above this bullish then around 26043/67 above this more bullish 26161/99 then above this wait
If NIFTY sustain below 25934 below this bearish then around 25914/09 strong level if sustain below this more bearish then 25903/25895 then 25881/76 then 25839/35 or 25817/07 below this wait
Consider some buffer points in above levels.
Please do your due diligence before trading or investment.
**Disclaimer -
I am not a SEBI registered analyst or advisor. I does not represent or endorse the accuracy or reliability of any information, conversation, or content. Stock trading is inherently risky and the users agree to assume complete and full responsibility for the outcomes of all trading decisions that they make, including but not limited to loss of capital. None of these communications should be construed as an offer to buy or sell securities, nor advice to do so. The users understands and acknowledges that there is a very high risk involved in trading securities. By using this information, the user agrees that use of this information is entirely at their own risk.
Thank you.
NIFTY Levels for Today
Here are the NIFTY's Levels for intraday (in the image below) today. Based on market movement, these levels can act as support, resistance or both.
Please consider these levels only if there is movement in index and 15m candle sustains at the given levels. The SL (Stop loss) for each BUY trade should be the previous RED candle below the given level. Similarly, the SL (Stop loss) for each SELL trade should be the previous GREEN candle above the given level.
Note: This idea and these levels are only for learning and educational purpose.
Your likes and boosts gives us motivation for continued learning and support.

Will only gp long if sustains above 26000 level!As we can see NIFTY recovered sharply but managed to close below 26000 which is a strong supply zone. Moreover, we analysed in our previous post that we may see short term retracement towards upside and we did see that today. Now, we will only think of going long if sustains above 26000-26100 level until that every rise can be shorted for 25500 so plan your trades accordingly and keep watching everyone
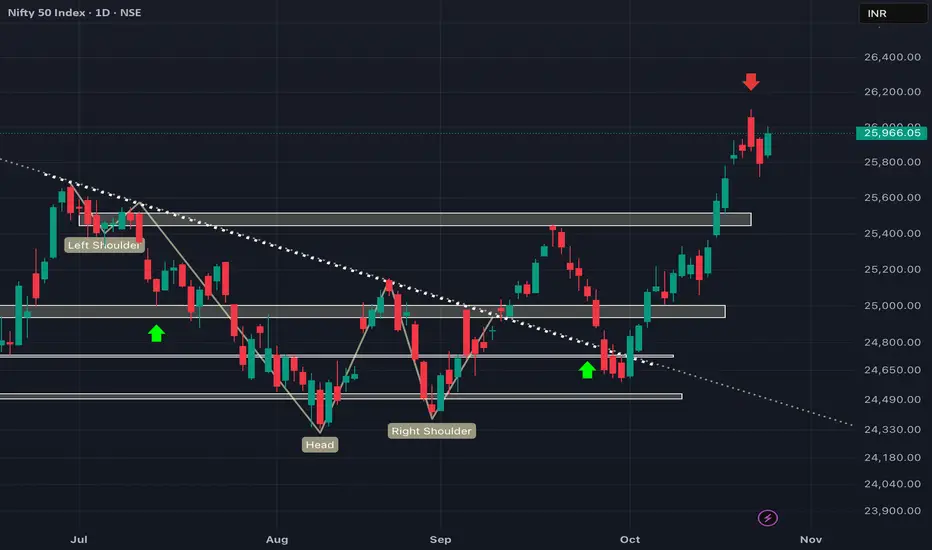
NIFTY 50 WEEKLY TIME FRAME-CUP AND HANDLE PATTERNIt looks like you are analyzing a Cup and Handle pattern on a Weekly Time Frame and referencing specific price points:
1st TR: All Time High (ATH)
2nd TR: 28600
3rd TR: 29200
A Cup and Handle pattern is a bullish continuation pattern in technical analysis.
1st TR (ATH): This is most likely the Neckline or Resistance Level of the pattern. A move and sustained close above this All Time High (ATH) would confirm the bullish breakout from the handle.
Action: Breakout confirmation is a strong buy signal.
2nd TR (28600): This price point could represent a few things, depending on the chart:
The low of the Handle (acting as a crucial support level).
A significant intermediate support within the Handle's formation.
A Stop-Loss level for a trade (e.g., placing the stop below the handle's low).
3rd TR (29200): This is likely an Initial Price Target following the breakout.
It would be derived from the traditional measured move calculation: Breakout Level + (Depth of the Cup). Since 29200 is close to the ATH (1st TR), it might represent a conservative or initial short-term target, or a key resistance level on the way to the full measured move.
Disclaimer: This information is for educational and informational purposes only and is based on common technical analysis principles. It is not financial or investment advice. Technical patterns can fail, and trading involves substantial risk of loss. Always conduct your own research and consult with a qualified financial professional before making any investment decisions.

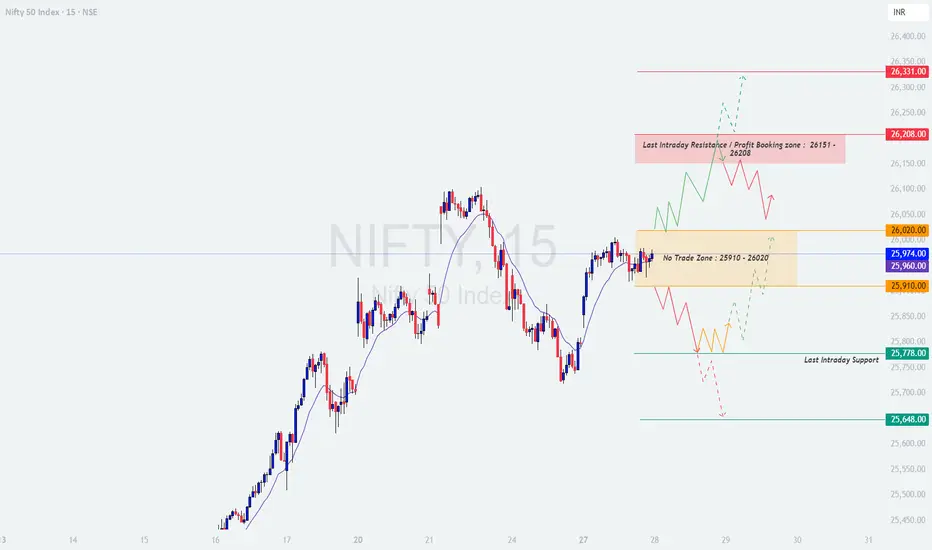
NIFTY : Trading levels and Plan for 28-Oct-2025 (Educational)NIFTY TRADING PLAN – 28-Oct-2025
📊 Nifty closed around 25,974, hovering within the No Trade Zone (25,910 – 26,020) after a choppy session. The index is showing signs of indecision as buyers defend lower supports near 25,778, while sellers remain active near the upper resistance zone around 26,151 – 26,208. Tomorrow’s move will largely depend on the opening tone and how prices react to the key levels outlined below.
🟩 SCENARIO 1: GAP-UP OPENING (100+ Points Above 26,020)
If Nifty opens above 26,020, it will immediately enter the Last Intraday Resistance / Profit Booking Zone (26,151 – 26,208).
Watch for quick momentum toward 26,151 — this is a critical intraday level where profit booking can emerge.
Sustaining above 26,208 may trigger fresh long entries, extending the move toward 26,331.
Failure to hold above 26,151 could bring the index back to retest the 26,020 breakout level — a healthy pullback zone for intraday traders.
A sustained break below 26,020 will indicate a failed gap-up breakout, turning bias neutral to mildly bearish.
🧠 Educational Insight:
Gap-ups often reflect overnight optimism, but smart traders wait for confirmation candles before chasing prices. The first 15–30 minutes are crucial to determine if the opening gap will sustain or fade.
⚙️ Plan of Action:
→ Let the first candle close; if Nifty holds above 26,151, long entries can be considered with targets toward 26,331 and stop-loss below 26,020.
🟨 SCENARIO 2: FLAT OPENING (Between 25,910 – 26,020)
A flat start within the No Trade Zone may lead to range-bound and confusing price action early in the session.
Bulls need a clean breakout above 26,020 to shift momentum back toward 26,151 – 26,208.
Bears will regain short-term control if prices slip below 25,910, potentially driving the index toward 25,778.
Avoid trading within this zone as whipsaws are likely due to equal buying and selling pressure.
🧠 Educational Insight:
When markets open flat within a “No Trade Zone,” patience is key. Many traders lose money trying to predict breakouts that never confirm. Let the price show strength before taking a stance.
⚙️ Plan of Action:
→ Wait for a decisive hourly close beyond 26,020 (for long) or below 25,910 (for short). Trade only post-confirmation with strict stop-loss rules.
🟥 SCENARIO 3: GAP-DOWN OPENING (100+ Points Below 25,910)
If Nifty opens below 25,910, it will shift short-term sentiment bearish, especially if opening occurs near 25,778 or below.
The first support zone lies around 25,778 — expect a possible technical bounce here.
If this support fails, the next target for sellers will be 25,648, where a temporary base could form.
Only a recovery and sustained close above 25,910 would negate the bearish pressure.
🧠 Educational Insight:
Gap-down openings often test traders’ emotions — avoid panic selling at open. Reversal candles around 25,778 can provide high R:R setups for quick intraday longs.
⚙️ Plan of Action:
→ Consider short positions below 25,778 with stop-loss above 25,910. For a safer play, wait for rejection candles near 25,910 before entering any directional trade.
💡 RISK MANAGEMENT TIPS FOR OPTIONS TRADERS
Avoid entering during the first 15–30 minutes after market opens — let volatility settle.
Always define your stop-loss — never risk more than 1–2% of total capital in a single trade.
Prefer deep ITM options for directional plays to reduce time decay.
Avoid trading when price remains in the “No Trade Zone”; capital preservation is priority.
Trail profits dynamically — once your trade achieves 1:1 R:R, secure partial gains.
📘 SUMMARY & CONCLUSION
Key Resistance Levels: 26,020 → 26,151 → 26,208 → 26,331
Key Support Levels: 25,910 → 25,778 → 25,648
No Trade Zone: 25,910 – 26,020
🔹 The bias remains neutral within the range, but momentum can quickly shift beyond 26,020 or below 25,910.
🔹 Buy on dips near 25,778 if support holds, and sell on rises near 26,208 if rejection patterns appear.
🔹 Stay flexible — the trend confirmation will only emerge after a decisive breakout beyond the defined zones.
⚠️ Disclaimer: I am not a SEBI-registered analyst. This analysis is purely for educational and informational purposes. Please do your own research or consult a certified financial advisor before taking any trading decision.
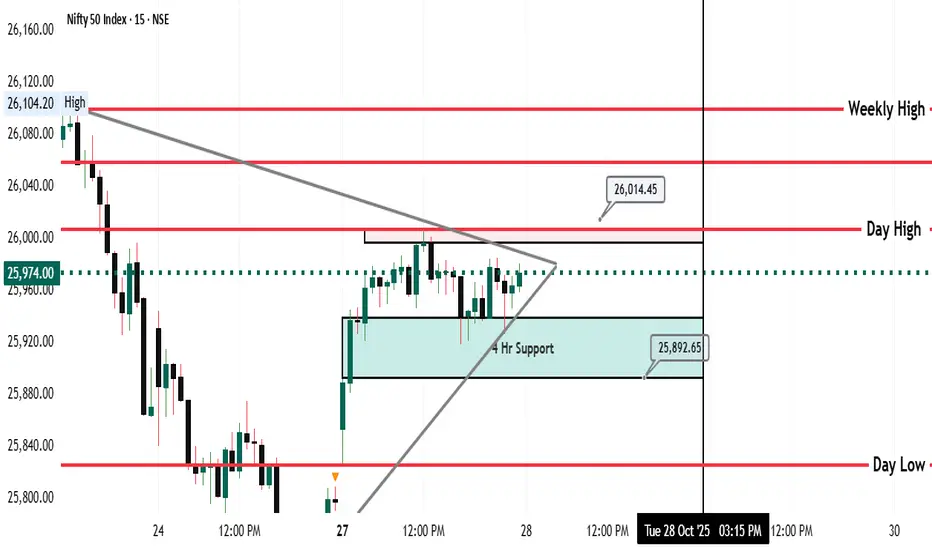
Nifty 50 Analysis | 28-10-2025 Today, Nifty traded in a narrow 26,000 – 25,920 range, showing clear liquidity buildup on both sides.
Currently, price is also tapped into a 1-hour FVG zone around 26,000, which adds confluence for potential reaction.
Two Possible Scenarios:
1. Bullish Bias: A strong break and hold above 26,000 can trigger liquidity sweep upside, opening room for continuation toward higher levels.
2. Bearish Bias: If price rejects the 26,000 1-hour FVG and fails to break structure, we may see a retracement toward the 25,850 gap zone before any upside move.
Trade Plan:
Will monitor price action closely around 26,000 (1-hr FVG) and 25,850 (gap zone) for confirmation.
No directional bias until structure shift or clear liquidity break is visible.
Based on Price Action & SMC Concepts — Not Financial Advice.

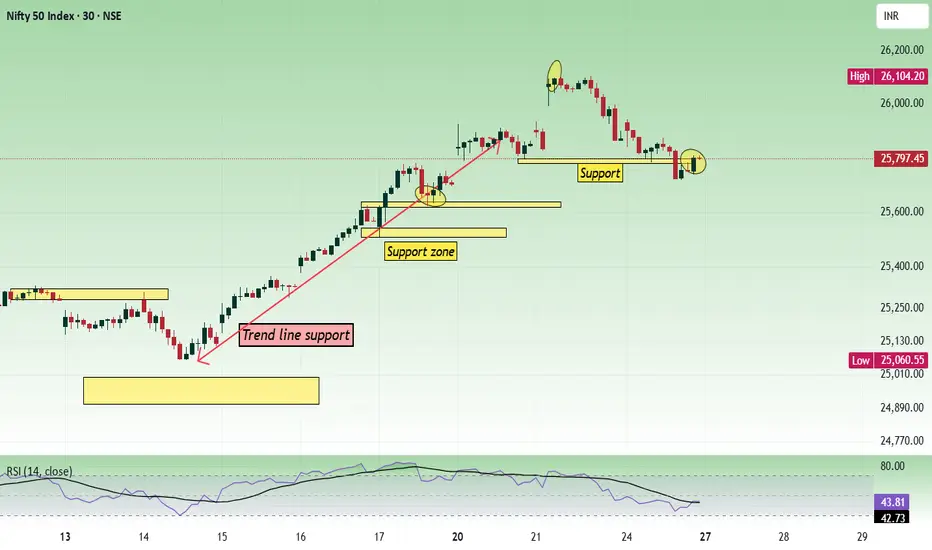
Nifty 50 – Key Levels & Trade Setups | 27 Oct 2025Overview
The NIFTY 50 index concluded the previous week with an indecisive candle, reflecting ongoing market uncertainty. Notably, the price action has successfully filled the gap that was left open on October 20, 2025. As we approach the market open on October 27, 2025, I will be closely monitoring the initial price behavior to gauge directional bias.
Current Technical Scenario
The market is currently positioned within the 25,830–25,800 range coinciding with a 3-minute FVG, which could serve as a pivotal zone for short-term movements. From current levels, there is potential for a downside extension toward the 25,670.
Key Levels to Watch
Resistance : Monitor for breakout above the 25,875 level.
Support : 25,700, followed by 25,670 (major).
I will closely monitor market reactions at these levels during the trading session on October 27, 2025, and, if possible, provide real-time updates post-market open at 9:15 AM IST based on live price developments. This analysis is for educational purposes only and not financial advice—always conduct your own due diligence and manage risk appropriately.

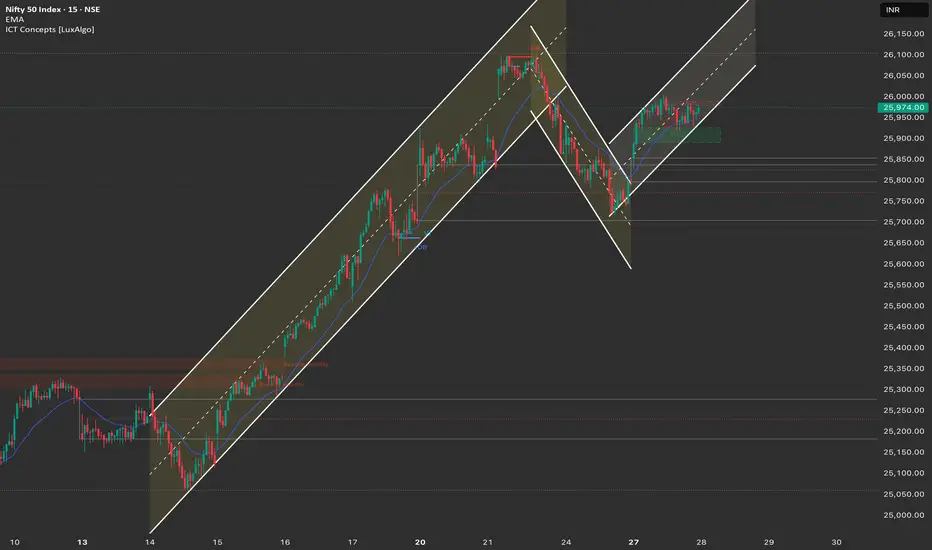
Nifty Structure Analysis & Trade Plan: 28th October4-Hour Chart (Macro Trend)
Structure: The Nifty is back in its Bullish Momentum phase. The price successfully found strong buying interest at the lower trendline of the steep ascending channel (the point of the rejection on Friday's chart). The current price action indicates a successful retest and bounce, reversing the corrective sentiment.
Key Levels:
Major Supply (Resistance): 26,100 - 26,200. This area encompasses the recent high and is the critical hurdle. A decisive breakout above 26,100 would target the ATH of 26,277.
Major Demand (Support): 25,600 - 25,750. This area, which includes the lower channel trendline and a strong FVG (Fair Value Gap), is the must-hold level for the overall bullish trend.
Outlook: The bias is Strongly Bullish. The market is poised to re-challenge the 26,000 - 26,100 resistance band.
1-Hour Chart (Intermediate View)
Structure: The 1H chart shows a clear Break of Structure (MSS) back to the upside, following the successful defense of the lower channel boundary. The price has reclaimed the 9-period EMA and is now trading in a fresh, steep ascending channel.
Key Levels:
Immediate Resistance: 26,000 (Psychological mark and immediate high).
Immediate Support: 25,850 (Recent consolidation support/lower channel boundary).
15-Minute Chart (Intraday View)
Structure: The 15M chart confirms the reversal, showing a V-shaped recovery from the Friday low. The price is currently trading at the upper end of the daily range, setting up for a strong open.
Key Levels:
Intraday Supply: 26,000 - 26,050.
Intraday Demand: 25,850 - 25,900.
Outlook: Aggressively Bullish.
📈 Structure Analysis & Trade Plan: 28th October
Market Outlook: Nifty has shown strong resilience, negating Friday's bearishness. The primary strategy will be to buy on continuation/dips to capitalize on the resumed bullish momentum.
Bullish Scenario (Primary Plan: Continuation)
Justification: The strong V-shaped recovery and the successful defense of the macro support favor continuation toward the ATH.
Entry: Long entry on a decisive break and 15-minute candle close above 26,000. Alternatively, look for a dip entry near 25,850 - 25,900 (the immediate support zone).
Stop Loss (SL): Place a stop loss below 25,750 (below the key intraday swing low).
Targets:
T1: 26,100 (Recent swing high).
T2: 26,277 (All-Time High).
Bearish Scenario (Counter-Trend/Reversal)
Justification: High-risk. Only valid if the market fails aggressively at the 26,000 mark.
Trigger: A sustained break and 1-hour close back below 25,800.
Entry: Short entry below 25,800.
Stop Loss (SL): Above 25,950.
Targets:
T1: 25,650 (Lower channel support/FVG).
T2: 25,500 (Major weekly support).
Key Levels for Observation:
Immediate Decision Point: 25,900 - 26,000 zone.
Bullish Confirmation: Sustained trade above 26,000.
Bearish Warning: A move below 25,800.
Line in the Sand: 25,750. Below this level, the short-term bullish bias is nullified.
Nifty Intraday Analysis for 27th October 2025NSE:NIFTY
Index has resistance near 25950 – 26000 range and if index crosses and sustains above this level then may reach near 26200 – 26250 range.
Nifty has immediate support near 25600 – 25550 range and if this support is broken then index may tank near 25400 – 25350 range.
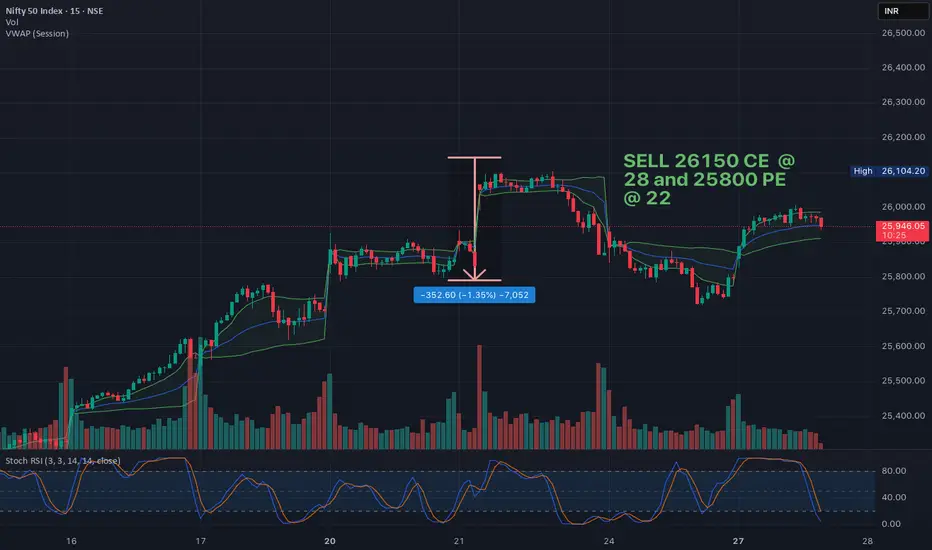
Nifty 28 Oct StrangleSell Nifty 26150 CE at 28 and 25800 Pe at 22. Combined premium 48 Target Zero
Hedge by buying CE worth 11 and PE worth 8
Looking at the current congestion and psychological resistance at 26000 I feel both will go to zero however the chances of downside are strong and a whiplash is often seen on the day of the expiry, so best to hedge with option buying
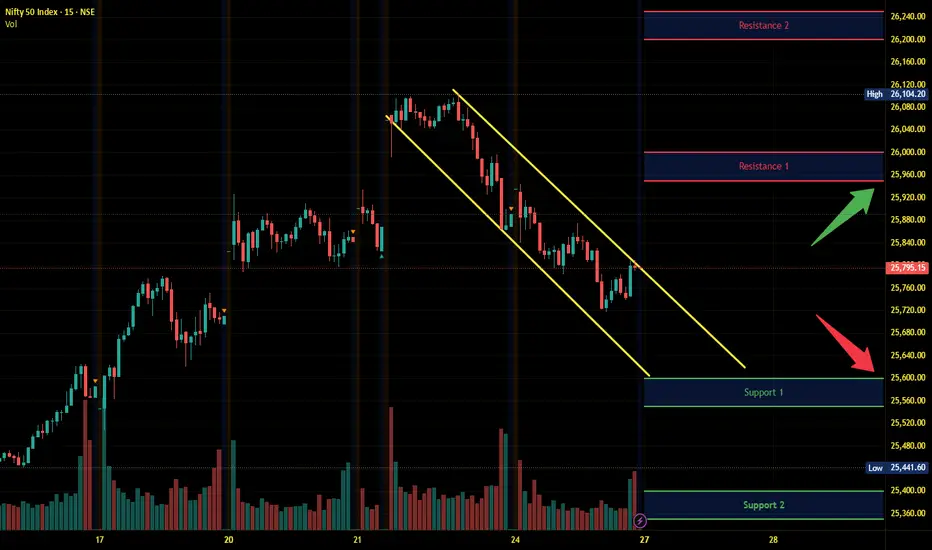
NIFTY KEY LEVELS FOR 27.10.2025NIFTY KEY LEVELS FOR 27.10.2025
Timeframe: 3 Minutes
If the candle stays above the pivot point, it is considered a bullish bias; if it remains below, it indicates a bearish bias. Price may reverse near Resistance 1 or Support 1. If it moves further, the next potential reversal zone is near Resistance 2 or Support 2. If these levels are also broken, we can expect the trend.
When a support or resistance level is broken, it often reverses its role; a broken resistance becomes the new support, and a broken support becomes the new resistance.
If the range(R2-S2) is narrow, the market may become volatile or trend strongly. If the range is wide, the market is more likely to remain sideways
please like and share my idea if you find it helpful
📢 Disclaimer
I am not a SEBI-registered financial adviser.
The information, views, and ideas shared here are purely for educational and informational purposes only. They are not intended as investment advice or a recommendation to buy, sell, or hold any financial instruments.
Please consult with your SEBI-registered financial advisor before making any trading or investment decisions.
Trading and investing in the stock market involves risk, and you should do your own research and analysis. You are solely responsible for any decisions made based on this research.

Nifty - Weekly analysis Oct 27 to Oct 31The price faced resistance at the 26100 - 26120 zone and fall down. Important support levels are 25600 and 25800. 25500 is a psychological level.
If the price opens flat, buy above 25820 with the stop loss of 25760 for the targets 25860, 25900, 25960, 26020, 26080, 26120 and 26180.
Sell below 25700 with the stop loss of 25760 for the targets 25640, 25600, 25560, 25520, 25480 and 25420.
We are having nearby support levels, namely 25500, 25600, and 25800. The price can change direction and become volatile in that area.
Always do your analysis before taking any trade.
NIFTY Levels for Today
Here are the NIFTY's Levels for intraday (in the image below) today. Based on market movement, these levels can act as support, resistance or both.
Please consider these levels only if there is movement in index and 15m candle sustains at the given levels. The SL (Stop loss) for each BUY trade should be the previous RED candle below the given level. Similarly, the SL (Stop loss) for each SELL trade should be the previous GREEN candle above the given level.
Note: This idea and these levels are only for learning and educational purpose.
Your likes and boosts gives us motivation for continued learning and support.
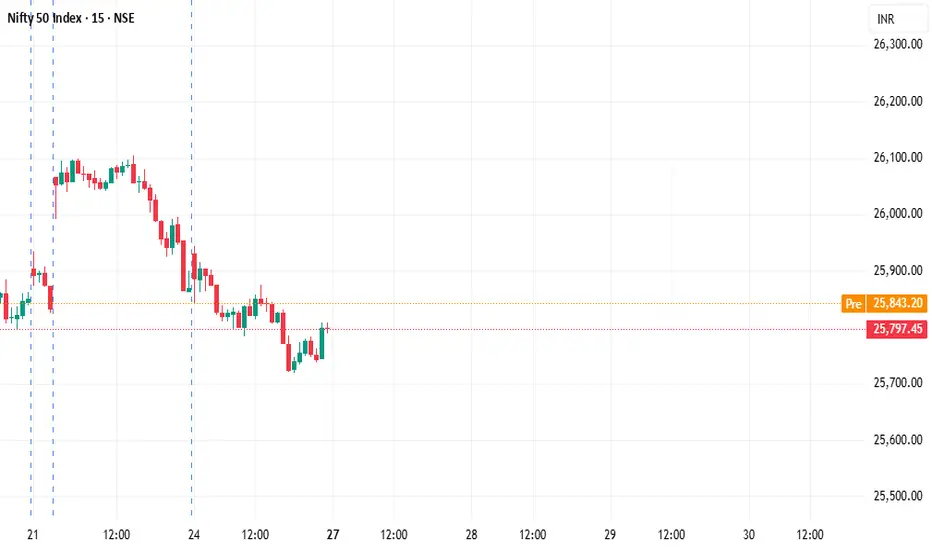
Daily Analysis Nifty: 27/10/25A quick daily analysis on Nifty50.
Gift Nifty is trading above the last close of the Nifty50 session, so we are expecting a good opening today.
25860-25850 will be intraday support; if breached, the gap will be filled, if any.

#NIFTY Intraday Support and Resistance Levels - 27/10/2025Nifty is expected to open flat near the 25,780–25,800 zone, showing signs of early stabilization after the recent decline. The market continues to trade within a consolidation range, and today’s session will be crucial to determine if a short-term reversal or continuation of the downtrend unfolds.
If Nifty holds above 25,780–25,800, we could see an upward move toward 25,850, 25,900, and 25,950+ levels. Sustaining above 25,950 may attract buying interest and extend the rally toward 26,050 and 26,150 zones.
On the downside, immediate support lies near 25,750–25,700. A breakdown below this zone could invite fresh selling pressure, dragging the index toward 25,600 and 25,500 levels.
Overall, a flat opening suggests a neutral start with balanced sentiment. Traders should focus on 25,780 as the pivot level, waiting for a clear breakout or breakdown before entering. Maintaining tight stop losses and booking partial profits near key resistance levels is advisable in this range-bound market.
NIFTY Analysis 27 october 2025 ,Daily Morning update at 9 amNifty may open near 25866 and move sideways above12ema
Buy above 25880 , Targets 25902 and25945
Sell below 25756, Targets 25700 and 25643

24 Oct 2025 - Happy Diwali Uptrend coming to an end? PostMortem Nifty Stance Bullish 🐂
Nifty has been in a bullish stance since the 3rd of October 2025, and we have amassed total gains of 960pts so far. If you have not made money this month, there is something wrong with your strategy, because this was the easiest month in the last 3 or 4 years to make money. The reason is that we have had an unchecked, one-way journey with nil reversal or choppiness.
If you were an option seller, you might have lost money, as the implied volatility (VIX) was at its all-time low, and the quick surge in the underlying (Nifty) would have taken out your stop losses. If you had not covered your shorts, your losses would have widened. As the count of speculators has gone down, it's hard to guess it from X, as very few people are sharing P&L screenshots these days.
Coming back to our EMA crossover strategy, we are looking at 960+ points of unrealized gains. At one point, the gains exceeded 1,250+, all thanks to Trump's tweets indicating that Indian tariffs may be reduced to 15% from the current 50%. Our technical analysis is no match for his tweets, and the only way to protect ourselves is to use a fully hedged credit/debit spread instead of naked longs or shorts.
From the chart, you can see that the faster EMA (orange line) is dipping and could cross the blue line on Monday if we maintain a narrow ATR of 100 points or keep falling. We have the monthly expiry coming Tuesday, and it could be a flatter expiry, as we have already moved a lot on price in this series. If we fall on Tuesday, I would be very excited to play the Sensex expiry on Thursday as well.
The support levels for Nifty are 25681, 25219, and 25003 (hoping we don't fall that much). The resistance is faint at 25906, breaching which could take us to the ATHs soon.
---
If you liked this article, consider sharing it with someone who could benefit from this.

NIFTY : Trading levels and Plan for 27-Oct-2025 (educational)📘 NIFTY TRADING PLAN – 27-Oct-2025
📊 Timeframe: 15-Min | Analysis by LiveTradingBox
📈 Index Close: 25,797.45 (−0.01%)
🧭 Key Reference Levels
🟥 Last Intraday Resistance: 26,020
🟧 Opening Resistance: 25,910
🟨 Opening Support / Resistance Zone: 25,714 – 25,758
🟩 Last Intraday Support Zone: 25,553 – 25,581
🚀 Scenario 1: Gap-Up Opening (100+ Points Above Previous Close)
If Nifty opens near or above 25,900–25,950, it enters the Opening Resistance Zone. This area has repeatedly attracted sellers in the recent sessions. A gap-up may therefore test the patience of both bulls and bears as traders assess whether the move is sustainable or just another reaction to short-covering.
If Nifty sustains above 25,910 for 15–30 minutes with supportive volume, a momentum extension toward 26,020 and potentially 26,150 could unfold.
However, if the index fails to hold above 25,910, profit booking may drag prices back to the 25,758–25,714 zone.
Aggressive buyers should wait for a retest near 25,758 before entering, as this level could provide better risk/reward structure.
Only a sustained break above 26,020 with hourly candle confirmation may invite positional longs aiming toward 26,150+.
🟢 Educational Tip: After strong gap-up openings, avoid chasing the price in the first few candles. Wait for a base-building or retest setup to confirm market intent — remember, the first 15–30 minutes often define the trap zone.
⚖️ Scenario 2: Flat Opening Around 25,780 – 25,820
A flat start around the current closing levels suggests market indecision. The Opening Support Zone (25,714–25,758) will act as the first battlefield between buyers and sellers.
If Nifty holds this zone and crosses above 25,910, a bullish intraday bias could develop, targeting 26,020.
But if the index repeatedly fails near 25,910, expect sideways-to-weak bias, as intraday traders may prefer range setups between 25,750–25,910.
Breakdown below 25,714 with volume confirmation can trigger a short move toward 25,600 and then 25,553 (last support).
Patience is crucial; the best trades form when the market reveals its direction post-opening volatility.
🟠 Educational Insight: Flat openings reflect balance between overnight buyers and sellers. In such cases, structure-based trades — breakouts or breakdowns with volume confirmation — are far superior to speculative entries.
🔻 Scenario 3: Gap-Down Opening (100+ Points Below Previous Close)
If Nifty opens near 25,650–25,600, it steps into the Last Intraday Support Zone (25,553–25,581). This region is critical as it represents the prior demand zone from where intraday recoveries were observed.
Look for reversal signals like bullish engulfing, hammer, or higher low near 25,560 to anticipate short-covering rallies.
A rebound above 25,714–25,758 can confirm a recovery attempt targeting 25,910.
Conversely, a breakdown below 25,553 with heavy volume may lead to deeper selling toward 25,480–25,450 zones.
Avoid impulsive trades immediately at the open; let the first 15-minute candle settle before reacting.
🔴 Educational Note: Gap-downs often trigger emotional trades. Focus on reaction at key supports — a well-timed reversal trade from strong zones can yield high reward with limited risk.
💡 Risk Management Tips for Options Traders
🎯 Stick to defined setups: Trade only near marked zones with clear confirmation.
💰 Position sizing: Risk not more than 2% of your total capital on a single trade.
🛑 Stop Loss Discipline: Always use a strict stop loss based on an hourly close — avoid emotional widening.
⌛ Avoid early entries: The first 30 minutes are for observation, not execution.
📊 Book partial profits: Secure 30–40% gains early and trail stop loss to cost for remaining position.
📆 Avoid overnight option positions: Theta decay and event risks can distort reward potential.
🧩 Summary & Conclusion
Nifty currently trades between two crucial decision zones — 25,553–25,581 (Support) and 26,020 (Resistance).
A breakout above 26,020 may open gates for 26,150, while a breakdown below 25,553 could extend weakness toward 25,450.
The broader sentiment remains neutral-to-bullish as long as Nifty holds above 25,714. The plan should be to trade only confirmed breakouts or retests, ensuring entries align with volume and structure rather than impulse. Remember — discipline and timing are your best tools, not prediction. 🧘♂️
⚠️ Disclaimer:
I am not a SEBI-registered analyst. This analysis is shared purely for educational and informational purposes. Traders are advised to conduct their own research or consult a certified financial advisor before making any investment or trading decisions.

NIFTY heading towards 25500!!As we can see NIFTY started showing rejection exactly from 26000 level which is also a psychological level and had been falling unidirectionally ever since. Further we can't see any eminent SUPPORT but minor supports can be seen on previous swings around 25700 hence despite being weak, we may see temporary green candles for few trading sessions before finally falling towards 25500 levels which is its next psychological level and important SUPPORT and any signs of REVERSAL from this zone can show massive upside so plan your trades accordingly and keep watching everyone.

Nifty Analysis - 27/10/525Market was in downtrend so if we open flat then look for PE trades or sell on rise to be followed. There is 2 days adjustments to be done for premiums so do not trade in first 15 minutes. If we open gap up then look for resistance level (25840) if we close above it then look for CE trades if not look for PE trades only. If we open gap down then wait for the gap to be filled first then look for PE trades. Targets are market on charts.
