Nifty Nearing its bottom and Solid Support Levels1. Head and Shoulder neckline breakdown of less than 9 % from top.
2. Further 9% near its long time consolidation and solid support levels.
3. Niftly nears its bottom and in consolidation range again.
4. Likely for 3-4 months.
5. Good time for ETFs and Mid cap funds
Trade ideas

Decoding the Market: A Guide to Profitable Options StrategiesTactical Positioning: Nifty 50 Set for Short-Term Correction
1. Market & Technical Thesis
The Nifty 50 has demonstrated significant strength, rallying approximately 6% over the last three weeks to trade around 25797, just shy of the recent high of 26104. This extended upward movement, however, creates a fertile ground for a short-term correction, aligning with a moderately bearish view for the coming weeks.
Key Technical Levels Driving the Outlook:
Critical Support (Bullish Pivot): 25662
This level marks the significant five-month high made on June 30. A successful defense of 25662 is crucial for maintaining the underlying bullish structure, potentially clearing the path for a retest of the All-Time High (ATH) at 26277.35.
Downside Trigger (Bearish Confirmation): 25462
The bearish view is confirmed if Nifty breaks decisively below the 25462 level. A breach here would likely accelerate selling pressure, with the next psychological and technical target being the 25000 mark.
In essence, the trading hypothesis is that the market will likely undergo a cooling-off phase, characterized by a marginal dip or consolidation, which should keep Nifty trading within the range defined by 25462 (on the low side) and the recent high of 26104 (on the high side).
2. Strategy Name and Objective
The executed trade is a customized, four-legged Neutral-to-Bearish Options Structure with a primary focus on premium capture (Theta decay) and profiting from a moderate downward movement that is contained above the major support levels. The strategy is designed to maximize returns if the Nifty 50 trades within a specific, relatively tight range through the 4th November expiry.
The structure is highly tailored, leaning heavily on the short side due to the selection of the short call strikes.
| Action | Instrument | Strike Price | Function in Strategy |
| Long | Put(P)| 25750 | Directional Profit/Hedge: Targets a drop from the Current Market Price (25797). Defines the lower side of the profit zone.
| Short | Put(P) | 26250 | Premium Income/Financing: Sells high-value premium, reducing the net cost of the Long Put. Forms a Bull Put Spread (25750P/26250P) component. |
| Short | Call (C) | 26000 | Premium Income/Resistance:Bets that Nifty will not rise above this out-of-the-money (OTM) strike.
| Short | Call (C) | 25350 | Aggressive Delta Short/High Premium: This is a deep In-The-Money (ITM) short call, providing a massive upfront credit and a significant bearish delta to the overall position, strongly aligning with the bearish outlook. |
3. Payoff and Risk Profile Analysis
The four-leg combination creates a unique payoff profile, which should be illustrated by the accompanying payout graph:
A. The Bearish Engine (Short Calls & Long Put)
The trade's core bearish conviction is driven by two legs: the Short 25350 Call and the Long 25750 Put.
1. Short 25350 Call: By shorting this deep ITM call, the trader receives a very large premium (premium approx Intrinsic Value + Time Value). The intrinsic value is the difference between the current spot (25797) and the strike (25350), which is approximately 25797 - 25350 = 447 points. This large premium collection immediately provides a strong profit buffer and a high negative delta, making the position highly sensitive to a market decline.
2. Long 25750 Put: This leg is positioned close to the money (ATM) and is the primary vehicle for profiting from the anticipated short-term decline towards the 25462-25000 support zone.
B. Risk Management and Premium Collection
The other two legs serve to refine the risk/reward and capture additional premium:
1. Short 26000 Call: Sells OTM premium, reinforcing the view that the index will not challenge the ATH in the short term.
2. Short 26250 Put: This put is positioned far OTM and serves primarily to offset the net cost of the Long 25750 Put, effectively creating a Bull Put Credit Spread** component (Long 25750P/Short 26250P). While this component is technically bullish, its function here is to manage the overall margin requirement and contribute net credit to the trade.
C. Expected Outcome at Expiry
Maximum Profit Zone:** The strategy will achieve its maximum profitability if Nifty closes
within a specific, narrow range*—likely centered around the 25750 strike. A slight decline, settling above the 25462 trigger, allows the short options to decay while the long put retains value or is balanced by the net credit.
Ideal Scenario: The market undergoes a moderate correction, closing around 25450 to 25750 on 4th November. This would maximize the decay of the short calls while capitalizing on the initial bearish move.
Downside Break-even: The net credit received from the premium-heavy structure creates a large downside buffer. The lower break-even point will be significantly below the current market price, likely below the 25462 trigger, offering a high probability of profit even if the market falls.
Maximum Loss:The position involves a naked short put (26250) and a naked short call (25350). *If the strategy is not a part of a larger, defined-risk structure (like an Iron Condor or Butterfly), the risk on one side (the short call 25350) and one side of the short put (26250) can be high, or even technically unlimited.* However, since the deep ITM Short Call is the dominant leg, the main risk is a sharp, unexpected rally past 26000. Assuming this is a spread with defined-risk parameters not fully specified, the intended risk is for the premium collected to outweigh any directional loss in a range-bound or slightly falling market.
The structure is a sophisticated play on a short-term directional pause/slight reversal coupled with a high conviction on premium decay, which is a strategic fit for the "bit bearish" outlook following a rapid 6% rally.
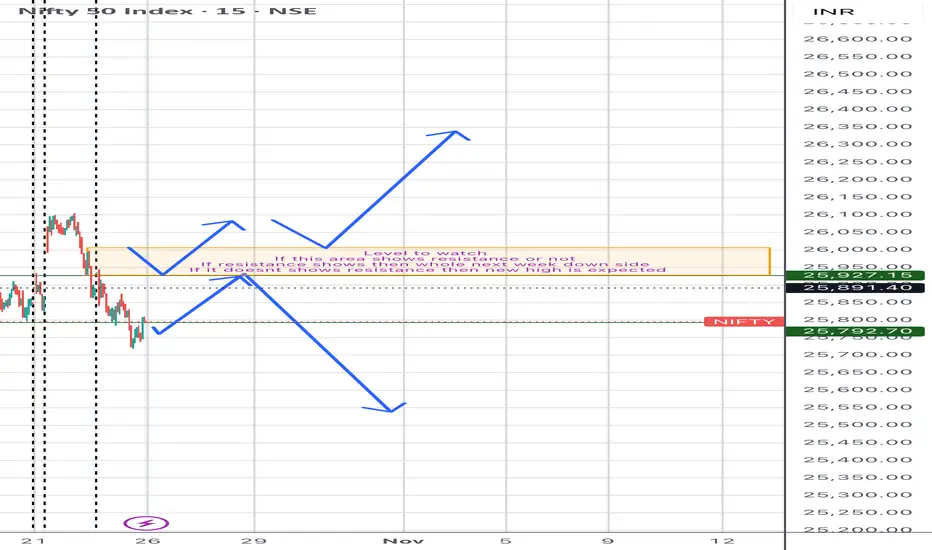
Nifty next week ideaNext week plan for nifty
Highlighted area shows resistance then down side target to be achieved.
Or otherwise upside bullish week is expected and new high is soon will be achieved
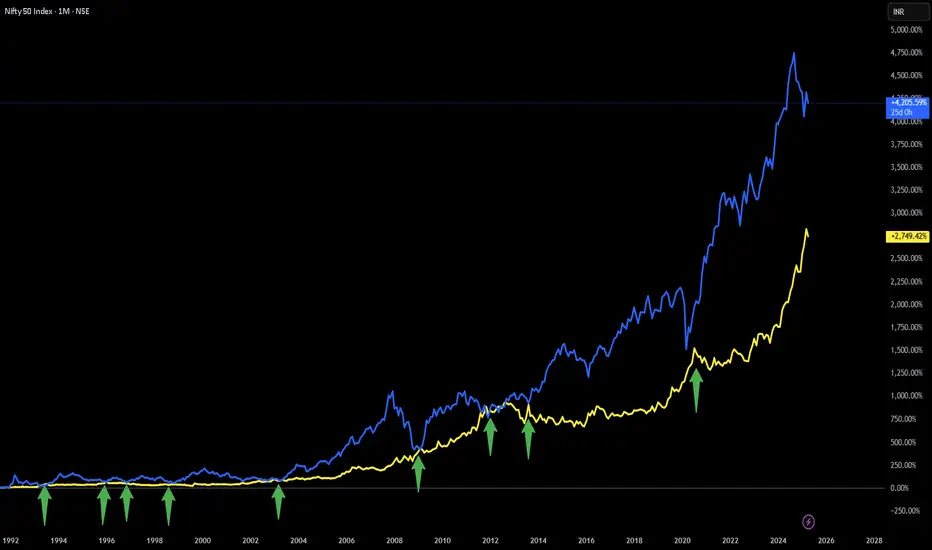
Strange Observation between NIFTY and GOLD...Since August 1, 1991: When ever NIFTY and GOLD return are same NIFTY gives handsome return in coming months.
Good examples of above statement are years 2003, 2009, 2013 and 2020.
Since August 1, 1991: NIFTY has given approx 4200% return and GOLD has given approx 2750% return. Difference in return is approx 1450%.
Going by the above observation either NIFTY has to come down or GOLD has to go up (or both) for NIFTY to give handsome return.
NOTE: This is just a strange observation/correlation.
Disclaimer: This is for demonstration and educational purpose only. This is not buying or selling recommendations. I am not SEBI registered. Please consult your financial advisor before taking any trade.
Part 1 Candle Stick Pattern Real-Life Example
Suppose you expect Reliance Industries stock to rise from ₹2,500 to ₹2,600 next month.
You buy a Call Option with a strike price of ₹2,500 for a premium of ₹50.
If Reliance reaches ₹2,600 → Profit = ₹100 - ₹50 = ₹50 per share
If Reliance stays below ₹2,500 → You lose only ₹50 premium
Thus, your risk is limited, but your reward can be significant.

A market Wrap Up on Fx, Rates, Geo- economic & Geo-PoliticsGlobal Wrap
Geo-economics was back on center stage.
The U.S. slapped new sanctions on Russia, broke off trade talks with Canada, upped its financial lifeline to Argentina’s President Milei, and geared up for the Trump–Xi meeting — which Trump insists will deliver a deal. (He’s clearly betting on optimism over precedent.)
U.S. — Soft Inflation, Fed in Focus
September inflation came in cooler than expected, boosting odds of a Fed rate cut on Wednesday. But both core and headline readings still hover a full point above the 2% target.
PMIs were upbeat; the University of Michigan survey… not so much. Consumers are clearly not feeling the vibes yet.
U.K. — Inflation Cools, Borrowing Heats Up
U.K. inflation eased to 3.8%, below forecasts, with wages also softening — pushing yields lower and giving the budget a breather. Still, borrowing for the first half of the fiscal year hit its highest since the pandemic. Less “Great British rebound,” more “Great British recalculation.”
China:
Slower, but on Target
China’s Q3 GDP growth slowed to 4.8%, bringing year-to-date expansion to 5.2% — enough to meet the official goal. Not thrilling, but Beijing will take it.
Markets:
Gold Stumbles, Oil Shines
Equities extended gains, yields stayed calm, and gold finally slipped after nine weeks of rallying. Oil had the opposite mood — both Brent and WTI closed above $60 a barrel as U.S. sanctions tightened on Russian exports.
The Week Ahead:
All eyes on geo-economics round two: the Trump–Xi summit, Argentina’s elections, and a flurry of central bank decisions.
The Fed is expected to trim rates by 25 basis points as job growth cools. Chair Powell’s press conference will be the week’s must-watch — especially with political heat still on the Fed.
The ECB is likely to stay on hold, while the Bank of Japan keeps its famously patient stance.
Meanwhile, the U.S. government shutdown drags into week four, delaying GDP and inflation data yet again — the statistical version of “please hold, your data is important to us.”
Oh BtW, there is the Bank of Canada rate decision too- no mystery there. They will cut another quarter.
Asia & Europe — Data Watch
China PMIs: Services likely up, manufacturing a tad softer.
Eurozone: Q3 GDP and inflation seen hovering near 2%.
U.K.: Consumption data to guide the late-November budget.
India — Still Strong, Slightly Softer
India’s forex reserves rose $4.5 billion to a record $702.3 billion, thanks to valuation gains.
The flash composite PMI slipped to 59.9 from 61.0 — the slowest in five months but still solidly expansionary. Services cooled, manufacturing ticked up, exports softened.
Markets flirted with record highs before mild profit-taking, as everyone awaits progress in U.S.–India trade talks.
Geopolitics — Quiet Resolve and Fiscal Reality
China: The Communist Party’s Fourth Plenum reaffirmed the 15th Five-Year Plan and doubled down on tech leadership. Tariffs may sting, but Beijing’s message is clear: “We’re not blinking.”
Japan: Sanae Takaichi took office as Prime Minister, promising stimulus — but markets aren’t buying it. With public debt at 236% of GDP, Tokyo may be out of fiscal runway. Appointing two ex-finance ministers suggests “prudence now, promises later.”

NIFTY- Intraday Levels - 27th October 2025If NIFTY sustain above 25808/17/24 above this bullish then around 25832/40/51 above this more bullish 25866/77 then 25933/57 above this wait
If NIFTY sustain below 25881 below this bearish then around 25715 strong level if sustain below this more bearish then 25553/49/31/20 below this wait
Consider some buffer points in above levels.
Please do your due diligence before trading or investment.
**Disclaimer -
I am not a SEBI registered analyst or advisor. I does not represent or endorse the accuracy or reliability of any information, conversation, or content. Stock trading is inherently risky and the users agree to assume complete and full responsibility for the outcomes of all trading decisions that they make, including but not limited to loss of capital. None of these communications should be construed as an offer to buy or sell securities, nor advice to do so. The users understands and acknowledges that there is a very high risk involved in trading securities. By using this information, the user agrees that use of this information is entirely at their own risk.
Thank you.

#Nifty Weekly Analysis 27-10-25 to 31-10-25#Nifty Weekly Analysis 27-10-25 to 31-10-25
25700-25900 is the sideways range for nifty.
Short level is below 25700 and the targets on downside are 25600/25500.
Long confirmation above 25900 for the target of 26080/26200.

NIFTY50 - VULNERABLE TO 20% CORRECTIONSymbol - NIFTY50
NIFTY50 has been trading within a defined range for the past several months, unable to generate any meaningful trending move due to the absence of strong fundamental or macroeconomic catalysts on either side. Both bullish and bearish drivers have remained largely muted, resulting in a period of indecision and lackluster volatility.
While the index itself has shown little directional progress, distribution patterns are increasingly visible across the broader market, which continues to exhibit a consolidation to bearish bias. This suggests that institutional participation may be shifting, and underlying sentiment is weakening despite the Nifty50’s apparent stability.
There are several macroeconomic and geopolitical factors that could contribute to a potential correction in global equity markets. Although listing them all would make this analysis excessively long, some of the key concerns include:
1. Rising inflationary pressures driven by US tariffs implemented under Trump’s economic policy.
2. Weak US fiscal policy and growing concerns that the US government could default on its debt obligations.
3. Elevated recession expectations in the United States.
4. Gold and Silver simultaneously hitting historic highs, signaling a clear risk-off sentiment, even as US equity markets trade at record levels.
5. Overvaluation and speculative euphoria in AI and machine learning related stocks, indicating a potential bubble in select sectors.
At current levels, valuations appear moderately high, and the 'smart money' or true value buying zones remain significantly lower. Based on these factors, my personal bias leans toward a major correction in the coming months. I anticipate a potential downside of around 20% or more in NIFTY50.
This is a positional view, so I am not sharing immediate support or resistance levels. However, the 20-21K zone and below may represent attractive long term accumulation levels for investors once the correction plays out.
It’s worth recalling that in my previous outlook last year, when Nifty50 traded near 26000, I projected a 10–15% correction, which materialized shortly after. This time, however, the downside potential could be even deeper - though only time will tell how the broader macro picture unfolds.
Disclaimer: This analysis is shared purely for educational purposes and should not be considered trading or investment advice.
NIFTY 50 Technical LevelsNIFTY 50 Technical Levels:-
Current/Closing Level: Approx. 25,795 - 25,843 (Based on recent closing data).
Immediate Resistance (R1): 25,900 - 26,008 (Crucial breakout zone and upper band of the recent consolidation).
Key Resistance (SQRT-R2 / ATH Target): 26,244 - 26,277 (All-Time High and measured move target).
Immediate Support (SQRT-S1): 25,600 - 25,700 (Recent breakout region and strong demand area/pivot).
Key Support (SQRT-S2): 25,281 (Breakdown below this could signal a deeper correction).
Outlook: The Nifty is positioned for a breakout above 25,900. A "Buy on Dips" strategy near S1 is advisable given the short holding period and overbought conditions in some oscillators (RSI near 70, Stochastic overbought).
Q2 FY25 Earnings Season Impact
Overall Theme: Mixed to Largely In-Line, with K-shaped Recovery continuing.
Strong Performers (Positive Catalysts): Banking & Financial Services (strong loan demand, improved asset quality), Pharma (strong export demand, stabilization of raw material costs), IT (large deal wins, digital focus), and Realty.
Laggards (Negative/Muted Impact): FMCG (muted rural demand, inflation), Energy (margin compression, higher costs), and Infrastructure (slowdown in project announcements).
Investment Implication: Favor stocks in outperforming sectors (Financials, Pharma, IT) that have delivered positive earnings surprises or provided strong guidance for H2 FY25.
FII Flow Patterns & Global Market Sentiment
FII Flow: FIIs (Foreign Institutional Investors) have shown a recent turnaround to net buying after a period of selling, which is a significant positive sentiment boost. However, flows can be volatile. DII (Domestic Institutional Investor) support remains consistently strong, providing a robust floor to the market.
Global Sentiment: Cautious. Global growth concerns persist. US interest rates are expected to soften, which traditionally supports emerging markets like India. Global volatility is a key risk factor.
Investment Implication: The return of FII buying, combined with DII strength, supports a positive tactical view for the next 15 days, favoring liquid large-cap stocks that FIIs typically target (e.g., Financials, IT).
Sector Rotation Trends
Outperforming/Improving: Banking & Financial Services (Bank Nifty at All-Time High), IT (improving relative performance), Metals (commodity cycle/trade deal optimism), and Energy/Oil (improving relative momentum).
Underperforming/Lagging: FMCG and Midcap/Smallcap Indices (Midcap 100 in the weakening quadrant, suggesting caution in this segment).
Investment Implication: Focus on the improving and outperforming sectors, particularly Banking, IT, and selective Metals/Energy to capitalize on the current momentum for a short-term trade.
FOR FUTURE INVESTMENT EAGLE EYE ON:-
Hindalco
ITC
NTPC
Sun Pharma. Inds.
HDFC Bank
Kotak Mah. Bank
ICICI Bank
SBI
O N G C
HCL Technologies
Infosys

Derivatives Trading Strategies and Options TradingIntroduction
The world of financial markets extends far beyond simple buying and selling of stocks. One of the most dynamic and sophisticated areas is derivatives trading, which provides investors and institutions with tools to manage risk, speculate on price movements, and enhance portfolio performance. Among the various derivative instruments—such as forwards, futures, swaps, and options—options trading stands out as both versatile and powerful. Understanding derivatives and the strategies associated with options is essential for any trader or investor aiming to navigate complex global markets effectively.
Understanding Derivatives
Definition
A derivative is a financial instrument whose value is derived from an underlying asset or group of assets. The underlying asset could be equities, bonds, commodities, currencies, interest rates, or even market indices. Essentially, derivatives are contracts between two or more parties, where the value is linked to changes in the price of the underlying asset.
Purpose and Importance
Derivatives are used for three main purposes:
Hedging: To reduce or manage risk associated with price movements.
Speculation: To profit from anticipated market fluctuations without owning the underlying asset.
Arbitrage: To exploit price differences in different markets for the same or related assets.
Types of Derivatives
Forwards: Customized contracts between two parties to buy or sell an asset at a specified price on a future date.
Futures: Standardized contracts traded on exchanges, similar to forwards but with more liquidity and lower counterparty risk.
Options: Contracts that give the holder the right, but not the obligation, to buy or sell the underlying asset at a specific price before or at expiration.
Swaps: Agreements to exchange cash flows or financial instruments, often used to manage interest rate or currency exposure.
Fundamentals of Options Trading
What Are Options?
Options are derivative contracts that provide the right (not the obligation) to buy or sell an underlying asset at a predetermined price, known as the strike price, within a specified period. The buyer pays a premium to the seller (writer) for this right.
There are two basic types of options:
Call Option: Gives the holder the right to buy the asset.
Put Option: Gives the holder the right to sell the asset.
Key Terms in Options Trading
Strike Price: The fixed price at which the asset can be bought or sold.
Premium: The price paid by the option buyer to the seller.
Expiration Date: The date on which the option contract expires.
In-the-Money (ITM): When exercising the option is profitable.
Out-of-the-Money (OTM): When exercising the option would not be profitable.
At-the-Money (ATM): When the strike price equals the current market price.
Intrinsic Value: The difference between the current market price and the strike price (if positive).
Time Value: The portion of the premium attributable to the time remaining until expiration.
Participants in Options Market
Hedgers: Use options to protect against unfavorable price movements.
Speculators: Seek to profit from expected price changes.
Arbitrageurs: Exploit pricing inefficiencies between related securities.
Derivatives Trading Strategies
Traders use a wide variety of strategies with derivatives, depending on their market outlook, risk appetite, and investment objectives. Broadly, derivative strategies fall into three categories: hedging, speculation, and arbitrage.
1. Hedging Strategies
Hedging is a risk management strategy used to offset potential losses in one investment by taking an opposite position in a related derivative.
Example:
A wheat farmer worried about falling prices can sell wheat futures to lock in a selling price. Similarly, a gold trader anticipating volatility might buy put options to protect against price declines.
Popular Hedging Strategies:
Protective Put: Buying a put option to hedge against a decline in a stock’s price.
Covered Call: Selling call options on owned stock to generate income while holding the asset.
Futures Hedge: Using futures contracts to lock in prices for commodities or currencies.
2. Speculative Strategies
Speculators use derivatives to bet on price movements with the intent to profit. Because derivatives often involve leverage, they can amplify both gains and losses.
Examples:
Buying a call option to speculate that the price of a stock will rise.
Shorting a futures contract expecting that the underlying asset’s price will fall.
Common Speculative Strategies:
Long Call: Profit if the underlying asset’s price increases above the strike price.
Long Put: Profit if the underlying asset’s price decreases below the strike price.
Futures Long/Short: Taking long or short positions in futures contracts to benefit from anticipated price moves.
3. Arbitrage Strategies
Arbitrage involves exploiting price inefficiencies between markets or related securities. Traders simultaneously buy and sell equivalent assets to lock in risk-free profits.
Examples:
Cash-and-Carry Arbitrage: Buying the asset in the spot market and selling futures when futures prices are higher than the spot price.
Options Arbitrage (Put-Call Parity): Using mispricing between call and put options with the same strike price and expiry to earn risk-free returns.
Options Trading Strategies
Options trading provides flexibility for both risk management and profit generation. By combining calls and puts in various ways, traders can design strategies suited for bullish, bearish, or neutral market conditions.
Let’s explore the major categories of option strategies.
1. Basic Option Strategies
a. Long Call
Objective: Profit from a rise in the underlying asset’s price.
Mechanism: Buy a call option at a specific strike price.
Risk/Reward: Limited loss (premium paid); unlimited potential profit.
b. Long Put
Objective: Profit from a decline in the asset’s price.
Mechanism: Buy a put option.
Risk/Reward: Limited loss (premium); large profit potential if price falls sharply.
c. Covered Call
Objective: Generate income from owned stocks.
Mechanism: Hold a stock and sell a call option on it.
Risk/Reward: Income from premium; limited upside if stock price rises above strike price.
d. Protective Put
Objective: Protect against downside risk.
Mechanism: Buy a put option while holding the underlying asset.
Risk/Reward: Limits losses if price falls but costs the premium.
2. Intermediate Option Strategies
a. Bull Call Spread
Objective: Profit from moderate price increases.
Mechanism: Buy a call at a lower strike price and sell another call at a higher strike price.
Benefit: Reduces cost compared to a single long call.
b. Bear Put Spread
Objective: Profit from moderate declines.
Mechanism: Buy a put option and sell another put at a lower strike.
Benefit: Lower premium cost; limited profit and loss.
c. Straddle
Objective: Profit from high volatility (regardless of direction).
Mechanism: Buy a call and a put with the same strike and expiry.
Risk/Reward: High cost due to two premiums, but unlimited upside potential in volatile markets.
d. Strangle
Objective: Similar to a straddle but cheaper.
Mechanism: Buy out-of-the-money call and put options.
Benefit: Lower cost; profits if there is a big price movement either way.
3. Advanced Option Strategies
a. Butterfly Spread
Objective: Profit from low volatility (price staying near a target level).
Mechanism: Combine multiple calls or puts at different strikes to limit both gains and losses.
Benefit: Defined risk and reward, ideal for range-bound markets.
b. Iron Condor
Objective: Profit from low volatility and time decay.
Mechanism: Combine a bull put spread and a bear call spread.
Benefit: Generates steady income if price stays within a defined range.
c. Calendar Spread
Objective: Benefit from time decay and volatility differences.
Mechanism: Buy and sell options with the same strike but different expirations.
Use Case: Effective when expecting limited near-term movement but higher long-term volatility.
Risk Management in Derivatives and Options
While derivatives offer leverage and flexibility, they also introduce significant risks. Therefore, risk management is central to successful trading.
Major Risks Involved
Market Risk: Adverse price movements can lead to large losses.
Leverage Risk: Small changes in the underlying price can result in amplified gains or losses.
Liquidity Risk: Difficulty in exiting positions at fair value.
Counterparty Risk: Risk that the other party may default on contractual obligations.
Volatility Risk: Sudden changes in volatility can impact option premiums.
Risk Control Techniques
Position Sizing: Limiting exposure by controlling the size of each trade.
Stop-Loss Orders: Predefined exit points to limit losses.
Diversification: Spreading risk across different instruments or markets.
Delta Hedging: Offsetting directional risk in options portfolios by balancing long and short positions.
Applications of Derivatives and Options
Derivatives are integral to global financial systems. They serve various functions beyond speculation, including:
Hedging Foreign Exchange Exposure: Corporations hedge currency risk using futures and options.
Managing Commodity Prices: Farmers, miners, and oil companies lock in prices through derivatives.
Interest Rate Management: Financial institutions use swaps to stabilize borrowing costs.
Portfolio Enhancement: Investors use covered calls or protective puts to improve returns or reduce volatility.
Conclusion
Derivatives and options trading represent the most sophisticated and influential segments of modern finance. They offer opportunities for risk management, profit generation, and strategic flexibility, but also demand a deep understanding of market mechanics and disciplined risk control. Whether it is a multinational corporation hedging its currency exposure or a retail trader speculating on index options, derivatives remain an essential component of the global financial architecture.
However, derivatives are double-edged tools—capable of magnifying profits or catastrophic losses. Success in this arena requires not just financial capital but also intellectual discipline, strategic thinking, and continuous learning. In the ever-evolving world of finance, mastery of derivatives trading strategies and options trading is a gateway to both financial innovation and resilience.

Part 8 Trading Master ClassKey Terms in Option Trading
To understand option trading well, you must know these important terms:
Strike Price: The fixed price at which the underlying asset can be bought or sold.
Premium: The price paid to purchase an option.
Expiry Date: The date when the option contract ends.
In the Money (ITM): When exercising the option is profitable.
Out of the Money (OTM): When exercising the option is not profitable.
At the Money (ATM): When the asset’s price is equal to the strike price.

Nifty Price Action Analysis for Nov 202525-Oct-25:
Nifty broke 25500 resistance with good volume on 15th Oct.
CMP is 25795 as on 24th Oct.
For November series Nifty is likely to take pullback support at 25400-25600 levels then at 25100 levels.
Major uptrend support lies at 24600 levels for another attempt for lifetime high

#Nifty50 Next Week Analysis (October 27 - November 2, 2025)
The #Nifty 50 index closed the week ended October 24, 2025, at 25,795.15, marking a 0.37% decline and snapping a six-day winning streak amid profit booking in select heavyweights like banking and telecom stocks. This came after a strong rally that pushed the index near its all-time high territory around 26,000 earlier in the week. However, positive global cues, particularly the finalisation of the India-US trade deal, could provide a tailwind heading into next week.
#Support $ Resistance
Immediate Support - 25,800 to 25,300
Immediate Resistance - 26,400 to 26,200
#Influencing Factors
- Bullish Driver - Domestic flows remain strong, with FIIs net buyers (~₹12,000 crore last week) amid easing geopolitical tensions.
- Bearish Driver - US markets are choppy ahead of the November 5 election, and any escalation in Middle East tensions could pressure oil prices and risk assets.
#My Overview
Based on recent price action, the index is consolidating in a tight range after the pullback. It remains above Resistance Level now acting as a support given in the chart , indicating #Bullish -to-Neutral or #Bearish momentum without overbought conditions yet.
#Overall Outlook
#nifty50 Next week looks set for consolidation with a positive tilt, driven by trade deal optimism and resilient domestic buying. Bulls could regain control if Nifty sustains above 26,400 early in the week, targeting 28,000+. Bears may dominate on a close below 25,200, pulling toward 24,500. Stay tuned to US-India negotiations for intraday triggers.
#Trend Overview
Trend Neutral to Bearish and 'Can' go down due to bearish diversions -
~~ Disclaimer ~~
High Risk Investment
Trading or investing in assets like crypto, equity, or commodities carries high risk and may not suit all investors.
Analysis on this channel uses recent technical data and market sentiment from web sources for informational and educational purposes only, not financial advice. Trading involves high risks, and past performance does not guarantee future results. Always conduct your own research or consult a SEBI-registered advisor before investing or trading.
This channel, Render With Me, is not responsible for any financial loss arising directly or indirectly from using or relying on this information.

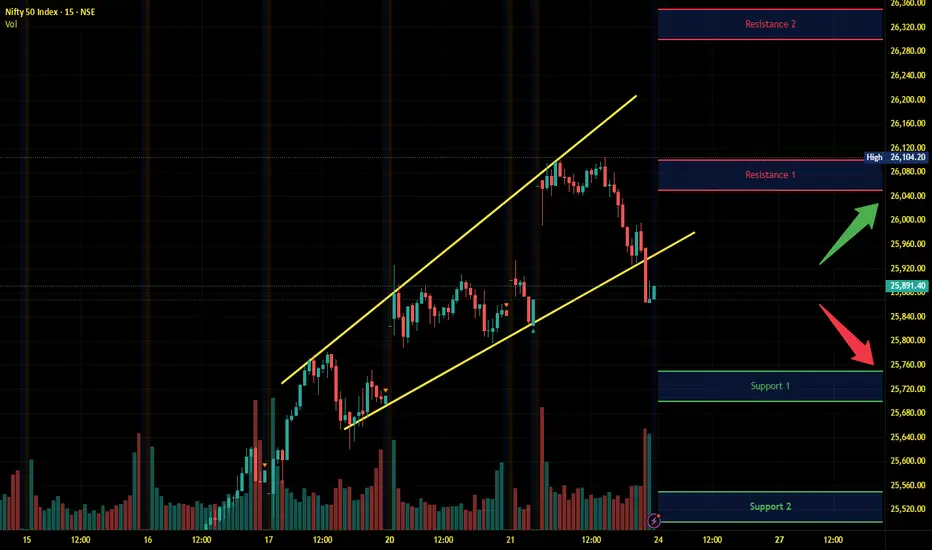
Nifty on Profit Booking Mindset
What Happened Yesterday (23/10/2025)
1.The market opened with a 180-point gap up due to Trump’s positive comments about Indian tariffs.
2.From near the all-time high of 26,104, the market started falling and closed the day at 25,891.
3.It formed a big red candle after many bullish sessions, but still ended with a marginal gain of 30 points.
What Happened Today (24/10/2025)
1. The market showed a 35-point positive pre-open, but the gains were quickly wiped out after the open.
2. The market continued yesterday’s downtrend, making lower lows throughout the session.
3. From 25,900, it dropped to 25,720 but recovered slightly to close at 25,795.
4. On the daily chart, a bearish candle formed with a lower wick.
5. On the weekly chart, the candle pattern resembles an evening star, indicating negative sentiment.
Yesterday, I had taken a 25,800 short straddle with a total premium of 300 points. Today, the premium decayed by 110 points, ending around 185 points.
Next Day Possibilities (October 27, 2025)
1. Selling pressure has continued from 26,100, but the market seems to have found support near 25,720.
2. The market is expected to remain range-bound between 25,900 and 25,700 on Monday (in the absence of major news).
3. On a weekly basis, the possible trading range is 25,500 to 26,000.
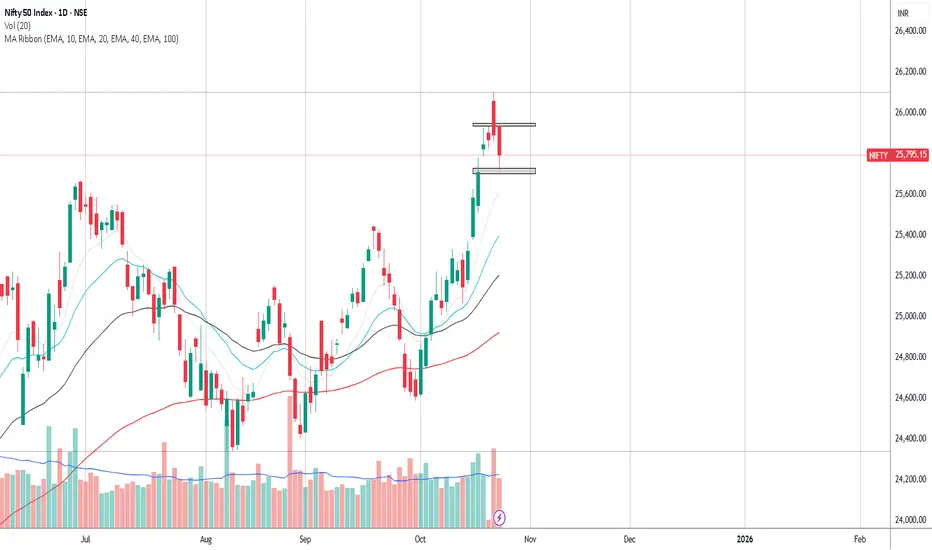
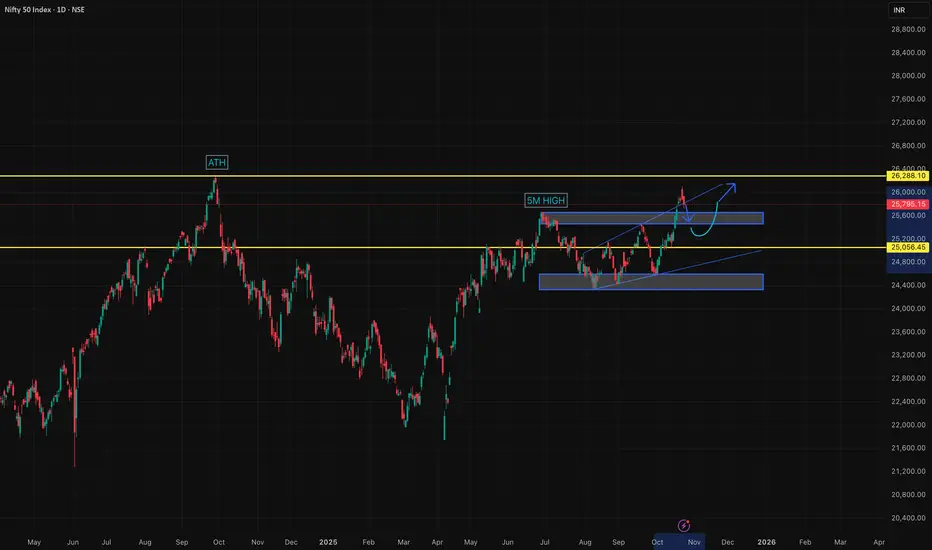
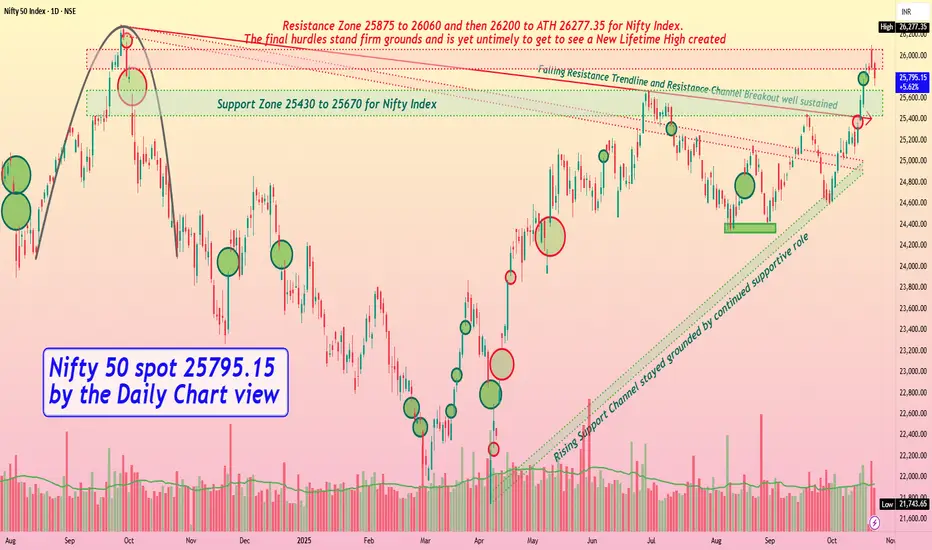
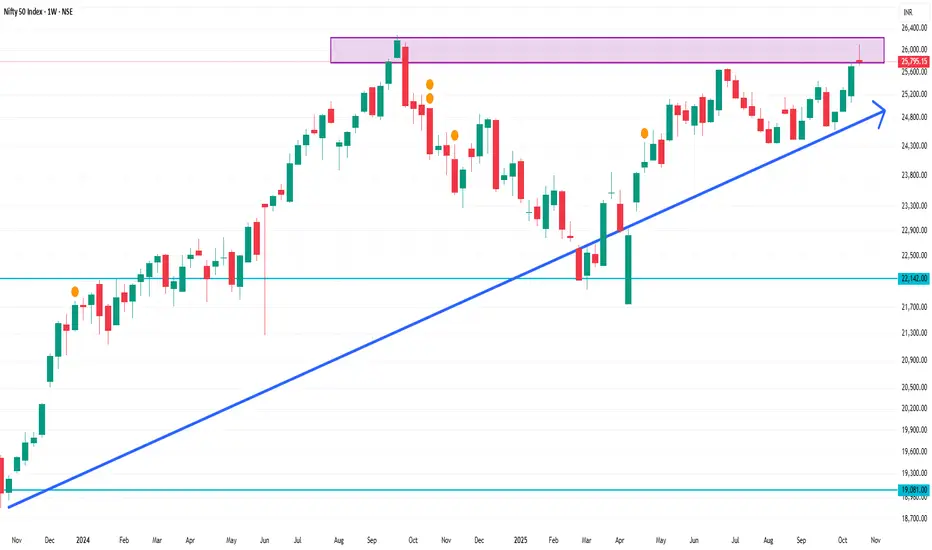
Nifty 50 spot 25795.15 by Daily Chart view - Weekly updateNifty 50 spot 25795.15 by Daily Chart view - Weekly update
- Support Zone 25430 to 25670 for Nifty Index
- Rising Support Channel stayed grounded by continued supportive role
- Falling Resistance Trendline and Resistance Channel Breakout well sustained
- Resistance Zone 25875 to 26060 and then 26200 to ATH 26277.35 for Nifty Index
- The final hurdles stand firm grounds and is yet untimely to get to see a New Lifetime High created
- Nifty Index earlier shied away to cross the 25K level and now acting likewise to breach the ATH 26277.35 mark
Nifty updated levels more fall possible 25500-25300 then bounce Nifty avoid buying at current price more fall possible
How My Harmonic pattern projection Indicator work is explained below :
Recent High or Low :
D-0% is our recent low or high
Profit booking zone ( Early / Risky entry) : D 13.2% -D 16.1 % is
range if break them profit booking start on uptrend or downtrend but only profit booking, trend not changed
SL reversal zone (Safe entry ) : SL 23.1% and SL 25.5% is reversal zone if break then trend reverse and we can take reverse trade
Target : T1, T2, T3, T4 and .
Are our Target zone
Any Upside or downside level will activate only if break 1st level then 2nd will be active if break 2nd then 3rd will be active.
Total we have 7 important level which are support and resistance area
Until , 16% not break uptrend will continue if break then profit booking will start.
If break 25% then fresh downtrend will start then T1, T2,T3 will activate
1,3,5,10,15,20 minutes are short term levels.
30 minutes 60 minutes , 2 hours,3 hours, ... 1 day and 1 week chart positional and long term levels
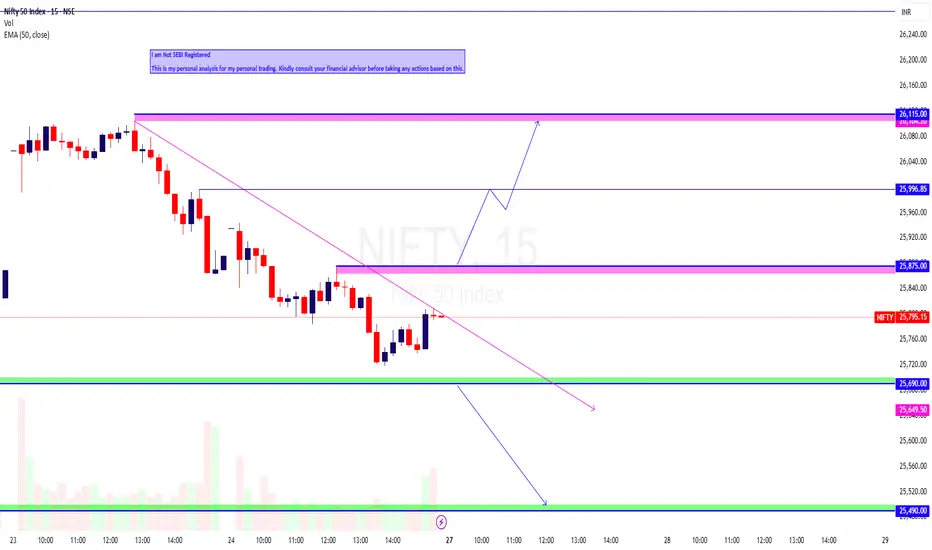
NIFTY Intraday Trade Setup For 27 Oct 2025NIFTY Intraday Trade Setup For 27 Oct 2025
Bullish-Above 25900
Invalid-Below 25850
T- 26115
Bearish- Below 25690
Invalid-Above 25740
T- 25490
NIFTY has closed with a slight bearish sentiment last week, a shooting star formed near ATH zone. 25500 will be a strong support zone for next week as its 0.382% of the recent leg of rally. In 15 Min TF it has been simple bearish structure. On Monday above 25900 in 15 Min TF trend may change to bullish again, it will be best if followed by a rejection at first attempt. On flat opening below 25690 in 15 Min TF, index will test 25490.
In case of a big gap up/down, wait till 10 o'clock and mark the high and low of the trading range (5MIN). Trade on this range breakout.
==========
I am Not SEBI Registered
This is my personal analysis for my personal trading. Kindly consult your financial advisor before taking any actions based on this.
Nifty Intraday Analysis for 24th October 2025NSE:NIFTY
Index has resistance near 26050 – 26100 range and if index crosses and sustains above this level then may reach near 26300 – 26350 range.
Nifty has immediate support near 25750 – 25700 range and if this support is broken then index may tank near 25550 – 25500 range.
Nifty 50 1 Week Time Frame 📊 Weekly Support & Resistance Levels
Immediate Support: 25,700 – 25,650
A break below this level could lead to further declines towards 25,500 – 25,450.
Immediate Resistance: 25,950 – 26,000
Sustained trading above this range may push the index towards 26,200 – 26,250.
🔍 Technical Indicators
Pivot Points: Weekly pivot is around 25,974.00, with R1 at 26,238.20 and S1 at 25,517.30.
Fibonacci Levels: Retracement levels suggest support near 25,524.90 and resistance around 26,249.29.
RSI: Currently in a bullish zone, indicating sustained upward momentum.
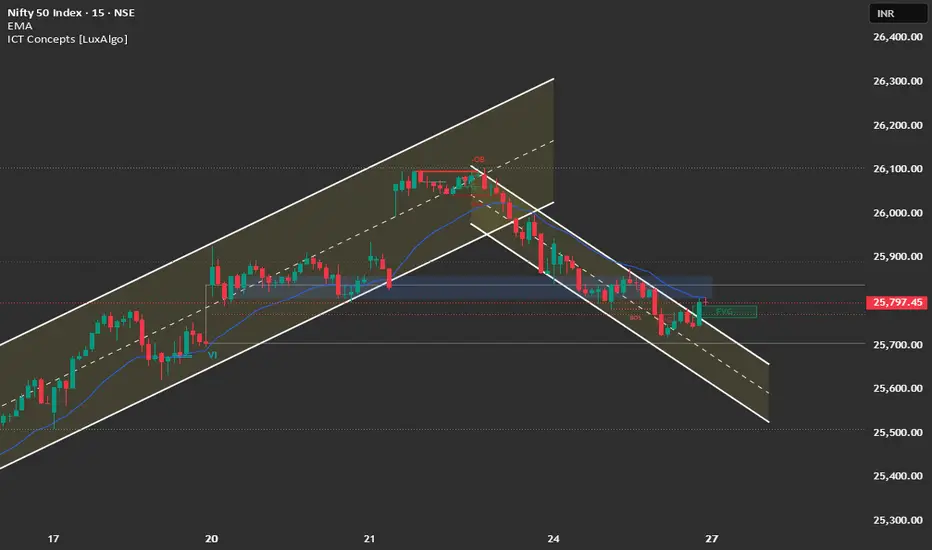
Nifty Structure Analysis & Trade Plan: 27th October4-Hour Chart (Macro Trend)
Structure: The Nifty is in an Aggressive Bullish Momentum phase, but the recent 4H candle shows a deep correction that broke below the lower trendline of the steep ascending channel. This signals a Market Structure Shift (MSS) on the aggressive short-term momentum. The correction closed right on the FVG (Fair Value Gap), suggesting this zone will be critical.
Key Levels:
Major Supply (Resistance): 25,950 - 26,100. This area (the high from Oct 23) is the immediate overhead hurdle. A break above 26,100 would target the ATH.
Major Demand (Support): 25,400 - 25,550. This area, which includes the largest FVG and a strong accumulation zone, is the must-hold level for the overall weekly bullish bias.
Outlook: The bias is Corrective within an Uptrend. We expect consolidation or a retest of the lower support levels before the bulls can attempt a fresh ATH breakout.
1-Hour Chart (Intermediate View)
Structure: The 1H chart shows a clear descending channel formed during Friday's trading, confirming the short-term correction. The index has lost momentum and closed near the day's low.
Key Levels:
Immediate Resistance: 25,900 (Previous swing low/upper channel boundary).
Immediate Support: 25,600 (Lower channel boundary/FVG zone).
15-Minute Chart (Intraday View)
Structure: The 15M chart confirms the steep descending channel. The price is currently testing the lower end of the channel, having already broken the immediate short-term support and leaving an FVG overhead (around 25,900).
Key Levels:
Intraday Supply: 25,900.
Intraday Demand: 25,600.
Outlook: Bearish for the session open. A "Sell on Rise" strategy near the channel resistance is favorable.
📈 Trade Plan (Monday, 27th October)
Market Outlook: Nifty is undergoing a sharp correction, fueled by a renewed focus on global risks. The key lies in defending the 25,600 - 25,700 support zone.
Bearish Scenario (Primary Plan: Correction Continuation/Sell on Rise)
Justification: The breakdown of the steep channel and the formation of a descending channel favor continuation toward the 25,500 support.
Entry: Short entry on a retest and rejection of the 25,900 - 25,950 level (upper channel/FVG) OR Short a decisive break and 15-minute candle close below 25,750.
Stop Loss (SL): Place a stop loss above 26,000 (above the last swing high).
Targets:
T1: 25,600 (Lower channel support/Major FVG).
T2: 25,500 (Major weekly support).
Bullish Scenario (Counter-Trend/Bounce)
Justification: The macro trend remains bullish. A strong bounce from support is possible.
Trigger: A sustained move and close above 26,000.
Entry: Long entry on a confirmed 15-minute close above 26,000.
Stop Loss (SL): Below 25,850.
Targets:
T1: 26,100 (Retest of previous high).
T2: 26,277 (All-Time High).
Key Levels for Observation:
Immediate Decision Point: 25,750 - 25,900 zone.
Bearish Confirmation: Sustained trade below 25,750.
Bullish Warning: A move back above 26,000.
Line in the Sand: 25,500. Below this level, the risk of a deep correction increases significantly.
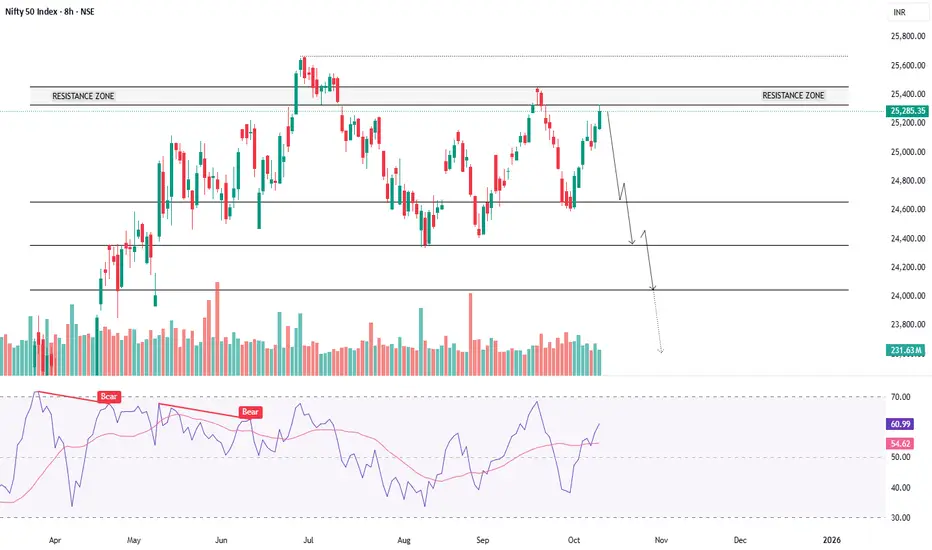
Nifty is currently entering into strong supply zone 21.10.25Nifty is currently entering into strong supply zone
1. Nifty current spot price is at 25843.15.
2. Major resistance near 25800–26000.
- This zone, highlighted on the chart, marks a significant supply area where previous rallies faced rejection, making it a crucial level to watch.
3. The retesting zone and confluence of 0.786 (25269.65) and 0.886 (25,67.40) Fibonacci retracement levels are potential support if a pullback occurs.
Please watchout for rejection or selling pressure within the marked resistance zone.
Regards
Bull Man

Bottom-fishing in Nifty? Good retraction in nifty today, we can see a solid base foundation. Great trade emerging for lunch today. Can hold for Monday as well. Overall structure is bullish. Trade with a buy setup.
