#NIFTY Intraday Support and Resistance Levels - 05/12/2025Flat opening keeps the market neutral at the start. this means neither buyers nor sellers have a clear upper hand. Bank Nifty is stuck inside a narrow intraday box, so the triggers become even more important because a flat open often leads to a breakout on either side once volume picks up.
If price sustains above 59050 to 59100, the CE setup activates. Targets remain 59250, 59350, and 59450+. A stronger breakout above 59550 to 59600 can extend towards 59750, 59850, and 59950+.
If the index rejects 59450 to 59400 after a flat open and falls back, the PE setup triggers below 58950 to 58900. Targets remain 58800, 58700, and 58600-. A deeper slip below 58600 increases weakness toward the next support near 58550.
Flat opening usually creates two traps. first, early fake spikes around 59050–59100, and second, mid-range whipsaws near 59450–59400. So waiting for clean sustain above or below the marked zones will help avoid unnecessary stop-loss hits.
Trade ideas
NIFTY just got very weak!As we can see NIFTY showed strong downfall and it can be seen forming more like a head and shoulders pattern which is strong bearish structure so any closing below 25900 can show 25500 in coming trading sessions so plan your trades acordingly and keep watching everyone.

NIFTY - 06.12.2025Getting good support around 25900 and Facing resistance around 26300.
More chances to hit the resistance level again and looking for breakout above 26300 in coming days.

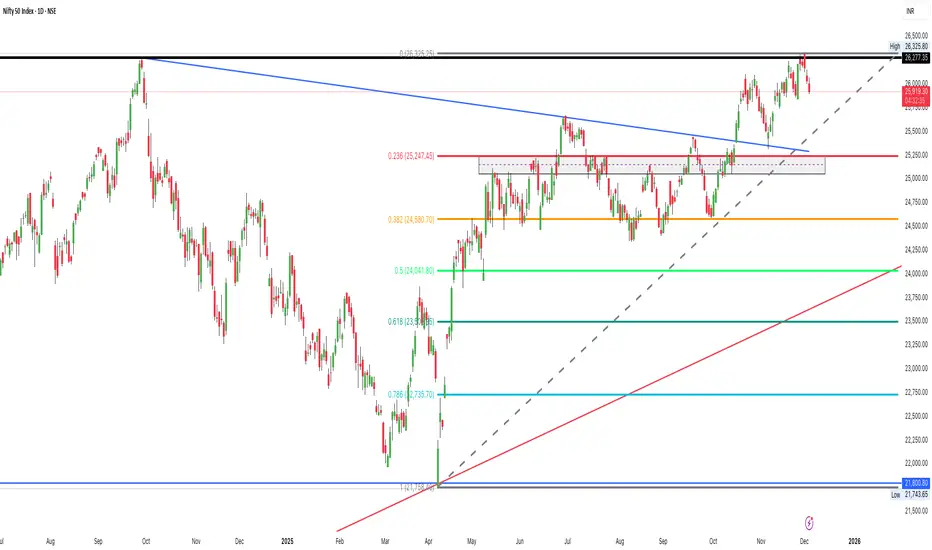
NIFTY 50 Short Analysis (03 Dec 2025)Seen on chart :
Nifty is right at a major resistance zone ≈ 26,275–26,325
This level is a double top / supply zone, and strong sellers are visible
Price rejected today with a red candle → Profit booking / short-term weakness
Fib retracement drawn from 21,758 → 26,325
Short-Term View
Bearish bias short-term unless closes above 26,325
Possible pullback zones
First support zone: 25,247
Next support: 24,580
Major buying zone: 24,042–23,502
Trading Plan
If holding longs
Book partial profit near resistance
Add again only if breakout & close above 26,325
Fresh entries
Buy on dip around supports, not at top
🎯 Dip Buying Targets
25,247 → bounce target back 25,850–26,000
24,580 → bounce target 25,200
🛑 Weak below: 24,580
💥 Breakout strength above: 26,325
Conclusion
Nifty is at major resistance, expecting healthy correction / pullback before another rally.
Correction towards 25,247–24,580 is healthy and good for positional buying.
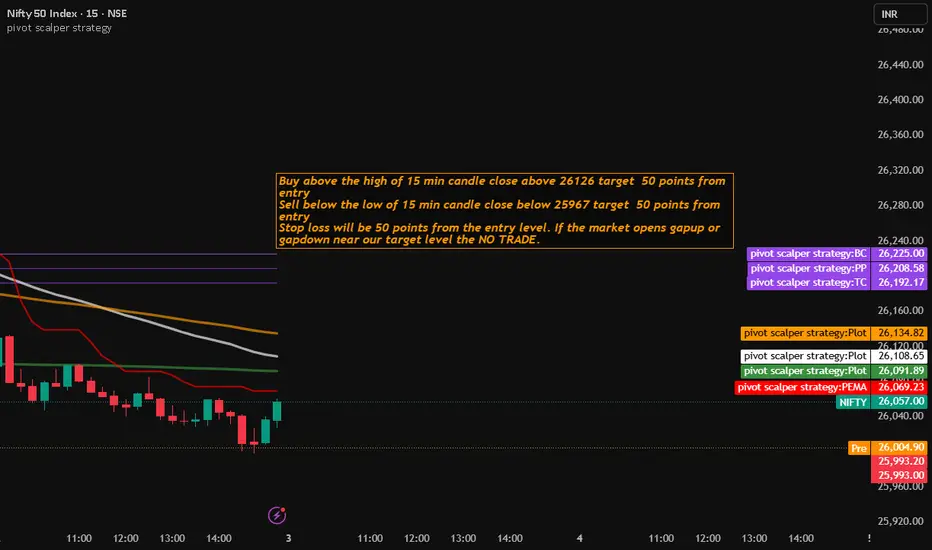
Nifty Trading Strategy for 03rd December 2025📈 NIFTY Intraday Trading Strategy – 15-Min Candle Breakout
🟢 BUY Setup
✔️ Condition:
Enter Buy only if a 15-minute candle closes ABOVE 26,126.
🎯 Target:
+50 points from the entry price.
🎯 Stop Loss:
−50 points from the entry price.
🔻 SELL Setup
✔️ Condition:
Enter Sell only if a 15-minute candle closes BELOW 25,967.
🎯 Target:
+50 points from the entry price.
🛑 Stop Loss:
−50 points from the entry price.
⚠️ Important Condition – No Trade Zone
⛔ If NIFTY opens GAP-UP or GAP-DOWN directly near the target levels,
→ NO TRADE for the day.
(Avoid chasing trades that have already reached the expected move.)
📝 General Guidelines
📌 Always wait for 15-min candle CLOSE, not just a wick breakout.
📌 Follow proper position sizing and risk-reward rules.
📌 Execute trades only if market conditions remain stable around breakout levels.
📌 Maintain discipline — avoid emotional trades.
⚠️ Disclaimer
❗ This is purely for educational and informational purposes.
❗ I am not a SEBI-registered analyst.
❗ Please consult your financial advisor before making any investment or trading decisions.
❗ Trading in the stock market involves significant risk.
NIfty Hourly Strong SupportHello Friends,
Nifty Spot at 26050-60 having support of EMA100 along with trendline support and RSI oversold in hourly ......Overall Momentum is Bullish this is good DIP expceting 26400,26500,26700+ in coming few sessions
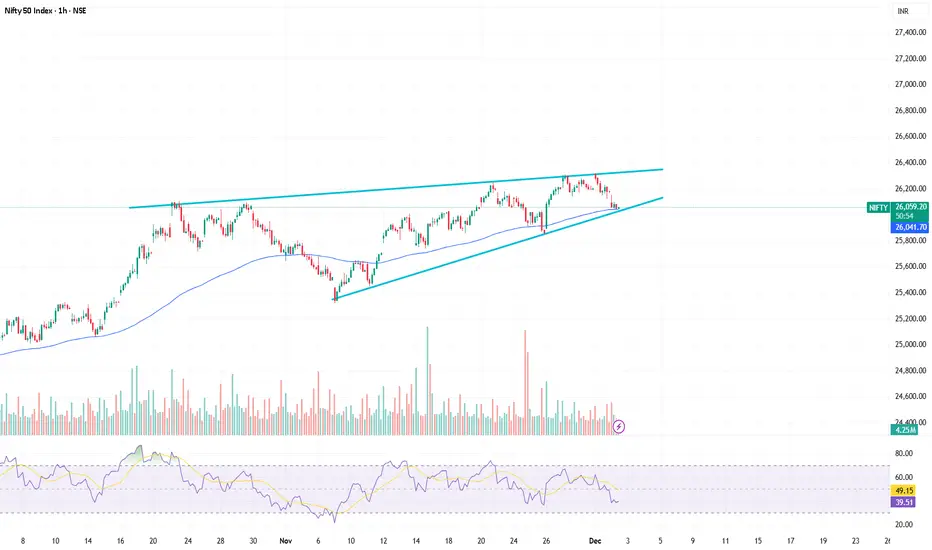
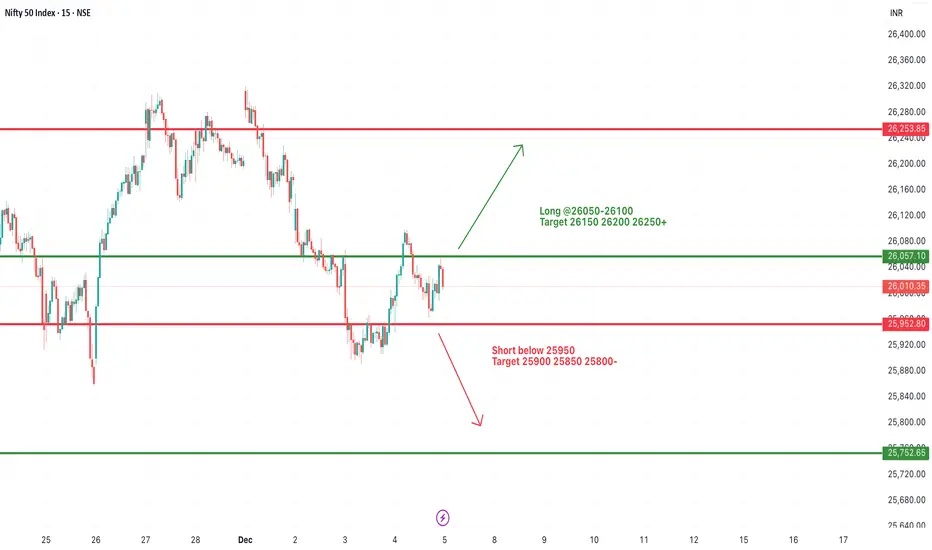
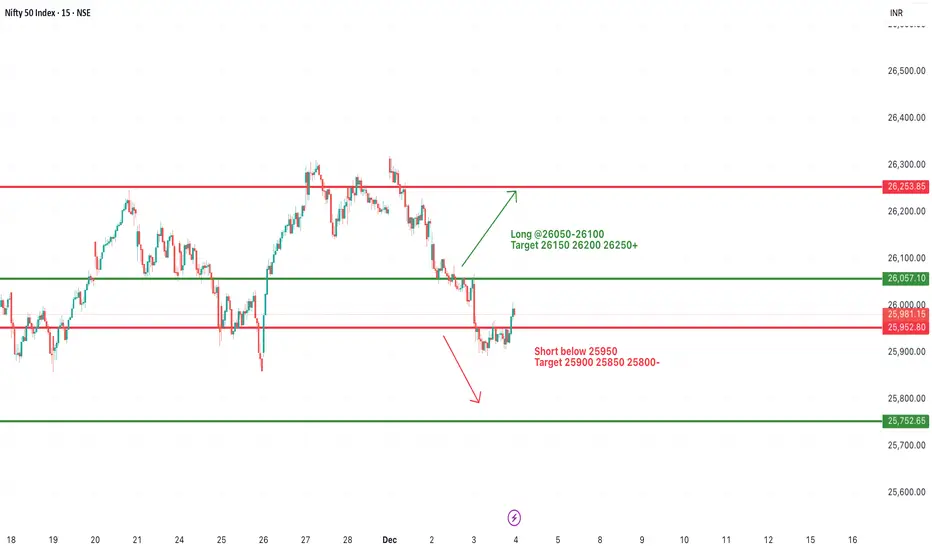
#NIFTY Intraday Support and Resistance Levels - 04/12/2025Nifty is set for a negative opening again today. This keeps the index positioned near its short-term support cluster, showing that buyers are still hesitant to step in aggressively. A weak start usually means the market may first test lower levels before any meaningful recovery attempt. If the index stabilizes after the open and climbs back above 26050 to 26100, the long setup becomes active. Clearing this zone will hint that buyers are absorbing the early dip. If that happens, upside targets open toward 26150, 26200, and 26250+. Sustained strength above 26250 can extend the move toward the upper resistance.
If early recovery fails and the index slips below 25950, the bearish continuation picks up. That breakdown will activate the short setup with targets at 25900, 25850, and 25800-. A move below 25800 will show that sellers remain dominant and that the next support band near 25750 could come into play.
Overall, with a negative opening, the first pullback or bounce will decide the tone. If sellers defend every bounce near 26050 to 26100, pressure is likely to continue downward. If buyers hold the dip and flip that zone into support, the day can shift into a recovery-driven session. Watching the trigger levels precisely will help avoid false moves in this tight swing structure.
Nifty 50 Price Structure Analysis [10/12/2025: Wednesday]Top-Down Nifty 50 Price Structure Analysis for 10th of December 2025. The day is Wednesday.
(1) Monthly Time Frame:
Red piercing candle. Sign of indecision and trend exhaustion. Major resistance is at level 26000. Major support is at level 25700. The view is indecision to bearish.
(2) Weekly Time Frame:
Red marubozu with weak lower wick. The previous week's candle is also a red hanging man. Today's price gave a breakdown below 3 weeks of consolidation. Signs of trend reversal and previous trend exhaustion. The zone of 25950 - 25900 is a major resistance. The zone of 25750 - 25700 is a major support. The view is bearish.
(3) Daily Time Frame:
Today's candle is kind of a red spinning top or long-legged doji with a small body. The candle shows a breakdown below the level 25900. The day is highly indecisive with a bearish bias. The zone of 25950 - 25900 is a major resistance. The zone of 25750 - 25700 is a major support. The view is bearish.
(4) 30-Minute Time Frame:
Price showed the neck breakdown of the classical head & shoulder (H&S) pattern. The zone 25950 - 25900 is a major resistance. The zone of 25750 - 25700 is a major support. The gap in the zone of 25750 - 25700 still remains unfilled. Today's price broke level 25900 and again got rejected from the same level. Additionally, price strategically expired below the level 25900 but above the level 25800. The price structure of lower highs and lower lows is intact. Thus, the institutional bias is negative. Every up move should be doubted. The view is bearish.
Events:
No expiries on Wednesday. However, the FED interest rate decision is on 11 December (the day after). Expecting high volatility.
Bullish Scenario Set-Up:
(i) Price sustains above the opening price.
(ii) Price starts to build a higher highs and lower lows price structure above the level 26000 (which is a distant level).
(iii) Every up move till the upper breach of level 26000 should be doubted.
Bearish Scenario Set-Up:
(i) Price sustains below the opening price.
(ii) Price starts to trade below the level 25800.
(iii) If the price sustains below the level 25800, there is a higher chance of the price breaking down the level 25700.
No Trading Zone (NTZ): 25900 - 25800.
Hypothesis and Insights from the Trading Plan:
(i) Take bearish trades only as institutional bias is bearish.
(ii) Any up move should be doubted. Bulls are weak.
(iii) The only indication of bullish trades will initiate when the price starts to trade above the level 26000 (which is a distant level). The chances are very low.
(iv) Strong resistance zone is (25950 - 25900).
(v) Minor support zone is (25750 - 25700).
(vi) The neckline of the H&S pattern is broken, confirming the initiation of the bearish phase of at least 400 points (considering the previous range of consolidation).
(vii) If level 25700 is broken, then a free fall is inevitable.
(viii) No Trading Zone (NTZ): (25900 - 25800).
(ix) Trade only when either bullish or bearish conditions are fulfilled. Otherwise, don't trade. Protect your resources.
NOTE:
"Mark your points. Trade your points. Price is God. Anything can happen. Therefore, trade what you see, not what you believe."
Happy Trading!

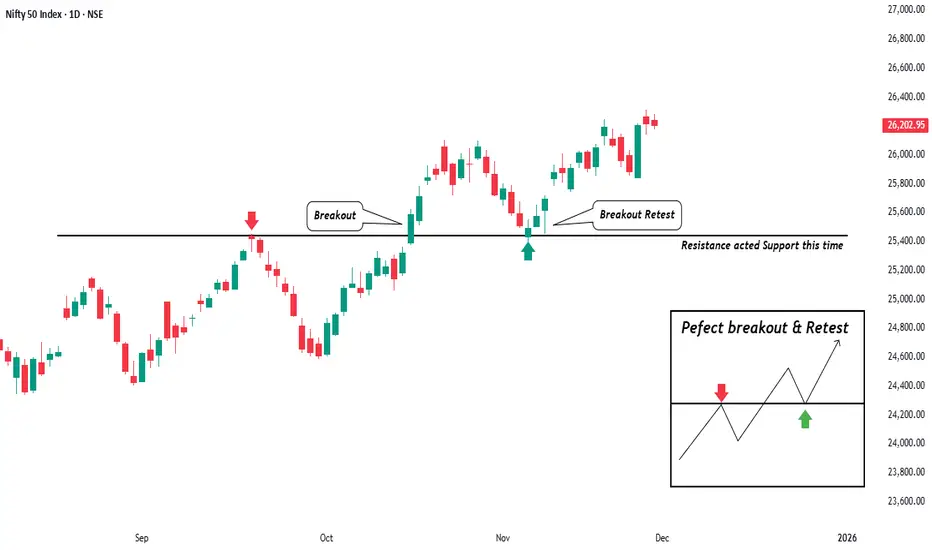
Breakout Retest Perfect PictureHello TradingView community, friends, and fellow traders.
I hope everyone is doing well with patience and clarity. Sharing a fresh price action observation on Nifty that clearly shows one of the most important concepts every trader should understand how the market behaves after a breakout.
On this chart, price had been facing repeated rejection from the same area, showing that it was a strong resistance zone. Sellers were clearly active at that level and price struggled to move higher. When price finally broke above this level with strength, it was the first sign that buyers were starting to take control.
What makes this setup valuable is not just the breakout itself, but what happened next. Instead of continuing straight upward, price came back to test the same area from above. This is the moment where most traders get confused, and many exit early or panic. In reality, this retest is the market checking whether the breakout was genuine or not.
When the old resistance starts acting as a support, it confirms something very important the market has accepted a new price range. This shift is known as role reversal, where selling pressure is replaced by buying interest. It also shows that buyers are now willing to defend the same level that sellers once controlled.
This is why breakouts should not be chased blindly. A breakout without confirmation often leads to false signals, but a breakout followed by a successful retest builds trust in the structure. The retest gives traders a chance to see whether the level holds and whether the trend is likely to continue.
As long as price remains above this support zone, the bias stays positive and the trend favors buyers. If price starts closing below this level, it would indicate weakness and failure of structure. The chart always gives clarity we just need to read it without emotion.
The biggest lesson here is patience. Markets reward those who wait for confirmation, not those who rush for entries. Breakout shows intention, but retest shows strength.
I hope this idea helps you see structure more clearly and trade with more confidence. Always remember, price action is not random. It tells a story, and every level has meaning if you know how to read it.
Wishing you all clarity, discipline, and consistency in your trading journey.
Trade safe and stay focused.
Regards- Amit.
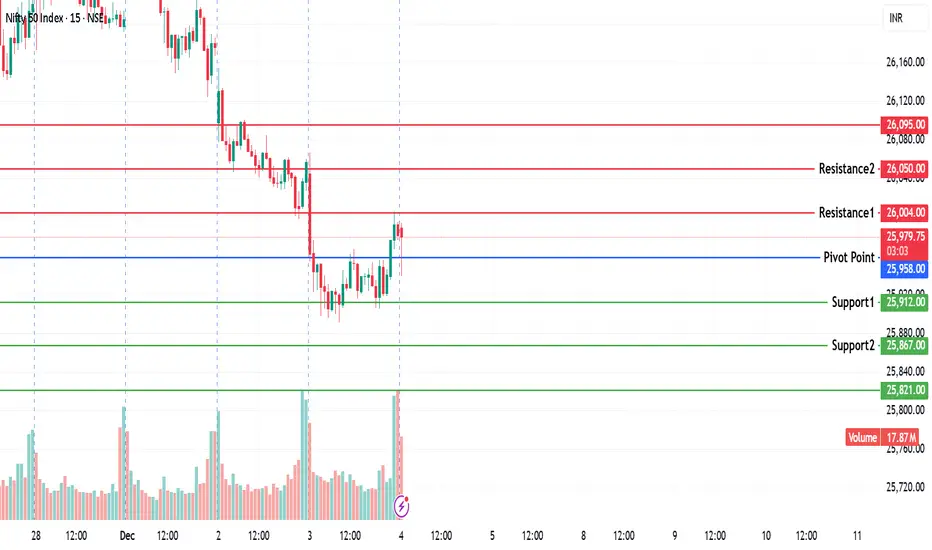
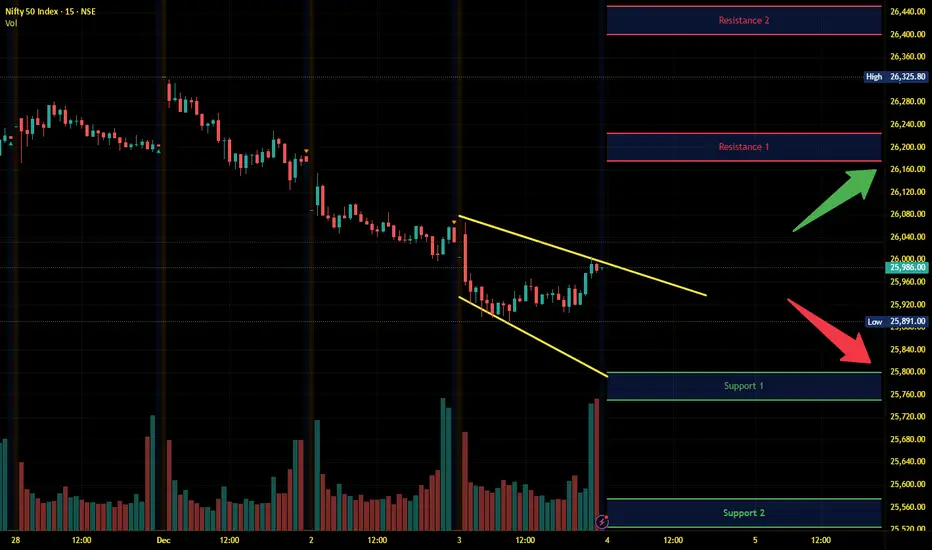
NIFTY KEY LEVELS FOR 04.12.2025NIFTY KEY LEVELS FOR 04.12.2025
Timeframe: 3 Minutes
If the candle stays above the pivot point, it is considered a bullish bias; if it remains below, it indicates a bearish bias. Price may reverse near Resistance 1 or Support 1. If it moves further, the next potential reversal zone is near Resistance 2 or Support 2. If these levels are also broken, we can expect the trend.
When a support or resistance level is broken, it often reverses its role; a broken resistance becomes the new support, and a broken support becomes the new resistance.
If the range(R2-S2) is narrow, the market may become volatile or trend strongly. If the range is wide, the market is more likely to remain sideways
please like and share my idea if you find it helpful
📢 Disclaimer
I am not a SEBI-registered financial adviser.
The information, views, and ideas shared here are purely for educational and informational purposes only. They are not intended as investment advice or a recommendation to buy, sell, or hold any financial instruments.
Please consult with your SEBI-registered financial advisor before making any trading or investment decisions.
Trading and investing in the stock market involves risk, and you should do your own research and analysis. You are solely responsible for any decisions made based on this research
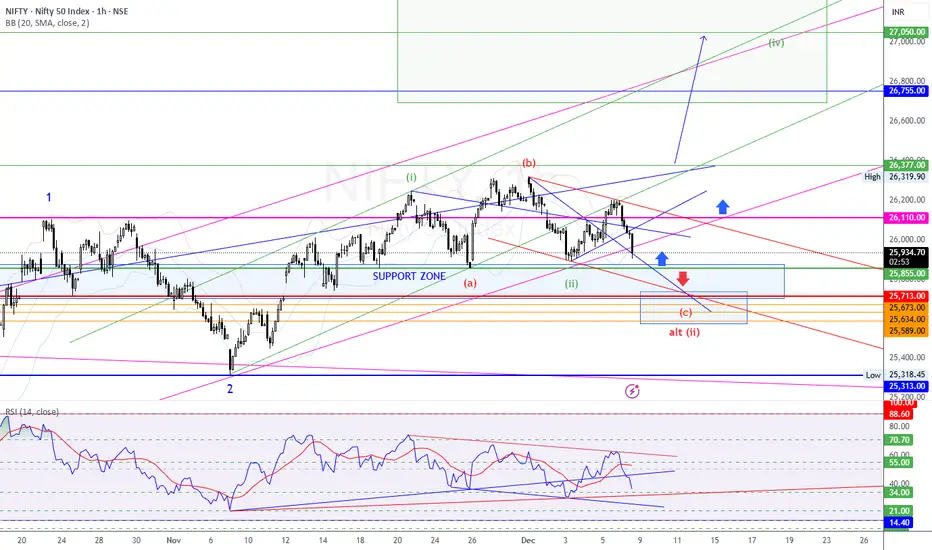
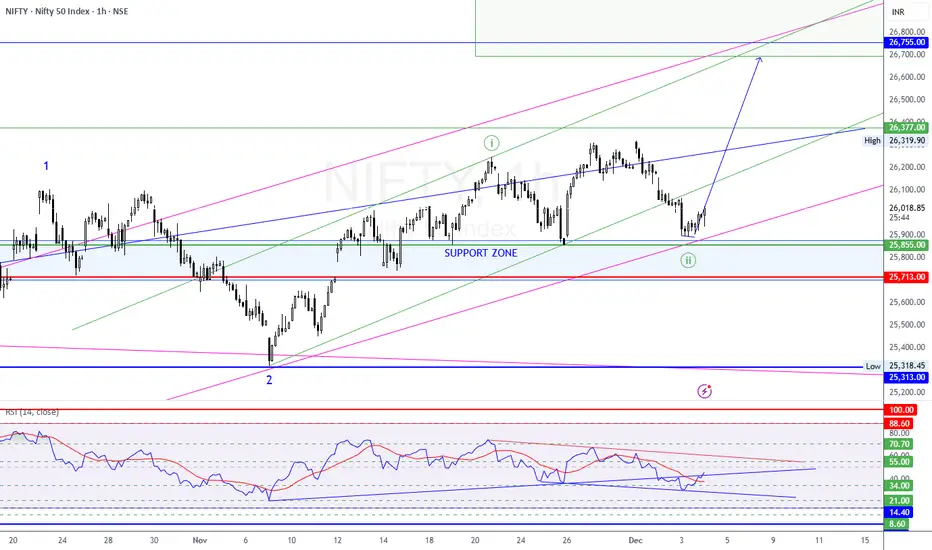
NIFTY 50 Elliott Wave Update | Wave (ii) Completing? Chart: 1 Hour | 8 Dec 2025
NIFTY is currently inside a corrective Wave (ii) structure following the completion of Wave (i).
The price has pulled back into a strong support confluence zone, aligning with:
Fib support region
Demand structure
Channel lower boundary
RSI oversold support trendline
📍 Wave Count Summary
Wave 1 – Completed at 26,377
Wave 2 – Low at 25,318
Wave (i) – Top at 26,377
Wave (ii) – Corrective pullback in progress (a-b-c)
Possible final c-wave target at 25,855 – 25,634
Two possible scenarios
🅰 Primary View
Wave (ii) finishes inside 25,855 – 25,634 zone → breakout start of Wave (iii) targeting 26,755 – 27,050
🅱 Alternative View
Deeper flush toward 25,589 – 25,473 before strong reversal
🎯 Upside Targets
Target Level
Target 1 26,110
Target 2 26,377
Wave (iii) Major Target 26,755 – 27,050
Extended Target 27,550+
🛑 Invalidation Levels
Level Meaning
25,589 Alt (ii) still valid
25,318 Impulsive bullish structure invalidated
📊 RSI Analysis
RSI approaching trendline support
No bearish divergence near highs → structure supports continuation
Expecting bullish reversal signal soon
🚀 Trade Setup (Educational Only)
Long Setup
Entry Zone: 25,855 – 25,634
Stop-Loss: 25,473
Targets: 26,110 / 26,377 / 26,755 / 27,050
Breakout Entry
Above 26,110 for momentum confirmation
🧠 Conclusion
NIFTY is positioned at a high-probability reversal zone for the start of a potential Wave (iii) rally.
Holding above 25,589 / 25,318 is critical for bullish continuation.
⚠ Disclaimer
This analysis is for educational and research purposes only and is not financial or investment advice.
Trading in financial markets involves risk, and past performance is not indicative of future results.
Please consult your financial advisor before making any investment decisions.
I am not responsible for any profits or losses incurred based on this analysis.
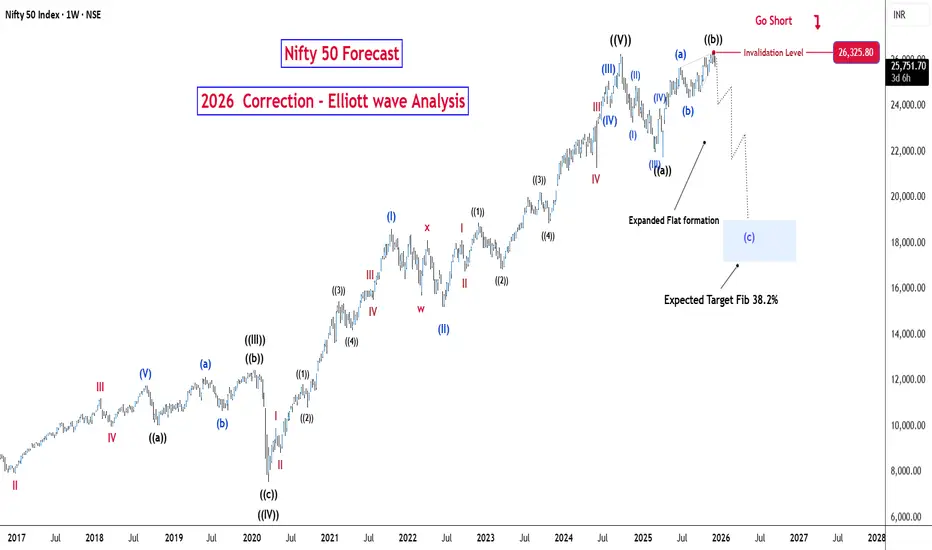
Nifty 50 - Elliott Wave Weekly Analysis (Updated)Nifty 50 Now in correction face of Grand super cycle . Already Wave A and B Completed. C wave starts now (forming Expanded / Irregular Flat) end up to Fib Retrace 38.2% so expected for correction in nifty 50 through Elliott wave theory so investors proper hedge your position or go short in FNO and big buying opportunity is coming soon...
Nifty 11th Dec OutlookNifty closed with weak volume, and that’s exactly what the structure suggests ahead of two major catalysts:
1) The US Federal Reserve rate decision tonight
2) BSE:SENSEX expiry tomorrow
This combination often suppresses volatility before the event and releases volatility after, which is visible on today’s chart.
1. Low Volume = Risk-Off Positioning, Not Bearish Conviction
Today’s declining volume reflects institutional caution:
Fed outcome tonight → uncertainty in US yields & dollar
Sensex expiry tomorrow → option writers avoid taking directional exposure
USD/INR at extreme levels
Nifty at critical HTF supports → shorts avoid pressing aggressively
This leads to range-bound weakness, not a breakdown.
2. Key Technical Levels Align With Higher-Timeframe Structure
Daily chart shows Nifty hovering near important supports:
25,700 → first structural support
25,550–25,600 → major higher-timeframe demand zone
RSI on the daily has dipped near 50, which historically acts as a pivot for relief bounces unless macro sentiment is extremely negative.
Importantly, Nifty rarely breaks below daily RSI-50 without a deep global risk trigger. At present, no such domestic negative catalyst exists.
3. Why a Sharp Fall Is Unlikely Unless the Fed Surprises
Two strong supports lie directly below price: 25,700 and 25,500.
Both require significant volume expansion to break.
Given:
Muted institutional participation today
Expiry pinning tomorrow
Traders waiting for clarity
No negative domestic triggers
A strong direct breakdown is lower probability.
If the Fed delivers a cut (25 or 50 bps) with neutral/dovish guidance, the knee-jerk reaction may even favour a bounce, not a continuation of the fall.
4. Sensex Expiry Adds Another Layer of Price Compression
On the session before expiry, option writers:
Avoid committing to a direction
Keep the index pinned near max pain
Do not encourage volatility
Avoid large stop-runs or breakouts
This creates the low-range, low-volume drift we saw today.
Tomorrow, expect:
Early volatility due to Fed
Midday compression due to expiry
Final-hour positioning swings
5. Two Main Scenarios for Tomorrow
🟥 Scenario 1: Downside (needs Fed hawkishness)
Break of 25,700 opens 25,600 → 25,550
For deeper downside, Fed must surprise with a restrictive tone
Weak USD/INR or heavy FII selling would intensify this
But without strong volume, supports should hold.
🟩 Scenario 2: Upside / Relief Bounce (if Fed is neutral or dovish)
Nifty can rebound toward 25,900–26,050
Expiry pinning likely caps it below 26,200
RSI structure supports an upside reaction from current levels
This scenario is more consistent with today’s price behaviour.
6. My Bias
Base Case:
Sideways to slightly positive, unless the Fed delivers a negative surprise.
Directional clarity will likely appear after the first hour tomorrow, once global reactions settle and expiry flows align.
Conclusion
Today’s low volume was a sign of anticipation, not weakness.
Nifty is sitting near strong supports, and with Fed outcome + expiry both in play, the next move will be driven by global cues rather than pure technicals.
A sharp breakdown requires both volume and a negative macro shock — neither is present yet.
A relief bounce or sideways consolidation is the higher-probability outcome unless the Fed turns unexpectedly hawkish.

#NIFTY Intraday Support and Resistance Levels - 09/12/2025Nifty is expected to open slightly gap-down today, indicating mild selling pressure at the start of the session as the index continues to trade near the lower end of its consolidation range. A slightly gap-down opening suggests that the market sentiment remains cautious, with sellers still showing strength around resistance zones. If the index slips below 25950 after opening, the short setup becomes active with downside targets of 25850, 25800, and 25750-. A breakdown below 25750 may further extend weakness, potentially dragging Nifty toward deeper support levels, especially if global cues remain negative.
On the upside, any recovery from lower levels will need to sustain above 26050 to activate the long setup, with upside targets of 26150, 26200, and 26250+. A stable move above this zone will indicate that buyers are attempting to reclaim control and push the index out of the consolidation zone. However, until a breakout above 26050 occurs, the momentum is likely to stay muted or choppy.
Overall, with a slightly gap-down opening expected, the early bias remains mildly negative. The first hour will be crucial in deciding whether Nifty extends its downward momentum or attempts a pullback from the lower support band. Traders should monitor the breakout and breakdown levels closely, as a decisive move beyond these zones will determine the intraday trend.

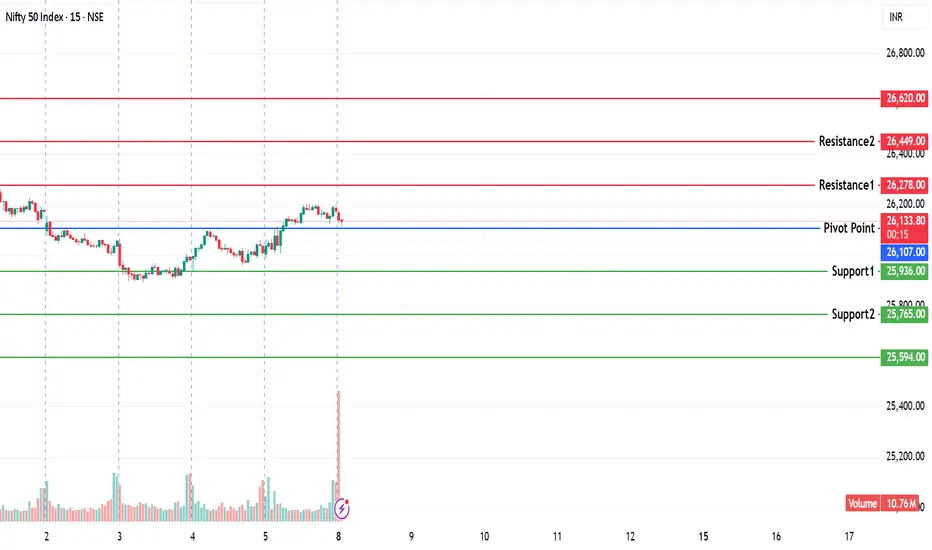
NIFTY KEY LEVELS FOR 08.12.2025NIFTY KEY LEVELS FOR 08.12.2025
Timeframe: 3 Minutes
If the candle stays above the pivot point, it is considered a bullish bias; if it remains below, it indicates a bearish bias. Price may reverse near Resistance 1 or Support 1. If it moves further, the next potential reversal zone is near Resistance 2 or Support 2. If these levels are also broken, we can expect the trend.
When a support or resistance level is broken, it often reverses its role; a broken resistance becomes the new support, and a broken support becomes the new resistance.
If the range(R2-S2) is narrow, the market may become volatile or trend strongly. If the range is wide, the market is more likely to remain sideways
please like and share my idea if you find it helpful
📢 Disclaimer
I am not a SEBI-registered financial adviser.
The information, views, and ideas shared here are purely for educational and informational purposes only. They are not intended as investment advice or a recommendation to buy, sell, or hold any financial instruments.
Please consult with your SEBI-registered financial advisor before making any trading or investment decisions.
Trading and investing in the stock market involves risk, and you should do your own research and analysis. You are solely responsible for any decisions made based on this research
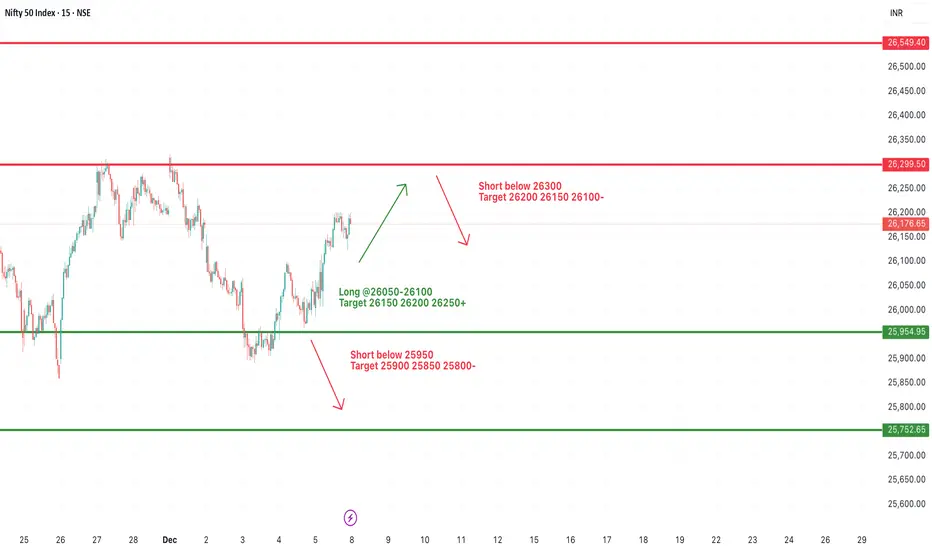
#NIFTY Intraday Support and Resistance Levels - 08/12/2025A positive opening indicates early strength and shows that buyers are still attempting to take control inside this wider range. Even though the index opens strong, the main direction will only become clear once it sustains beyond the upper or lower trigger zones marked on the chart.
If price holds above 26050 to 26100, the long setup stays active. Targets remain 26150. 26200. 26250+. A stronger breakout above 26300 can extend the upside toward 26200. 26150. 26100- once the supply zone gets cleared.
If the positive open fades and the index rejects the 26100–26050 range, weakness can return. The short setup will trigger below 25950. Downside targets continue to remain 25900. 25850. 25800-. A deeper slip below 25800 opens the next support around 25750.
Positive openings often create traps near resistance. First trap is a fake push above 26100, and the second trap is a pullback that fails to hold 26050. Waiting for proper sustain above or below these ranges will keep the entries cleaner and reduce unnecessary risk.
#NIFTY Intraday Support and Resistance Levels - 10/12/2025Nifty is likely to open gap-down today, indicating continued weakness in the short term as the index remains below the consolidation zone and is struggling to reclaim the upper resistance levels. A gap-down start around 25900–25880 keeps the bearish sentiment intact, and any early pullback may face selling pressure near 25950–25900, which is now acting as a supply zone. As long as Nifty trades below this band, short positions remain favorable with downside targets of 25850, 25800, and 25750-, where the next minor support lies. If selling pressure continues, a breakdown below 25700 will open the door for a deeper fall toward 25650, 25550, and 25500-, making this the major level to watch for a trending move.
On the upside, a recovery will only gain strength if Nifty sustains above 26050, triggering fresh long opportunities toward 26150, 26200, and 26250+, but with global cues weak and a gap-down expected, a strong upside push looks less likely during the initial session. Overall, the market bias remains bearish unless Nifty re-enters the consolidation zone and shows strength above 26000. Traders should focus on breakdown levels rather than reversal trades, as opening volatility after a gap-down can create sharp intraday movements favoring the downside.

Nifty sell recommended today morning if 25900 break then 25500 Parameter Data Data
Asset Name Nifty 50 (NSEI)
Last Traded Price (LTP) 🔴 25,960.55 (Reference: Dec 8, 2025 Close)
Price Movement 🔴 Negative (approx. -0.86% down)
Current Trade 🔴 Expansion Phase (Bearish) Active
SMC Structure 🔴 Bearish Order Flow (26,000 ke neeche decisive daily close, confirming a Break of Structure - BoS)
Trap/Liquidity Zones Demand Zone: 25,700 - 25,800 (Major structural support/Lower channel boundary)
Probability 🔴 High (75% chance of retesting 25,700 in the near term)
Risk Reward (R:R) 1 : 1.5
Confidence 🔴 High (Strong technical indicators support the sell-off)
Max Pain 26,100 (For current weekly expiry)
DEMA Levels 🔴 Bearish Cross (Price trading below 20-day and 50-day DE-MA)
Supports S1: 25,900, S2: 25,700, S3: 25,600
Resistances R1: 26,096 (Previous day close), R2: 26,240 (Max Call OI), R3: 26,350
ADX/RSI/DMI RSI (14): 🔴 35.37 (Sell/Oversold territory ki taraf)
ADX (14): 🔴 39.94 (Strong Trend Strength - Bearish)
Moving Averages: 🔴 Strong Sell
Market Depth Requires live data
Volatility 🟢 High (India VIX: 10.76, up 4.26%)
Source Ledger NSE India/API Data Aggregate
OI (Open Interest) 🟡 High (Index futures OI is high)
PCR (Put Call Ratio) 🟡 1.1924 (OI based, neutral to slightly overbought)
VWAP Price is trading below daily VWAP.
Turnover 🟡 Moderate/High (Volume was higher than average due to selling)
Harmonic Pattern No active pattern.
IV/RV 🟡 Moderate (IV is rising with VIX)
Options Skew Requires live Options Data
Vanna/Charm Requires live Options Data
Block Trades Needs specific data
COT Positioning No standard Nifty COT data released by CFTC
Cross-Asset Correlation 🔴 Negative (Negative correlation with USD/INR which is rising - 90.17)
ETF Rotation 🔴 Outflow (Index-linked ETFs mein selling pressure)
Sentiment Index 🔴 Bearish (Market breadth is negative)
OFI (Order Flow Index) Requires live Market Depth
Delta 🔴 Negative (Overall directional bias is down)
VWAP Bands Requires live data
Rotation Metrics 🔴 Sector Rotation (Realty aur IT mein zyada selling)
Market Phase 🔴 Expansion (Bearish Move)

NIFTY - Approaching HARMONIC SHARK PRZ at 25920TF: 1 hour
25920 could be the decisive zone and possibly a great entry point too in terms of low risk set up.
Harmonic Shark pattern is visible and the PRZ is at 25920
The hourly 200 EMA is also placed around the same level
So is the Trendline from the September lows.
It also happens to be the demand zone where the price took off quite strongly.
Wait for price action with reversal signs..
Disclaimer: I am not a SEBI registered Analyst and this is not a trading advise. Views are personal and for educational purpose only. Please consult your Financial Advisor for any investment decisions. Please consider my views only to get a different perspective (FOR or AGAINST your views). Please don't trade FNO based on my views. If you like my analysis and learnt something from it, please give a BOOST. Feel free to express your thoughts and questions in the comments section.

Nifty Intraday Analysis for 04th December 2025NSE:NIFTY
Index has resistance near 26175 – 26225 range and if index crosses and sustains above this level then may reach near 26400 – 26450 range.
Nifty has immediate support near 25800 – 25750 range and if this support is broken then index may tank near 25575 – 25525 range.
Rangebound moment expected with reversal from resistance and support zone before the RBI MPC Outcome.
NIFTY 1H – Elliott Wave View | Support Held - 4-DEC-2025NIFTY respected the support zone around 25,855 – 25,900 and reacted strongly, confirming a potential wave (ii) low. As long as this support holds, the bullish structure remains intact.
Key Levels
🟩 Support Zone: 25,855 – 25,900
🔻 Major Support: 25,713
📌 Above 25,713, bullish momentum continues
Upside Targets
🎯 26,377
🎯 26,755 (Major resistance + projected Wave (iii) completion)
Technical Notes
RSI showing bullish divergence + trendline breakout attempt
Price bouncing from channel support & Fib zone
Wave (iii) upside structure remains valid above support
Trade Bias
📌 Buy on dips near 25,855–25,900
📌 Holding above 25,713 keeps bullish trend intact
📌 Break above 26,377 may accelerate momentum towards 26,755
View
Expect upward move towards 26,377 / 26,755 if support holds
Disclaimer
Educational Elliott Wave study. Not financial advice. Trade with risk management.
Nifty view for upcoming daysNifty technical view
Nifty traded near ATH, We thought that once it grabes small LQ , than going toward 26080,26000 that would be the good level for upside with sl.
once weekly candle close below it, than we have to think 25800.
thanks,
take care

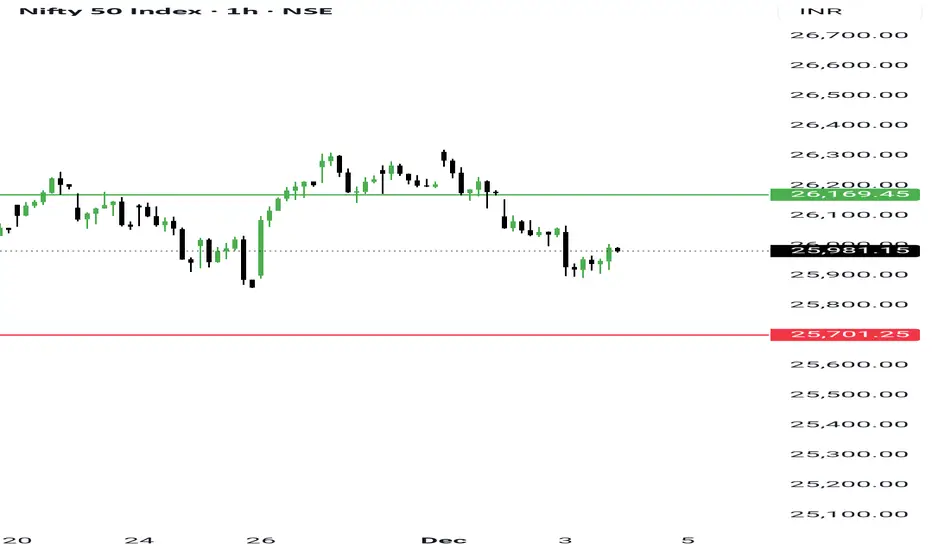
Nifty Hits Targeted Support — Bounce Expected, But Weakness StilNifty Hits Targeted Support — Bounce Expected, But Weakness Still Not Over
NSE:NIFTY hit our targeted support today, so we exited the shorts we were carrying.
I already shared the update with all of you here.
I entered the 26300 PE (30 Dec) at 222 yesterday and exited today at the mentioned target, capturing nearly 80% of the move.
Having a solid week already! 🎉
Now Nifty has almost touched our projected support zone and bounced from there — exactly as expected.
However, the overall weakness is still present.
So the Sell-On-Rise plan remains active.
- Nifty’s Pivot is now 25981 with a Pivot Percentile of just 0.02%.
- The Macro Index also moved higher today.
Both of above points indicate a bounce probability for tomorrow.
The key resistance I’m watching is 26088.
If Nifty sustains above this level, the Sell-On-Rise plan becomes invalid.
The idea is simple:
Use this bounce to short when
• sellers’ volume appears near the day high, or
• support breaks again.
These are the two short setups I’ll be watching.
On the equity side, setups are still limited, but the Auto sector looks strong and I’ve shortlisted a few names from there.
That’s all for now.
Take care. Have a profitable tomorrow.