Bottom-fishing in Nifty? Good retraction in nifty today, we can see a solid base foundation. Great trade emerging for lunch today. Can hold for Monday as well. Overall structure is bullish. Trade with a buy setup.
Trade ideas

Indian Trading Market Surge: Dynamics, and Future Outlook1. Overview of the Indian Trading Market
The Indian trading market comprises several interconnected components—equities, derivatives, commodities, currencies, bonds, and mutual funds. The two major stock exchanges, the Bombay Stock Exchange (BSE) and the National Stock Exchange (NSE), form the backbone of India’s equity market, collectively handling billions of dollars in daily turnover.
The NSE, established in 1992, has become one of the largest exchanges globally in terms of derivatives trading volume, reflecting India’s growing sophistication in financial instruments. Meanwhile, the BSE, Asia’s oldest exchange (founded in 1875), continues to serve as a cornerstone for equity listings and small and mid-cap trading.
India’s market participation has surged dramatically, driven by increased retail investor involvement, mutual fund inflows, and foreign institutional investment. With over 150 million Demat accounts as of 2025, the Indian market is no longer dominated solely by institutional players; the participation of ordinary citizens has become a defining trend.
2. Economic Foundations Behind the Surge
The surge in India’s trading market is deeply rooted in the nation’s strong economic fundamentals. The Indian economy has consistently been one of the fastest-growing in the world, with GDP growth averaging 6–7% annually over the past decade.
Several economic factors have supported this upward trend:
Demographic Dividend: India’s young and growing population contributes to higher consumption, innovation, and workforce participation, driving demand across sectors.
Urbanization and Industrial Growth: The shift toward urban centers has boosted infrastructure, housing, and manufacturing demand, stimulating capital markets.
Government Reforms: Initiatives like Make in India, Digital India, and Atmanirbhar Bharat have encouraged domestic production and investment, improving corporate profitability and investor sentiment.
Stable Monetary Policy: The Reserve Bank of India (RBI) has maintained a balanced approach to inflation and liquidity, providing macroeconomic stability that attracts long-term investors.
These structural strengths have made the Indian market a preferred destination for both foreign institutional investors (FIIs) and domestic institutional investors (DIIs).
3. Role of Retail Investors and Digital Transformation
One of the most remarkable developments in the Indian trading surge is the rise of retail participation. Digitalization and fintech innovation have democratized access to financial markets. Online brokerage platforms such as Zerodha, Groww, Upstox, and Angel One have empowered millions of Indians to trade seamlessly through smartphones.
Between 2020 and 2025, the number of retail investors in India nearly tripled, largely due to:
Low-cost trading platforms and apps
Zero-commission investing
User-friendly interfaces and educational tools
Pandemic-induced financial awareness and savings redirection
The COVID-19 pandemic, ironically, acted as a catalyst. During lockdowns, retail investors turned to the markets as a means of wealth creation. Lower interest rates and increased liquidity made equities more attractive compared to fixed deposits and other traditional instruments.
This retail revolution has added depth and liquidity to the Indian markets, reducing volatility caused by institutional flows. It also signifies a structural shift—Indians are increasingly viewing equities not as speculation but as long-term investment vehicles.
4. Institutional and Foreign Investment Dynamics
Foreign Institutional Investors (FIIs) play a pivotal role in shaping market sentiment. The steady inflow of FII capital, particularly into sectors such as banking, technology, and infrastructure, has fueled the Indian market surge.
Despite occasional sell-offs due to global uncertainties—like interest rate hikes in the U.S. or geopolitical tensions—India has consistently attracted capital due to its:
Political stability
Transparent regulatory framework
Expanding consumer base
Rapid digital adoption
Domestic Institutional Investors (DIIs), including mutual funds, insurance companies, and pension funds, have also grown in strength. Their counter-cyclical investments often stabilize markets during FII withdrawals.
The rise of Systematic Investment Plans (SIPs) has made mutual fund inflows more consistent, providing a steady stream of liquidity into equities. As of 2025, monthly SIP inflows in India exceed ₹20,000 crore, marking an all-time high.
5. Sectoral Performance and Market Leadership
The surge in the Indian trading market has not been uniform across sectors. Certain industries have emerged as clear leaders in driving growth and investor confidence.
Information Technology (IT): Companies like Infosys, TCS, and Wipro have maintained strong global demand, benefiting from digital transformation trends.
Banking and Financial Services: The sector remains a backbone of the economy, with private banks and fintechs expanding lending and payment ecosystems.
Pharmaceuticals and Healthcare: The pandemic spotlighted India’s pharma capabilities, and exports have remained robust post-2020.
Energy and Infrastructure: Renewable energy initiatives and government-led infrastructure projects have made this sector particularly attractive.
Manufacturing and EVs: The Make in India campaign and incentives for electric vehicle production have created a new wave of industrial growth.
Market indices such as NIFTY 50, SENSEX, and NIFTY NEXT 50 reflect these dynamics, with record highs achieved multiple times in 2024–2025. The broad-based nature of this rally underscores the market’s underlying strength.
6. Technological Advancements and Market Infrastructure
India’s financial infrastructure has evolved rapidly, supporting the market’s exponential growth. The introduction of T+1 settlement, advanced algo-trading systems, and AI-based analytics has made trading faster and more efficient.
Key innovations include:
Algorithmic and Quantitative Trading: Increasing adoption by institutional and retail traders has enhanced liquidity and reduced arbitrage opportunities.
Blockchain Integration: The use of blockchain for settlement and compliance is under exploration by regulators, promising greater transparency.
Digital KYC and e-Demat Services: Simplified onboarding has allowed faster investor registration.
Furthermore, India’s Unified Payments Interface (UPI) revolutionized digital transactions, indirectly supporting the trading ecosystem by increasing financial inclusivity and cashless participation.
7. Government Policies and Regulatory Support
A robust regulatory framework under the Securities and Exchange Board of India (SEBI) ensures transparency, fairness, and investor protection. SEBI’s initiatives—such as stricter IPO disclosures, tighter margin rules, and improved surveillance systems—have bolstered investor confidence.
The government’s policies have been equally pivotal:
Disinvestment and Privatization: Public sector divestments have increased market depth.
Tax Reforms: Simplification of capital gains taxation and incentives for start-up listings encourage participation.
Financial Inclusion: Initiatives like Jan Dhan Yojana and National Pension System (NPS) link the broader population to formal financial markets.
Collectively, these policies have positioned India as a model of regulatory stability among emerging markets.
8. Challenges and Risks Amid the Surge
Despite its impressive growth, the Indian trading market faces several challenges:
Valuation Concerns: Rapid price appreciation has led to elevated valuation levels in certain sectors, prompting fears of corrections.
Global Dependence: Foreign capital flows remain sensitive to global interest rates and geopolitical developments.
Corporate Governance Issues: Periodic corporate frauds or mismanagement cases can dent investor trust.
Liquidity and Volatility Risks: Retail-driven rallies may lead to short-term speculative volatility.
Additionally, macroeconomic shocks—such as inflation spikes, commodity price swings, or currency depreciation—can affect investor sentiment. Managing these challenges is essential for sustaining long-term growth.
9. The Rise of SME and Start-Up Listings
The SME (Small and Medium Enterprises) and start-up segments have become vibrant contributors to India’s trading surge. Exchanges like BSE SME and NSE Emerge provide platforms for smaller companies to raise capital efficiently.
India’s start-up ecosystem—home to over 100 unicorns—has increasingly turned to the domestic markets for funding. Successful IPOs of tech-driven firms have expanded investor exposure beyond traditional sectors, creating new wealth-generation opportunities.
10. Global Perception and India’s Strategic Position
India’s ascent in global markets has redefined its position in the international financial community. Major global investors, sovereign wealth funds, and pension funds have increased their India exposure, citing:
Resilience amid global volatility
Large domestic consumption base
Political and policy continuity
India’s inclusion in global bond indices and potential upgrades by credit rating agencies are further expected to attract billions in passive inflows. The country’s growing weight in emerging market indices has also enhanced its global relevance.
11. Future Outlook: Sustaining the Momentum
The outlook for the Indian trading market remains highly positive. Analysts expect continued growth, driven by:
Ongoing economic reforms and fiscal prudence
Expanding manufacturing and exports under China+1 supply chain diversification
Rising ESG (Environmental, Social, Governance) investments
Greater financial literacy and inclusion
Artificial intelligence, automation, and digital finance will further shape trading behavior, enabling smarter and faster decision-making.
However, sustaining the surge will require balancing growth with risk management, ensuring that market exuberance does not lead to speculative bubbles. Regulatory vigilance, corporate transparency, and investor education will be crucial pillars in this journey.
12. Conclusion
The surge in the Indian trading market is not merely a cyclical upswing—it represents a structural transformation in how India’s economy and capital markets operate. The convergence of strong economic fundamentals, technological empowerment, government support, and investor participation has positioned India as one of the most promising investment destinations in the world.
While challenges persist, the long-term story remains compelling. As India continues to innovate, industrialize, and integrate with the global financial system, its trading market is set to evolve into a powerhouse—reflecting not just the growth of an economy, but the confidence of a nation on the rise.

Short Mean Reversion Trade on NIFTYNIFTY could be witnessing some profit booking from the high levels that it had touched this week.
While the overall trend continues to remain Bullish on the Daily time frame, price does seem to be overbought.
On the 15 minutes chart, constant Lower Highs are being formed and yesterday's low is also breached now.
Short position can be taken for a Target to 25,520 price level which also happens to be the missed Weekly Pivot from this week.

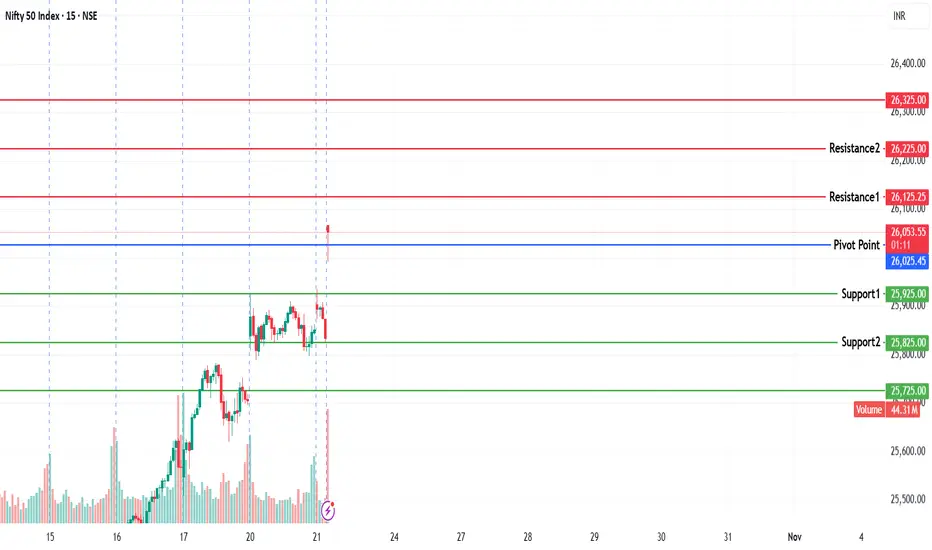
NIFTY KEY LEVELS FOR 24.10.2025NIFTY KEY LEVELS FOR 24.10.2025
Timeframe: 3 Minutes
If the candle stays above the pivot point, it is considered a bullish bias; if it remains below, it indicates a bearish bias. Price may reverse near Resistance 1 or Support 1. If it moves further, the next potential reversal zone is near Resistance 2 or Support 2. If these levels are also broken, we can expect the trend.
When a support or resistance level is broken, it often reverses its role; a broken resistance becomes the new support, and a broken support becomes the new resistance.
If the range(R2-S2) is narrow, the market may become volatile or trend strongly. If the range is wide, the market is more likely to remain sideways
please like and share my idea if you find it helpful
📢 Disclaimer
I am not a SEBI-registered financial adviser.
The information, views, and ideas shared here are purely for educational and informational purposes only. They are not intended as investment advice or a recommendation to buy, sell, or hold any financial instruments.
Please consult with your SEBI-registered financial advisor before making any trading or investment decisions.
Trading and investing in the stock market involves risk, and you should do your own research and analysis. You are solely responsible for any decisions made based on this research.

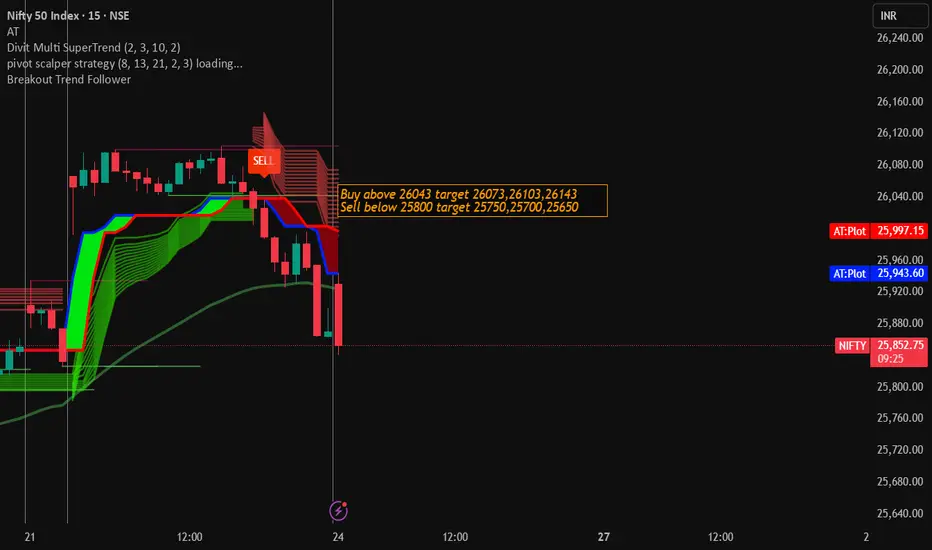
Nifty Trading Strategy for 24th October 2025📊 NIFTY Trading Setup for Today
🕒 Time Frame: 15-Minute Candle
🟩 Buy Setup
📈 Entry: Buy above the high of the 15-min candle if it closes above 26,043
🎯 Targets:
Target 1️⃣ — 26,073
Target 2️⃣ — 26,103
Target 3️⃣ — 26,143
🛑 Stop Loss: Below the breakout candle’s low
🟥 Sell Setup
📉 Entry: Sell below the low of the 15-min candle if it closes below 25,800
🎯 Targets:
Target 1️⃣ — 25,750
Target 2️⃣ — 25,700
Target 3️⃣ — 25,650
🛑 Stop Loss: Above the breakdown candle’s high
⚠️ Disclaimer:
💬 I am not a SEBI-registered analyst. The above analysis is for educational and informational purposes only. Please do your own research or consult a registered financial advisor before taking any trading decisions. 📚💡
#NIFTY Intraday Support and Resistance Levels - 24/10/2025Nifty is likely to open flat near the 25,850–25,880 zone, suggesting a neutral to cautious sentiment after recent volatility. The index is trading around a crucial support zone, and today’s session will be key in determining whether the market finds stability or continues its corrective move.
If Nifty sustains above 25,900–25,950, we can expect a gradual recovery toward 26,050, 26,150, and 26,250+ levels. A breakout above 26,050 may bring renewed buying momentum, potentially leading to a short-term trend reversal.
On the downside, immediate support lies near 25,750–25,700. A breakdown below this level could invite selling pressure, dragging the index toward 25,600 and 25,500 zones.
Overall, a flat opening indicates indecision among traders after recent swings. It’s advisable to trade with confirmation near breakout or breakdown levels and use strict stop losses to manage intraday volatility effectively.

NIFTY Levels for Today
Here are the NIFTY's Levels for intraday (in the image below) today. Based on market movement, these levels can act as support, resistance or both.
Please consider these levels only if there is movement in index and 15m candle sustains at the given levels. The SL (Stop loss) for each BUY trade should be the previous RED candle below the given level. Similarly, the SL (Stop loss) for each SELL trade should be the previous GREEN candle above the given level.
Note: This idea and these levels are only for learning and educational purpose.
Your likes and boosts gives us motivation for continued learning and support.

Why Some Believe Moon Phases Matter for the Stock MarketThe Moon's phases are the changing shapes of the Moon's illuminated portion as seen from Earth, caused by its orbit around our planet. The Sun always lights half of the Moon, but our view of that lit half varies over a cycle lasting about 29.5 days (a synodic month). There are eight primary phases, divided into four major ones (new moon, first quarter, full moon, last quarter) and four intermediate ones (waxing/waning crescent and gibbous).
On October 24, 2025, the Moon is in the waxing crescent phase, about 9% illuminated and roughly 3 days old since the previous new moon (which occurred around October 21). Look for it low in the western sky just after sunset. The next full moon is November 5 (Beaver Moon).
The idea that moon phases influence the stock market—often called the "lunar effect"—stems from behavioral finance, where subtle environmental cues like celestial cycles might subtly sway investor mood, optimism, and risk-taking. While mainstream economics dismisses it as pseudoscience or coincidence, several academic studies have uncovered statistically significant correlations between lunar cycles and market performance. These patterns suggest higher returns around new moons (waxing phase, symbolizing renewal and low energy) and lower returns or increased volatility around full moons (waning phase, linked to heightened emotions).
In short, moon phases aren't a crystal ball but offer a quirky lens on human irrationality in markets. If you're intrigued, overlay them on charts (e.g., via tools like TradingView) alongside fundamentals—but treat it as a tiebreaker, not gospel. For October 24, 2025 (waxing crescent, ~9% illuminated), studies suggest mild optimism; watch for full moon volatility on November 5.

Nifty 50 Price ActionNifty 50 is trading near 24,715 as of September 4, 2025, showing mild recovery after several sessions of volatility and weakness. The index has bounced back above the 24,600 support zone with improved breadth and higher volumes, but technical indicators reflect a cautious undertone. All short- and medium-term moving averages (5, 10, 20, 50) still point bearish, and bearish crossovers on 5-20 and 20-50 day averages reinforce negative momentum. Oscillators like MACD, stochastics, ROC, and CCI remain in bearish territory, while RSI sits neutral around 45, and William %R signals oversold conditions, suggesting the possibility of a short-term bounce.
Immediate resistance for Nifty is seen at 24,650–24,700, with a major hurdle near the 50-day moving average in the 24,850 area. A decisive move above these levels would strengthen bullish sentiment, potentially opening up the range to 25,250–25,500. On the downside, key support remains at 24,500, with stronger base near 24,250. A break below these supports could lead to extension of the recent pullback toward the 24,000 level.
The broader trend appears range-bound with slight positive bias, but foreign institutional investors have been net sellers, which has tempered upside momentum. Sectors like auto, capital goods, and select mid-cap stocks are attracting buyers, while defensive sectors remain subdued. For now, a cautious approach is advised, using “sell on rise” until Nifty can reclaim more short-term moving averages. Long-term trend remains bullish, suggesting dips should be viewed as buying opportunities for quality stocks, especially if domestic and global cues improve.

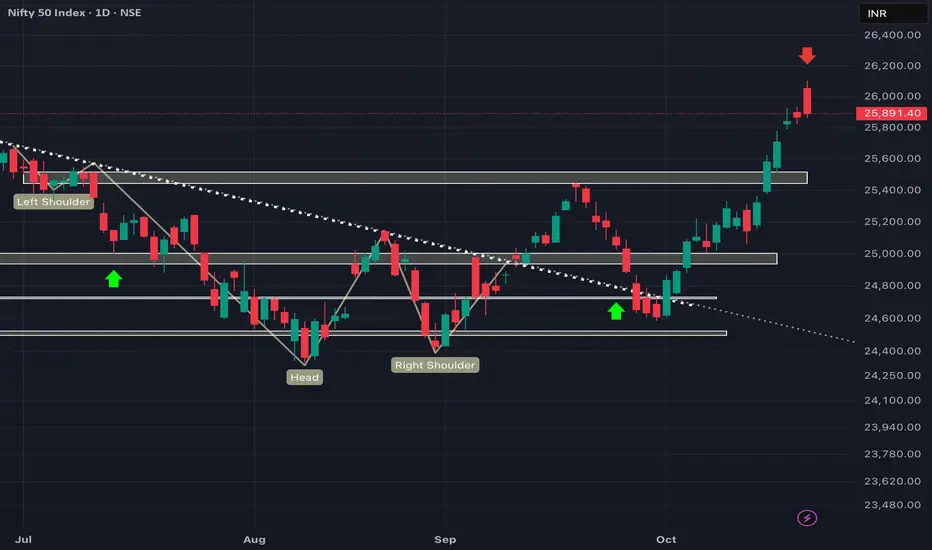
Signs of REVERSAL!!? As we can see NIFTY showed strong rejection forming marabozu candle in daily time frame showing rejection from 26000 levels as explained in previous post. Moreover, we can see NIFTY has filled the pending gap and hence we can expect NIFTY tp show weakness from here and hence until and unless NIFTY sustains itself above psychological level of 26000, every rise can be sold so plan your trades cautiously and keep watching everyone.
Rolling VWAP Market Structure🟠 Rolling VWAP Market Structure
This setup highlights how Rolling VWAP and its deviation bands reveal evolving market behavior through trend strength, volatility, and consolidation phases.
___________________________________________________________
📊 Chart Explanation
1️⃣ Bearish Bias – Price remains below VWAP, bands expand downward, and VWAP acts as dynamic resistance. Indicates seller dominance and potential continuation to the downside.
2️⃣ Narrow Bands – VWAP flattens while bands contract, showing reduced volatility. The market is likely preparing for the next directional move — either breakout or breakdown.
3️⃣ Bullish Bias – Price holds above VWAP, bands expand upward, and VWAP acts as dynamic support. Reflects buyer strength and continuation potential.
4️⃣ Post-Drop Consolidation – Candle closes below Rolling VWAP, suggesting possible consolidation before the next move. Often a pause zone where trend bias is reassessed.
___________________________________________________________
]📊 Summary:
Rolling VWAP dynamically adapts to price and volume, offering real-time insights into trend bias, volatility compression, and market equilibrium.
___________________________________________________________
⚠️ Disclaimer
📘 For educational purposes only.
🙅 Not SEBI registered.
❌ Not a buy/sell recommendation.
🧠 Purely a learning resource.
📊 Not Financial Advice.

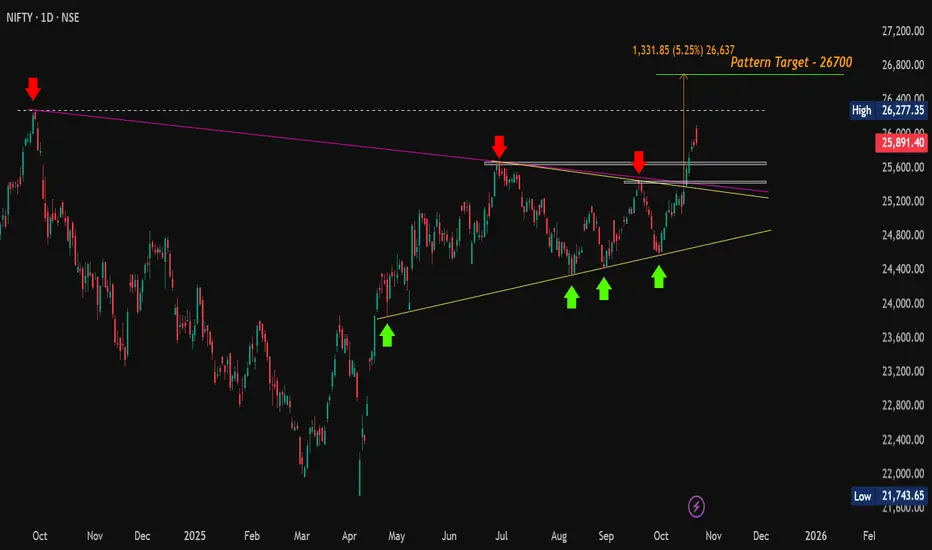
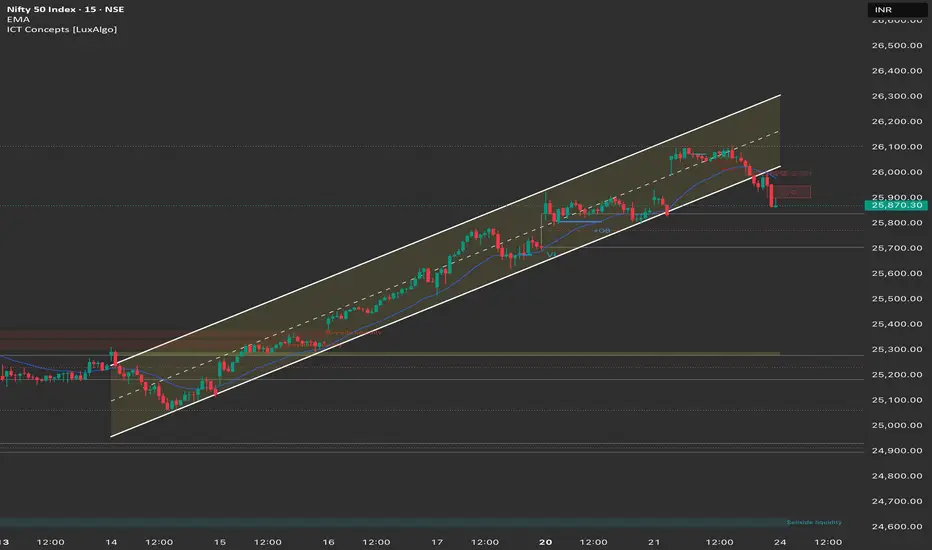
#Nifty | Breakout Confirmed, Now Eyes on Support for Next Move#Nifty Update (Daily):
CMP: 25,891.40
Following our previous update at 25,285, Nifty has decisively broken out above the Symmetrical Triangle pattern and surged to a high of 26,104 today. Price action formed a bearish candle but managed to close positively on the daily chart.
🔄 What to expect next?
A potential retest of breakout levels is likely as profit booking is expected after a strong rally of over 1,500 points from the swing low. Watch the key support zones closely for a possible bounce.
🔽 Support Zones to watch :
25,669 - 25,638
25,449 - 25,424
⚡️ If Nifty holds these levels and reverses, it could set the stage for a renewed upmove aimed at surpassing the all-time high (ATH) at 26,277.
🔼 Resistance Zones to watch :
26,104 (recent high)
26,216 - 26,277 (ATH)
📈 A sustained break above the ATH will confirm continuation toward the symmetrical triangle’s ultimate target near 26,700 .
#Nifty | #Nifty50 | #BreakOutRetest | #SymmetricalTriangle | #ChartPatterns | #SwingTrading | #PriceAction
📌 Disclaimer: This analysis is shared for educational purposes only. It is not a buy/sell recommendation. Please do your own research before making any trading decisions.
Consolidation Zone after 1100 point Move @NIFTY 50Recent Market Context
- Nifty rallied over 1,100 points from 25,068, showing strong bullish momentum.
- Each session saw gap-ups, mild profit booking, and closes near day highs.
- On Muhurat Trading Day (Tuesday), the market opened gap-up but closed below opening, hinting at short-term exhaustion.
What Happened Today
- The market opened ~180 points higher on positive news around Trump tariff policy.
- Tried holding above 26,050 in the first half but faced heavy selling later.
- Fell nearly 230 points from the day’s high, finally closing flat near 25,900.
Tomorrow’s Outlook
- After a strong sell-off, traders seem to be in a profit-booking phase.
- OI buildup at 26,000 calls signals strong resistance; support near 25,700.
- The market is likely to stay range-bound between 25,700 and 26,000 with 300-point volatility if no major news emerges.
Option Selling View
- Holding 25,800 & 25,900 straddles with ~230 total premium.
- Expecting time decay to work as long as price stays within range.
- Ideal setup for a neutral to mildly volatile market.
Key Zones
- Resistance: 26,104 / 25,888
- Support: 25,803 / 25,698

Nifty Structure Analysis & Trade Plan: 24th October
4-Hour Chart (Macro Trend)
Structure: The Nifty is in an Aggressive Bullish Momentum phase, trading within a steep ascending channel. The rally is strong, but the long upper wick on the recent 4H candle and the close far below the day's high (26,104.20) signal aggressive profit booking near the psychological 26,000 resistance area.
Key Levels:
Major Supply (Resistance): 26,100 - 26,300. This area is the key psychological and all-time high zone (ATH is 26,277.35).
Major Demand (Support): 25,600 - 25,700. This area aligns with the lower trendline of the ascending channel and is the must-hold zone for the continuation of the rally.
Outlook: The bias is Cautiously Bullish. The short-term structure is still positive, but the sharp intraday selling indicates a pause or consolidation is needed before a fresh breakout attempt.
1-Hour Chart (Intermediate View)
Structure: The 1H chart shows a clear rejection after the market traded to new 52-week highs. The index closed near the lower trendline of the ascending channel. The price has currently formed a FVG (Fair Value Gap) below the closing price, which may serve as a magnet for a morning correction.
Key Levels:
Immediate Resistance: 26,100 (Intraday high/point of rejection).
Immediate Support: 25,800 (Recent swing low/channel support).
15-Minute Chart (Intraday View)
Structure: The 15M chart confirms a Market Structure Shift (MSS) to the downside in the last hour of trading, with lower highs and lower lows forming from the day's peak. The market closed below the 9-period EMA, confirming intraday bearish control.
Key Levels:
Intraday Supply: 25,950.
Intraday Demand: 25,800.
Outlook: Bearish for the session open, favoring a "Sell on Rise" strategy into the consolidation area.
📈 Structure Analysis & Trade Plan: 24th October
Market Outlook: Nifty is undergoing a healthy profit-booking session after hitting the 26,100 resistance. The primary strategy will be to buy the dip at major support or short the failure at intraday resistance.
Bullish Scenario (Primary Plan: Buy the Dip)
Justification: The multi-day macro trend is intact, driven by FII inflows and positive trade deal talks. Dips should be seen as buying opportunities.
Entry: Long entry on a bounce and reversal from the 25,750 - 25,800 zone (Lower channel trendline).
Stop Loss (SL): Place a stop loss below 25,650 (below the main channel support).
Targets:
T1: 26,100 (Retest of today's high).
T2: 26,277 (All-Time High).
Bearish Scenario (Correction/Sell on Rise)
Justification: The sharp rejection from the intraday high indicates bears are active and will defend the 26,000 area.
Entry: Short entry on a decisive break and 15-minute candle close below 25,800 OR Short a retest and rejection of the 25,950 level.
Stop Loss (SL): Above 26,100 (above the intraday high).
Targets:
T1: 25,650 (Major FVG support/Lower channel).
T2: 25,500 (Major demand zone).
Key Levels for Observation:
Immediate Decision Point: 25,800 - 25,950 zone.
Bullish Confirmation: Sustained trade above 26,000.
Bearish Warning: A move below 25,800.
Line in the Sand: 25,600. A break below this level shifts the short-term bias to corrective.
NIFTY- Intraday Levels - 24th October 2025I have not added the possibel buffer levels, however due to Friday factor I believe it may have less impact, in nutshell be careful with the trading tomorrow.
My views (for your study and analysis only) is sell on rise.
If NIFTY sustain above 25925/30/34 above this bullish then around 25948/56 above this more bullish above this wait
If NIFTY sustain below 25877 below this bearish then around 25862 strong level if sustain below this more bearish then 25825/11 then 25788/25781 below this wait
Consider some buffer points in above levels.
Please do your due diligence before trading or investment.
**Disclaimer -
I am not a SEBI registered analyst or advisor. I does not represent or endorse the accuracy or reliability of any information, conversation, or content. Stock trading is inherently risky and the users agree to assume complete and full responsibility for the outcomes of all trading decisions that they make, including but not limited to loss of capital. None of these communications should be construed as an offer to buy or sell securities, nor advice to do so. The users understands and acknowledges that there is a very high risk involved in trading securities. By using this information, the user agrees that use of this information is entirely at their own risk.
Thank you.

Nifty 50 in my view will touch 23300 again if broke weekly loGiven present market momentum, 23,300 is now a distant support zone and the index is likely to remain well above this level unless there is a significant market correction or global event��.Earlier in January 2025, Nifty 50 faced hurdles near 23,500, and analysis from that period noted short-term bullish sentiment upon holding above 23,300��.However, looking at the current trend, touching 23,300 would require a substantial downturn in the market. With current bullish sentiment and institutional flows supporting higher levels, the probability of revisiting 23,300 in the short-term is low unless triggered by major negative news or profit booking that results in a deep correction��.

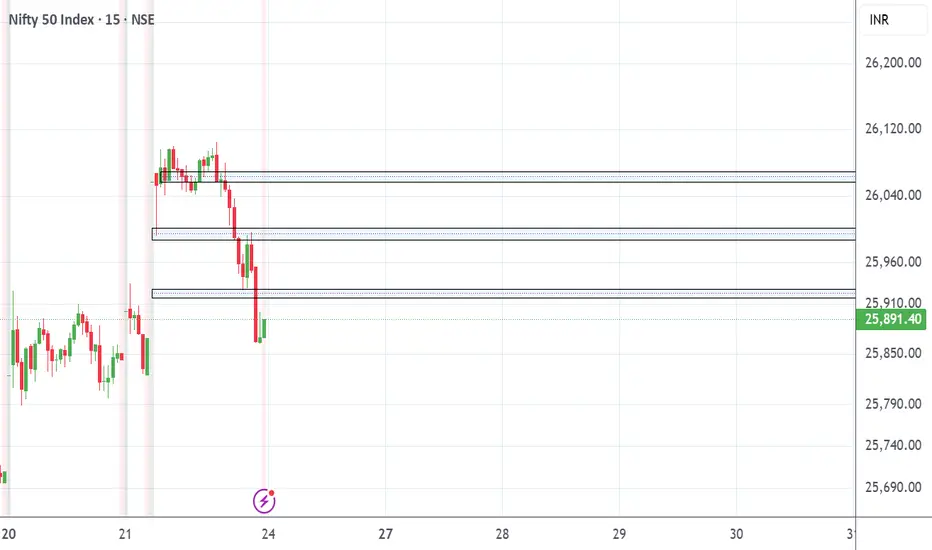
key levels for nifty 24.10.2025these boxed levels are the place where nifty may take reversals or breakouts.
Nifty - Elliot WavesNifty showed some strong recovery today and seems to be headed higher.
There are two possibilities - We just recover part of the fall in B and then head to 24k in C down or we make a new high till 25800 and then head down to 23800.
My favored count is the latter, why? Because I expect BNF to make a new swing high.
Also, why am I looking and a new low? - Bank Nifty did a 5 wave down, so at least one new low has to come in another 5 waves down till 50-51k (I am expecting a deeper cut till 45-46k - but leaving that for later)
BNF counts:
In any case - we are good for a run up for a few days if not weeks in the market - look for pockets of strength and participate - I like realty, defense, IT and Pharma as RR is better there.
I feel auto, metals, PSU banks could be topping - I wouldn't bet on it though :)
All the best!

Nifty Intraday Analysis for 23rd October 2025NSE:NIFTY
A gap up opening is expected as strong signals are emerging about the finalization of the trade deal.
Index has resistance near 26000 – 26050 range and if index crosses and sustains above this level then may reach near 26200 – 26250 range.
Nifty has immediate support near 25700 – 25650 range and if this support is broken then index may tank near 25500 – 25450 range.

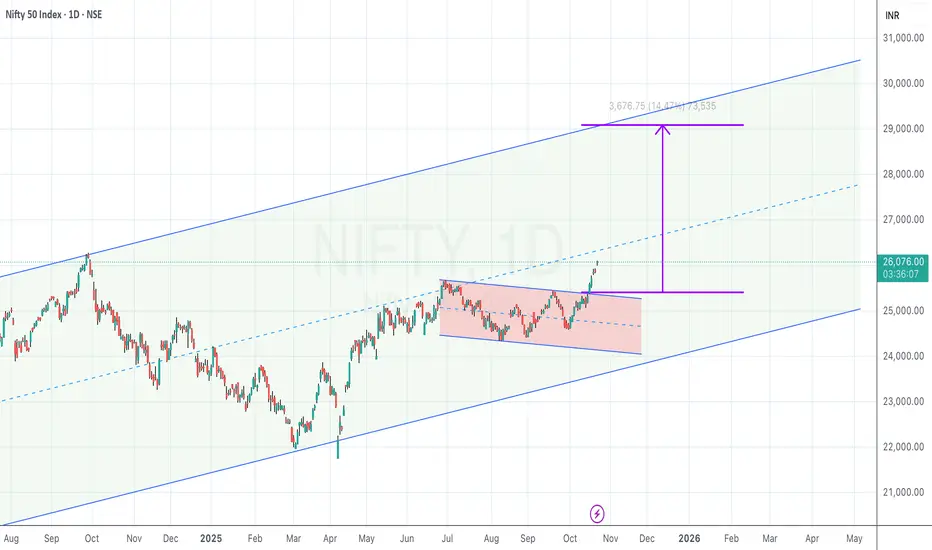
Flag breakout inside a long-term rising channel
NIFTY spent the last few months in a falling/sideways range (highlighted box) within a larger rising channel.
Price has broken out on the upside and is pushing above the box top / local supply.
A classic measured-move from the height of the box projects ~3,650–3,700 pts higher, aligning with the upper channel—pointing to ~29,400–29,600.
Why it works
Structure alignment : Local flag breakout with the primary up-channel.
Confluence : Measured move ≈ upper channel touch, giving a logical exhaustion zone for profit-taking.
What can go wrong
False breakout : Quick rejection and close back under 25,700.
Macro/event risk : Gap moves around data/events can bypass stops—position accordingly.
Bias: Bullish while above 25,700 on daily closes.
This is a technical study for educational purposes, not investment advice. Manage risk.
Nifty Nifty just formed as AB=CD pattern as shown
Disclaimer
Information provided is for informational purposes only and should not be construed as investment advice or an offer to buy or sell securities. Investors are advised to carefully review all materials and consult with a financial advisor considering their own financial situation and risk tolerance before making investment decisions. The disclaimer also often includes statements about no guarantees or warranties regarding the accuracy, adequacy, or completeness of the information provided and emphasizes that investments can fluctuate in value and there is a risk of loss.

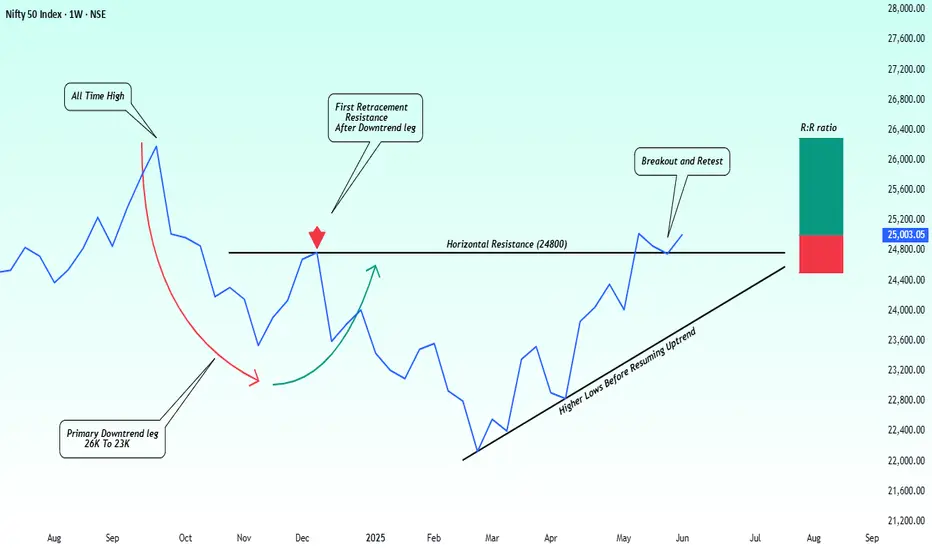
NiftY Weekly: From Primary Downtrend to BreakoutHi Traders, Sharing a clean structural setup spotted on the Nifty weekly chart. Hope this helps you in your planning. Feedback and thoughts are always welcome!
Nifty Weekly Trade Setup — Targeting 26,300--::
Following a significant correction from the all-time high near the 26000 zone Nifty formed a well defined primary downtrend leg bottoming around 22000. What’s developed since is a classic structural shift from distribution → accumulation → potential markup let's discuss.
After the downtrend price attempted a retracement rally, but it was rejected at the prior breakdown zone and creating a clear horizontal resistance. This rejection led to a base formation supported by a series of higher lows, indicating reduced selling pressure and early signs of buyer strength.
Eventually, Nifty broke above the resistance zone and more importantly held its retest, turning resistance into support. This clean breakout + retest structure is often a precursor to trend continuation.
Technical Highlights-:
Primary Downtrend: 26000 To 23000.
Failed Retracement Resistance: 24800.
Breakout Confirmation: Price moved above and retested 24800.
Structure: Series of higher lows.
Support Zone: 24800 To 24500.
Momentum: Bullish price action with controlled pullbacks.
Trade Setup-:
Bias: Long
Entry: Current levels or dips toward 24900
Stop-Loss: Below 24500
Target:26000, 26300 (previous all-time high zone)
Rationale-:
This trade aligns with classic price action principles:
Breakdown zone turned into support.
Structure of higher lows holding firm.
Valid breakout-retest confirmation.
Risk clearly defined with natural invalidation.
With Nifty respecting structure and momentum building gradually, a revisit to the 26300 zone looks increasingly probable in the coming weeks.
Hope you will like the idea, Best regards- Amit.
NIFTY KEY LEVELS FOR 23.10.2025NIFTY KEY LEVELS FOR 23.10.2025
Timeframe: 3 Minutes
If the candle stays above the pivot point, it is considered a bullish bias; if it remains below, it indicates a bearish bias. Price may reverse near Resistance 1 or Support 1. If it moves further, the next potential reversal zone is near Resistance 2 or Support 2. If these levels are also broken, we can expect the trend.
When a support or resistance level is broken, it often reverses its role; a broken resistance becomes the new support, and a broken support becomes the new resistance.
If the range(R2-S2) is narrow, the market may become volatile or trend strongly. If the range is wide, the market is more likely to remain sideways
please like and share my idea if you find it helpful
📢 Disclaimer
I am not a SEBI-registered financial adviser.
The information, views, and ideas shared here are purely for educational and informational purposes only. They are not intended as investment advice or a recommendation to buy, sell, or hold any financial instruments.
Please consult with your SEBI-registered financial advisor before making any trading or investment decisions.
Trading and investing in the stock market involves risk, and you should do your own research and analysis. You are solely responsible for any decisions made based on this research.