Rolling VWAP Market Structure🟠 Rolling VWAP Market Structure
This setup highlights how Rolling VWAP and its deviation bands reveal evolving market behavior through trend strength, volatility, and consolidation phases.
___________________________________________________________
📊 Chart Explanation
1️⃣ Bearish Bias – Price remains below VWAP, bands expand downward, and VWAP acts as dynamic resistance. Indicates seller dominance and potential continuation to the downside.
2️⃣ Narrow Bands – VWAP flattens while bands contract, showing reduced volatility. The market is likely preparing for the next directional move — either breakout or breakdown.
3️⃣ Bullish Bias – Price holds above VWAP, bands expand upward, and VWAP acts as dynamic support. Reflects buyer strength and continuation potential.
4️⃣ Post-Drop Consolidation – Candle closes below Rolling VWAP, suggesting possible consolidation before the next move. Often a pause zone where trend bias is reassessed.
___________________________________________________________
]📊 Summary:
Rolling VWAP dynamically adapts to price and volume, offering real-time insights into trend bias, volatility compression, and market equilibrium.
___________________________________________________________
⚠️ Disclaimer
📘 For educational purposes only.
🙅 Not SEBI registered.
❌ Not a buy/sell recommendation.
🧠 Purely a learning resource.
📊 Not Financial Advice.
Trade ideas

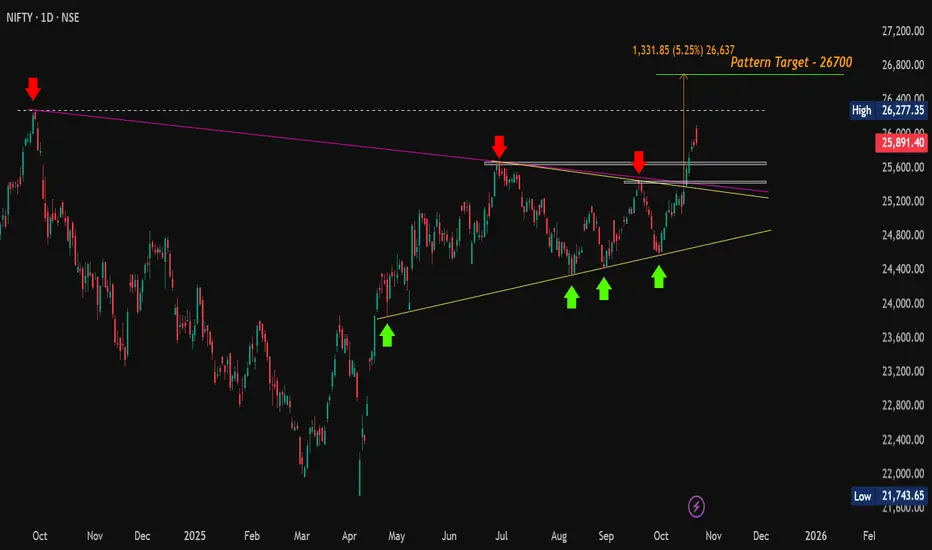
#Nifty | Breakout Confirmed, Now Eyes on Support for Next Move#Nifty Update (Daily):
CMP: 25,891.40
Following our previous update at 25,285, Nifty has decisively broken out above the Symmetrical Triangle pattern and surged to a high of 26,104 today. Price action formed a bearish candle but managed to close positively on the daily chart.
🔄 What to expect next?
A potential retest of breakout levels is likely as profit booking is expected after a strong rally of over 1,500 points from the swing low. Watch the key support zones closely for a possible bounce.
🔽 Support Zones to watch :
25,669 - 25,638
25,449 - 25,424
⚡️ If Nifty holds these levels and reverses, it could set the stage for a renewed upmove aimed at surpassing the all-time high (ATH) at 26,277.
🔼 Resistance Zones to watch :
26,104 (recent high)
26,216 - 26,277 (ATH)
📈 A sustained break above the ATH will confirm continuation toward the symmetrical triangle’s ultimate target near 26,700 .
#Nifty | #Nifty50 | #BreakOutRetest | #SymmetricalTriangle | #ChartPatterns | #SwingTrading | #PriceAction
📌 Disclaimer: This analysis is shared for educational purposes only. It is not a buy/sell recommendation. Please do your own research before making any trading decisions.
Consolidation Zone after 1100 point Move @NIFTY 50Recent Market Context
- Nifty rallied over 1,100 points from 25,068, showing strong bullish momentum.
- Each session saw gap-ups, mild profit booking, and closes near day highs.
- On Muhurat Trading Day (Tuesday), the market opened gap-up but closed below opening, hinting at short-term exhaustion.
What Happened Today
- The market opened ~180 points higher on positive news around Trump tariff policy.
- Tried holding above 26,050 in the first half but faced heavy selling later.
- Fell nearly 230 points from the day’s high, finally closing flat near 25,900.
Tomorrow’s Outlook
- After a strong sell-off, traders seem to be in a profit-booking phase.
- OI buildup at 26,000 calls signals strong resistance; support near 25,700.
- The market is likely to stay range-bound between 25,700 and 26,000 with 300-point volatility if no major news emerges.
Option Selling View
- Holding 25,800 & 25,900 straddles with ~230 total premium.
- Expecting time decay to work as long as price stays within range.
- Ideal setup for a neutral to mildly volatile market.
Key Zones
- Resistance: 26,104 / 25,888
- Support: 25,803 / 25,698

Nifty Structure Analysis & Trade Plan: 24th October
4-Hour Chart (Macro Trend)
Structure: The Nifty is in an Aggressive Bullish Momentum phase, trading within a steep ascending channel. The rally is strong, but the long upper wick on the recent 4H candle and the close far below the day's high (26,104.20) signal aggressive profit booking near the psychological 26,000 resistance area.
Key Levels:
Major Supply (Resistance): 26,100 - 26,300. This area is the key psychological and all-time high zone (ATH is 26,277.35).
Major Demand (Support): 25,600 - 25,700. This area aligns with the lower trendline of the ascending channel and is the must-hold zone for the continuation of the rally.
Outlook: The bias is Cautiously Bullish. The short-term structure is still positive, but the sharp intraday selling indicates a pause or consolidation is needed before a fresh breakout attempt.
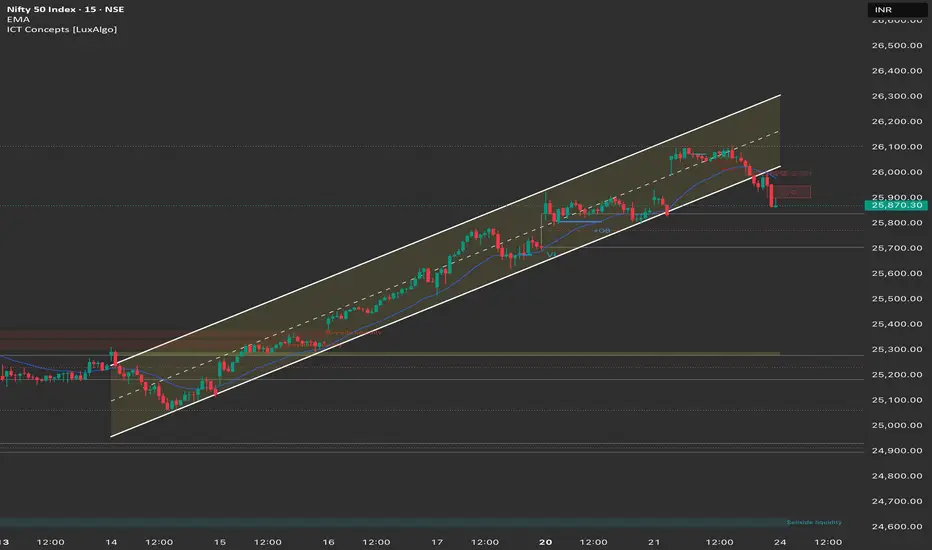
1-Hour Chart (Intermediate View)
Structure: The 1H chart shows a clear rejection after the market traded to new 52-week highs. The index closed near the lower trendline of the ascending channel. The price has currently formed a FVG (Fair Value Gap) below the closing price, which may serve as a magnet for a morning correction.
Key Levels:
Immediate Resistance: 26,100 (Intraday high/point of rejection).
Immediate Support: 25,800 (Recent swing low/channel support).
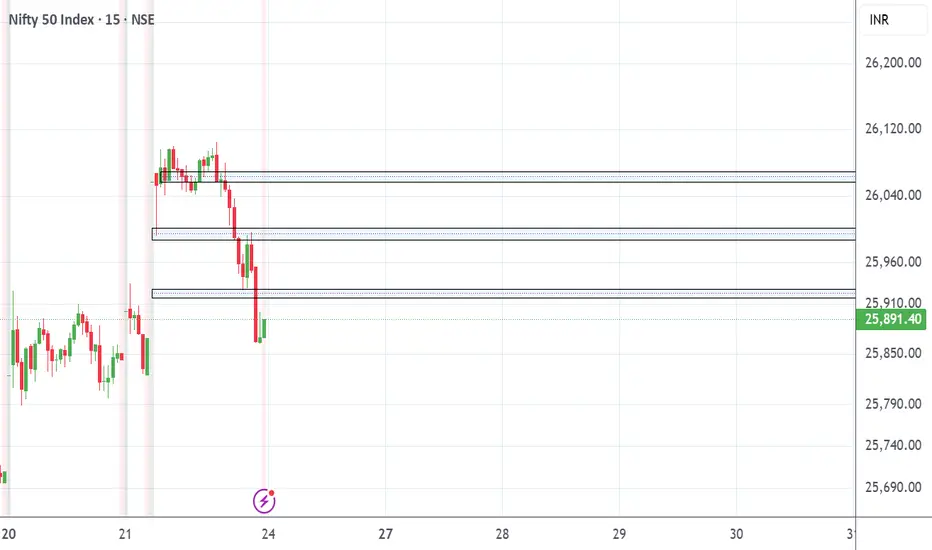
15-Minute Chart (Intraday View)
Structure: The 15M chart confirms a Market Structure Shift (MSS) to the downside in the last hour of trading, with lower highs and lower lows forming from the day's peak. The market closed below the 9-period EMA, confirming intraday bearish control.
Key Levels:
Intraday Supply: 25,950.
Intraday Demand: 25,800.
Outlook: Bearish for the session open, favoring a "Sell on Rise" strategy into the consolidation area.
📈 Structure Analysis & Trade Plan: 24th October
Market Outlook: Nifty is undergoing a healthy profit-booking session after hitting the 26,100 resistance. The primary strategy will be to buy the dip at major support or short the failure at intraday resistance.
Bullish Scenario (Primary Plan: Buy the Dip)
Justification: The multi-day macro trend is intact, driven by FII inflows and positive trade deal talks. Dips should be seen as buying opportunities.
Entry: Long entry on a bounce and reversal from the 25,750 - 25,800 zone (Lower channel trendline).
Stop Loss (SL): Place a stop loss below 25,650 (below the main channel support).
Targets:
T1: 26,100 (Retest of today's high).
T2: 26,277 (All-Time High).
Bearish Scenario (Correction/Sell on Rise)
Justification: The sharp rejection from the intraday high indicates bears are active and will defend the 26,000 area.
Entry: Short entry on a decisive break and 15-minute candle close below 25,800 OR Short a retest and rejection of the 25,950 level.
Stop Loss (SL): Above 26,100 (above the intraday high).
Targets:
T1: 25,650 (Major FVG support/Lower channel).
T2: 25,500 (Major demand zone).
Key Levels for Observation:
Immediate Decision Point: 25,800 - 25,950 zone.
Bullish Confirmation: Sustained trade above 26,000.
Bearish Warning: A move below 25,800.
Line in the Sand: 25,600. A break below this level shifts the short-term bias to corrective.
NIFTY- Intraday Levels - 24th October 2025I have not added the possibel buffer levels, however due to Friday factor I believe it may have less impact, in nutshell be careful with the trading tomorrow.
My views (for your study and analysis only) is sell on rise.
If NIFTY sustain above 25925/30/34 above this bullish then around 25948/56 above this more bullish above this wait
If NIFTY sustain below 25877 below this bearish then around 25862 strong level if sustain below this more bearish then 25825/11 then 25788/25781 below this wait
Consider some buffer points in above levels.
Please do your due diligence before trading or investment.
**Disclaimer -
I am not a SEBI registered analyst or advisor. I does not represent or endorse the accuracy or reliability of any information, conversation, or content. Stock trading is inherently risky and the users agree to assume complete and full responsibility for the outcomes of all trading decisions that they make, including but not limited to loss of capital. None of these communications should be construed as an offer to buy or sell securities, nor advice to do so. The users understands and acknowledges that there is a very high risk involved in trading securities. By using this information, the user agrees that use of this information is entirely at their own risk.
Thank you.

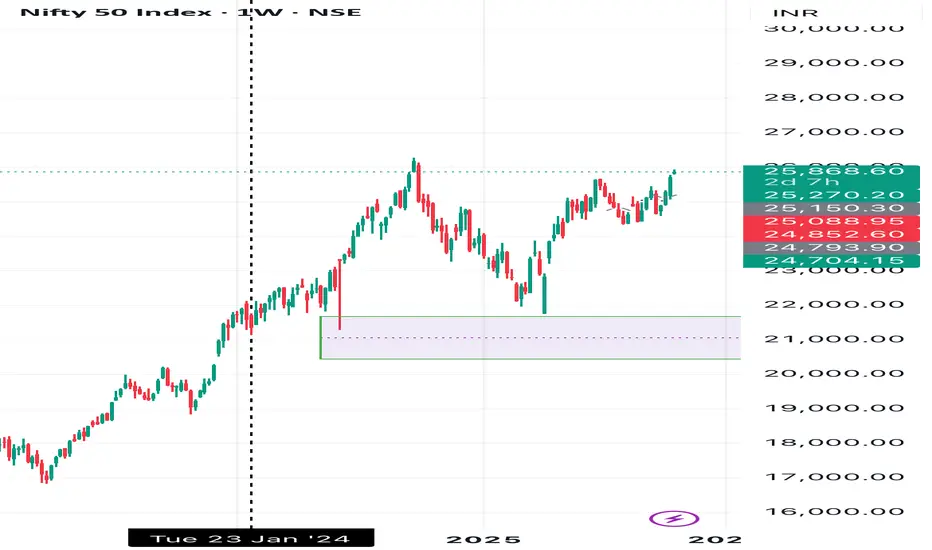
Nifty 50 in my view will touch 23300 again if broke weekly loGiven present market momentum, 23,300 is now a distant support zone and the index is likely to remain well above this level unless there is a significant market correction or global event��.Earlier in January 2025, Nifty 50 faced hurdles near 23,500, and analysis from that period noted short-term bullish sentiment upon holding above 23,300��.However, looking at the current trend, touching 23,300 would require a substantial downturn in the market. With current bullish sentiment and institutional flows supporting higher levels, the probability of revisiting 23,300 in the short-term is low unless triggered by major negative news or profit booking that results in a deep correction��.

key levels for nifty 24.10.2025these boxed levels are the place where nifty may take reversals or breakouts.
Nifty - Elliot WavesNifty showed some strong recovery today and seems to be headed higher.
There are two possibilities - We just recover part of the fall in B and then head to 24k in C down or we make a new high till 25800 and then head down to 23800.
My favored count is the latter, why? Because I expect BNF to make a new swing high.
Also, why am I looking and a new low? - Bank Nifty did a 5 wave down, so at least one new low has to come in another 5 waves down till 50-51k (I am expecting a deeper cut till 45-46k - but leaving that for later)
BNF counts:
In any case - we are good for a run up for a few days if not weeks in the market - look for pockets of strength and participate - I like realty, defense, IT and Pharma as RR is better there.
I feel auto, metals, PSU banks could be topping - I wouldn't bet on it though :)
All the best!

Nifty Intraday Analysis for 23rd October 2025NSE:NIFTY
A gap up opening is expected as strong signals are emerging about the finalization of the trade deal.
Index has resistance near 26000 – 26050 range and if index crosses and sustains above this level then may reach near 26200 – 26250 range.
Nifty has immediate support near 25700 – 25650 range and if this support is broken then index may tank near 25500 – 25450 range.

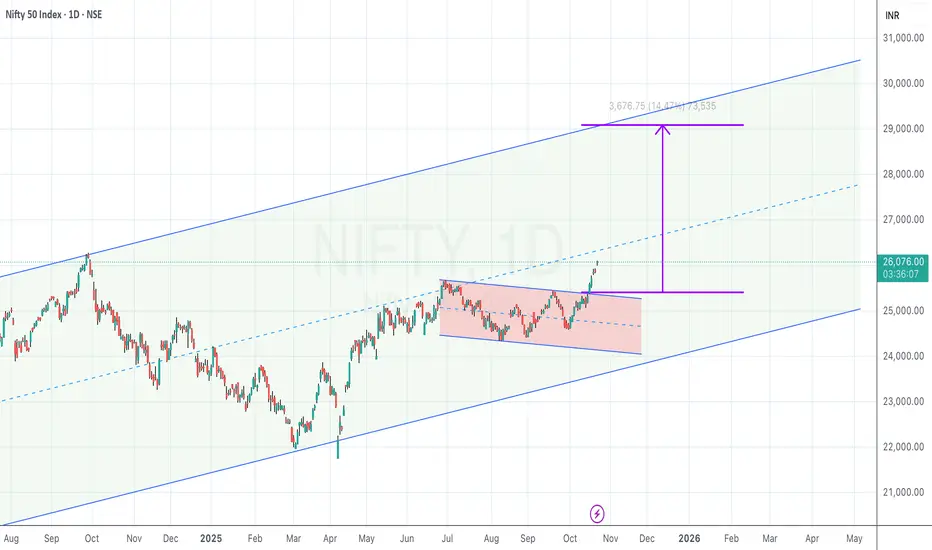
Flag breakout inside a long-term rising channel
NIFTY spent the last few months in a falling/sideways range (highlighted box) within a larger rising channel.
Price has broken out on the upside and is pushing above the box top / local supply.
A classic measured-move from the height of the box projects ~3,650–3,700 pts higher, aligning with the upper channel—pointing to ~29,400–29,600.
Why it works
Structure alignment : Local flag breakout with the primary up-channel.
Confluence : Measured move ≈ upper channel touch, giving a logical exhaustion zone for profit-taking.
What can go wrong
False breakout : Quick rejection and close back under 25,700.
Macro/event risk : Gap moves around data/events can bypass stops—position accordingly.
Bias: Bullish while above 25,700 on daily closes.
This is a technical study for educational purposes, not investment advice. Manage risk.
Nifty Nifty just formed as AB=CD pattern as shown
Disclaimer
Information provided is for informational purposes only and should not be construed as investment advice or an offer to buy or sell securities. Investors are advised to carefully review all materials and consult with a financial advisor considering their own financial situation and risk tolerance before making investment decisions. The disclaimer also often includes statements about no guarantees or warranties regarding the accuracy, adequacy, or completeness of the information provided and emphasizes that investments can fluctuate in value and there is a risk of loss.

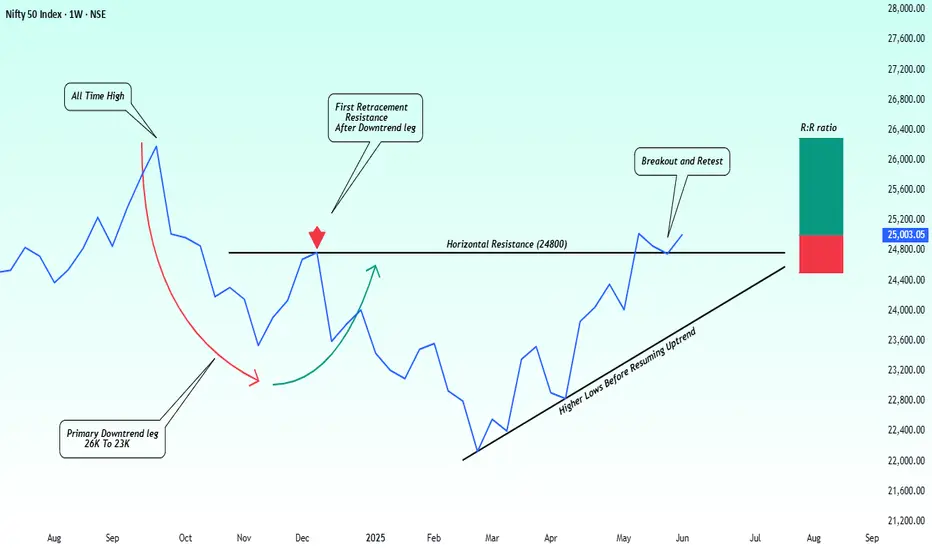
NiftY Weekly: From Primary Downtrend to BreakoutHi Traders, Sharing a clean structural setup spotted on the Nifty weekly chart. Hope this helps you in your planning. Feedback and thoughts are always welcome!
Nifty Weekly Trade Setup — Targeting 26,300--::
Following a significant correction from the all-time high near the 26000 zone Nifty formed a well defined primary downtrend leg bottoming around 22000. What’s developed since is a classic structural shift from distribution → accumulation → potential markup let's discuss.
After the downtrend price attempted a retracement rally, but it was rejected at the prior breakdown zone and creating a clear horizontal resistance. This rejection led to a base formation supported by a series of higher lows, indicating reduced selling pressure and early signs of buyer strength.
Eventually, Nifty broke above the resistance zone and more importantly held its retest, turning resistance into support. This clean breakout + retest structure is often a precursor to trend continuation.
Technical Highlights-:
Primary Downtrend: 26000 To 23000.
Failed Retracement Resistance: 24800.
Breakout Confirmation: Price moved above and retested 24800.
Structure: Series of higher lows.
Support Zone: 24800 To 24500.
Momentum: Bullish price action with controlled pullbacks.
Trade Setup-:
Bias: Long
Entry: Current levels or dips toward 24900
Stop-Loss: Below 24500
Target:26000, 26300 (previous all-time high zone)
Rationale-:
This trade aligns with classic price action principles:
Breakdown zone turned into support.
Structure of higher lows holding firm.
Valid breakout-retest confirmation.
Risk clearly defined with natural invalidation.
With Nifty respecting structure and momentum building gradually, a revisit to the 26300 zone looks increasingly probable in the coming weeks.
Hope you will like the idea, Best regards- Amit.
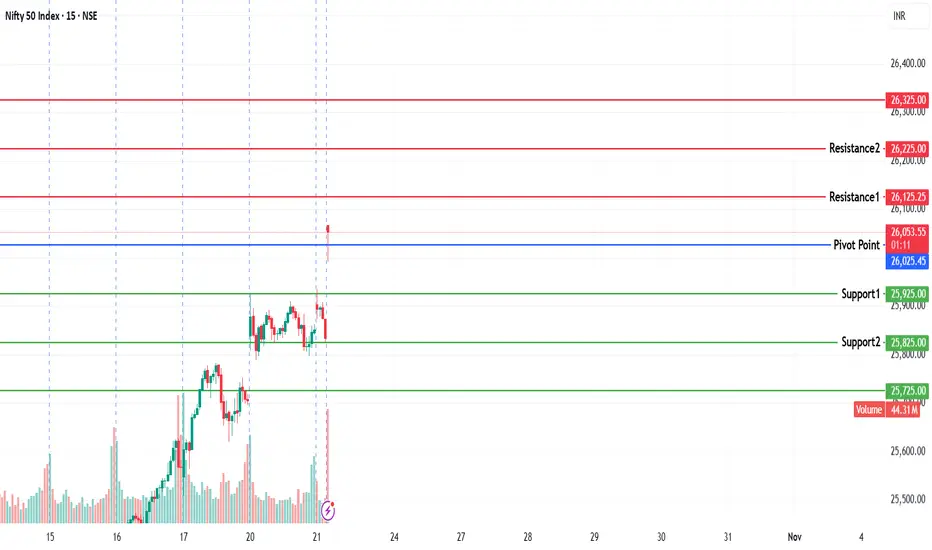
NIFTY KEY LEVELS FOR 23.10.2025NIFTY KEY LEVELS FOR 23.10.2025
Timeframe: 3 Minutes
If the candle stays above the pivot point, it is considered a bullish bias; if it remains below, it indicates a bearish bias. Price may reverse near Resistance 1 or Support 1. If it moves further, the next potential reversal zone is near Resistance 2 or Support 2. If these levels are also broken, we can expect the trend.
When a support or resistance level is broken, it often reverses its role; a broken resistance becomes the new support, and a broken support becomes the new resistance.
If the range(R2-S2) is narrow, the market may become volatile or trend strongly. If the range is wide, the market is more likely to remain sideways
please like and share my idea if you find it helpful
📢 Disclaimer
I am not a SEBI-registered financial adviser.
The information, views, and ideas shared here are purely for educational and informational purposes only. They are not intended as investment advice or a recommendation to buy, sell, or hold any financial instruments.
Please consult with your SEBI-registered financial advisor before making any trading or investment decisions.
Trading and investing in the stock market involves risk, and you should do your own research and analysis. You are solely responsible for any decisions made based on this research.
Daily Analysis Nifty: 23/10/25Quick analysis before we start our session. Clear levels for Nifty50 spot prices

NIFTY Breakout from Broadening Wedge – Is a Big Rally Ahead?The Nifty 50 index has recently broken out of a Broadening Wedge Pattern, signaling a potentially powerful upward move. This breakout is significant as it comes after weeks of wide-range consolidation within expanding trendlines—a classic sign of increasing volatility and market indecision that typically resolves with an explosive move.
The wedge's upper resistance, which acted as a ceiling near the 25,900–26,000 zone, has finally been breached with strong bullish momentum. This breakout confirms that buyers have taken control, overcoming the supply pressure at the top of the wedge. Such a breakout, especially from a broadening formation, often leads to sharp directional rallies as trapped short-sellers cover positions and new momentum traders enter long.
Using the height of the wedge, the projected upside has been clearly mapped out. The immediate targets post-breakout are:
Target 1: 26,250
Target 2: 26,450
Target 3: 26,750
Final Projected Target: 26,950+
Each of these levels offers potential resistance where short-term consolidation or partial profit booking may occur. However, if the broader sentiment remains bullish and global cues support the move, Nifty could comfortably approach or even exceed the final projected target in the coming sessions.
The breakout also invalidates the earlier bearish scenario of a fall back into the wedge. As long as Nifty holds above the breakout zone (now turned support), the bullish structure remains intact. This zone—around 25,900—is now a critical level to watch for any retest. If the index revisits this level and finds buying interest, it will further strengthen the breakout’s credibility.
Volume confirmation, strong follow-up candles, and broader sectoral participation will be key to sustaining the rally. Traders should also keep an eye on global market trends, USDINR, and bond yields, as they may influence sentiment at higher levels.
In summary, Nifty has decisively broken out of a broadening wedge—an event that opens the door to a fresh leg of rally. The pattern suggests a potential upside of 800–1,100 points from the breakout level, with bulls firmly in control unless price falls back below the wedge resistance. It’s time to ride the trend, but with calculated risk and disciplined trailing stop-losses.

NIFTY – Professional Trading Plan for 23-Oct-2025
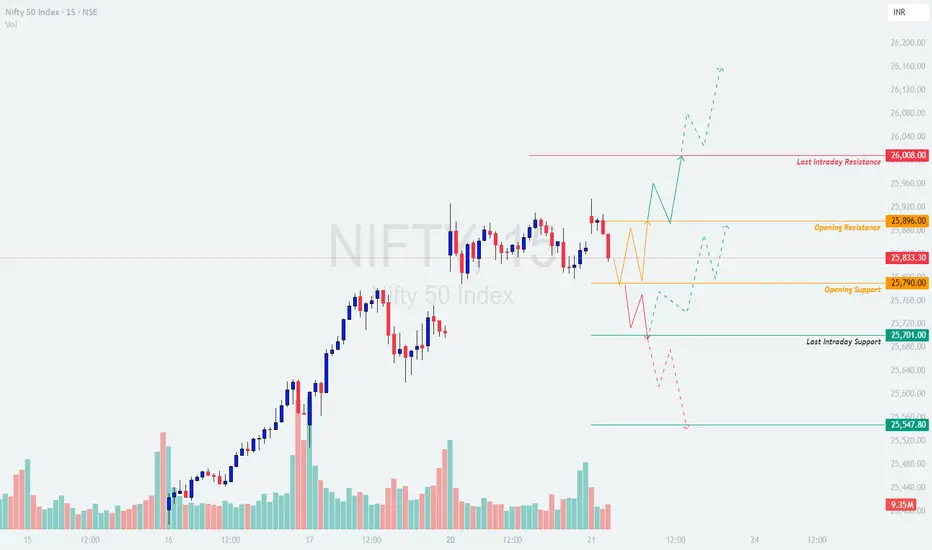
Market context and key levels
Reference from your map: Opening Resistance 25,896; Opening Support 25,790; Last Intraday Support 25,701 and deeper support 25,548; overhead resistance 26,008. Bias is neutral-to-positive while above 25,790; momentum unlocks only on acceptance above 25,896, whereas sustained loss of 25,701 flips control to bears. 🚦
GAP UP OPEN (≥ +100 pts)
Educational logic: Positive gaps can trap shorts; the edge is to wait for acceptance above resistance (time + volume) before riding continuation. 📈
If open lands around 25,890–25,920 and first 5–15 min hold above VWAP/first high, consider a momentum long toward 25,960–25,980; partials there, then trail for 26,008. Stop below the retest low near 25,880.
If open jumps near 25,980–26,008, avoid chasing into resistance. Prefer a pullback to 25,920–25,900; go long only on a higher low and reclaim of 25,940 with a tight stop under the pullback low; targets 25,980 → 26,008 and extension if breadth expands.
Failure short: Rejection wicks from 25,960–26,008 followed by a 15‑min close back below 25,900. Tactical short to 25,896 → 25,840–25,790; cover if 25,940 is reclaimed decisively.
FLAT OPEN (±0–50 pts)
Educational logic: Neutral opens favor range trades around nearby pivots until a breakout confirms with acceptance. ⚖️
Range buy: Look for reversal signals near 25,810–25,790 with risk below the session swing; targets 25,850 → 25,896.
Breakout buy: A 15‑min close and successful retest above 25,896 opens 25,940–25,960; scale out into 25,980–26,008 if momentum broadens.
Breakdown short: Acceptance below 25,790 on retest targets 25,735–25,710; if sellers maintain control, extend to 25,701 then 25,650–25,548. Trail using successive lower highs.
GAP DOWN OPEN (≤ −100 pts)
Educational logic: Negative gaps near support often lead to “gap‑and‑go” trends if acceptance stays below, or fast reversals if buyers defend key zones. 📉
Gap‑and‑go short: Open around 25,720–25,700 and failure to reclaim 25,790 on retest → short to 25,701; book partials, then trail for 25,650–25,600 and 25,548 if momentum persists.
Reversal long: Strong rejection from 25,701 with bullish engulfing/hammer and volume → long back to 25,760 then 25,790; move stop to breakeven once 25,790 holds.
Bias flip: If price re-enters above 25,896 after a weak open and sustains, abandon shorts and prepare for rotation to 25,960–26,008; avoid fighting a reclaim day.
Execution checklist
Predefine the scenario, trigger (acceptance or clean retest), invalidation (where the idea is wrong), and first target.
Key decision areas: 25,790 pivot, 25,896 resistance to beat, 26,008 resistance, 25,701 and 25,548 supports. Trade reactions to zones, not exact ticks.
Use structure-based stops beyond the far side of the zone; scale out at the next pivot and trail to protect gains.
Options risk management tips
Define risk : Prefer debit spreads near zones (bull call above 25,896; bear put below 25,790/25,701) to cap tail risk on volatile gap opens.
Size by volatility: Wider expected range → smaller size; avoid oversizing because options “look cheap.”
Liquidity first: Use near‑ATM, current‑week Nifty options with tight spreads; avoid illiquid deep OTMs that decay rapidly in chop.
Confirm before entry: Wait for 5–15 min acceptance or a clean retest hold; be cautious in the first 1–3 minutes unless trading a planned opening drive.
Manage winners: Take partials at first pivot; if IV expands, consider converting naked calls/puts into verticals to lock risk while keeping upside.
Avoid overlap: If structure flips (e.g., reclaim above 25,896 after breakdown), exit losers decisively instead of hedging passively.
Summary
Core map: 25,790 is the intraday pivot; 25,896 is the gate to upside continuation; 26,008 is upper resistance; 25,701 then 25,548 are key supports. Upside opens on acceptance above 25,896 toward 25,960–26,008, while downside strengthens below 25,790/25,701 toward 25,650–25,548. 🙂
Conclusion
Prepare three plays: continuation long above 25,896, responsive range trades around 25,790/25,896 with clear triggers, and momentum shorts below 25,790/25,701 targeting 25,650–25,548. Execute with strict invalidations, scale responsibly, and adapt quickly if pivots are reclaimed. 📊
Disclaimer: This is an educational plan, not investment advice or a trade recommendation; I am not a SEBI registered analyst .
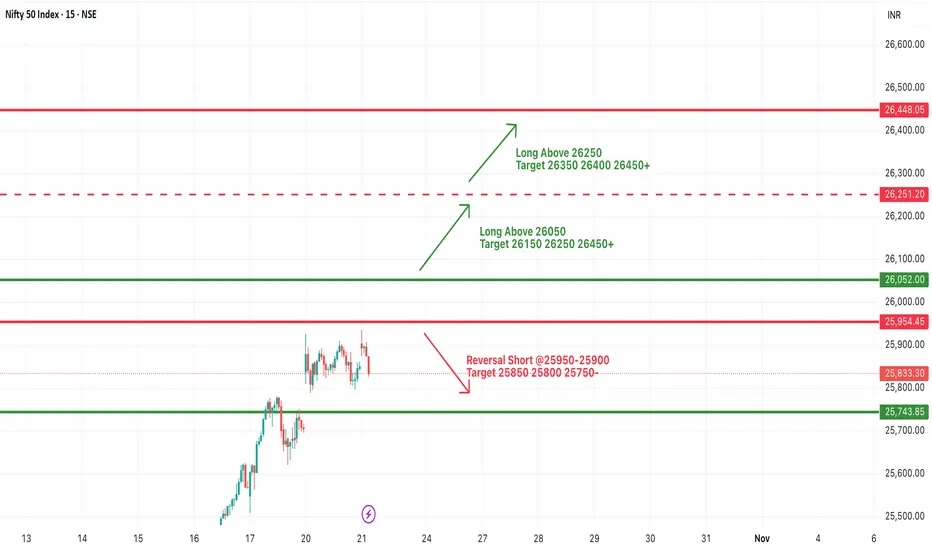
#NIFTY Intraday Support and Resistance Levels - 23/10/2025Nifty is expected to open with a gap up above the 26,050 level, indicating strong bullish sentiment and follow-through momentum from recent sessions. The index has been maintaining higher highs and higher lows, showing sustained buying interest from market participants.
If Nifty holds above 26,050–26,100, it could extend gains toward 26,150, 26,250, and 26,450+ levels. A breakout above 26,250 will confirm a strong bullish continuation, paving the way for a further rally toward 26,600+ levels in the short term.
On the downside, immediate support lies near 25,950–25,900. A dip below this zone could trigger intraday profit booking, dragging the index toward 25,850 and 25,750 levels.
Overall, the sentiment remains positive with a gap-up opening expected above 26,050, supported by steady momentum. Traders should look for buy-on-dip opportunities, keeping a trailing stop loss below 25,900 to safeguard profits and manage risk effectively.
“Nifty 50 Intraday Key Levels | Buy & Sell Zones 20th Oct 2025”“Want to learn more? Like this post and follow me!”
26170 🔴 Above 10m closing Shot Cover Level
Strong resistance — short covering likely above this.
26033 🟠 Below 10m hold PE By level /
Above 10m hold CE by level
25923 🟣 Above 10M hold positive trade view
Below 10M hold negative trade view
Sentiment deciding level — crucial for trend direction.
25818 ⚫ Above Opening S1 10m Hold CE By level
Bullish entry level — CE hold area.
25730 🟠 Below Opening R1 10m Hold PE By level
Below 10m hold PE By Risky Zone Weak zone — PE may strengthen below this.
25618 🟢 Above 10M hold CE By Safe Zone level
Safe bullish zone — CE can be held confidently above.
25610 🔵 BELOW 10M hold UNWINDING level
Breakdown zone — unwinding or heavy selling possible below.

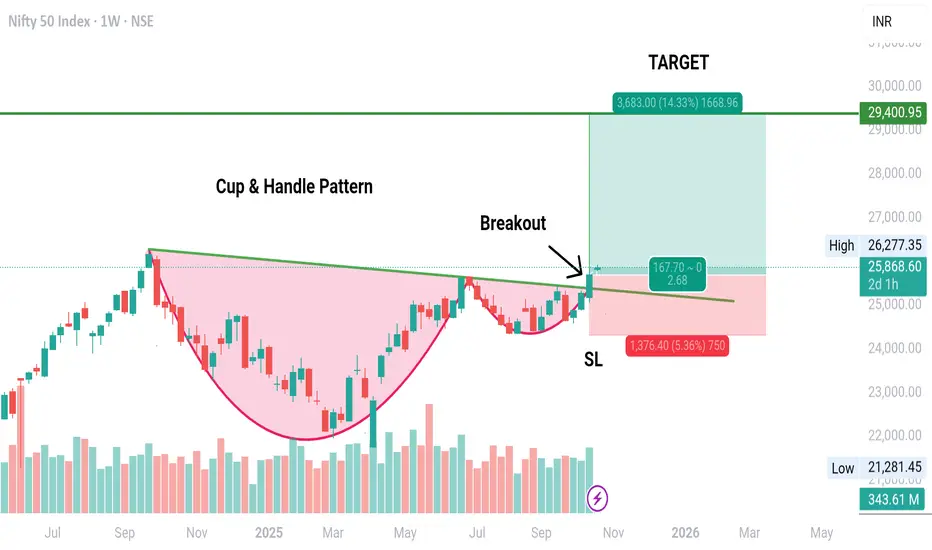
CUP & HANDLE Pattern Breakout in NIFTYA Breakout with good volume has happened in NIFTY 50 INDEX.
The breakout is has happened in weekly Time Frame 😱😱.
A Big target of 29400 is available to be achieved🎯
SL will be below the Handle's Low on sustaining Basis.
A better entry could be the one after retracement💡. As there are high chances of retracement from here as the price is very near to lifetime high.
One should always be cautious with the trade as the time is weekly. And, there can be many factors which can become hurdle like War, Tariff War, US economic bubble burst leading to crash etc etc.
However, entry target and SL are also mentioned in the chart.
Subscribe to my YouTube Channel for more details and more analysis.
Note: This analysis is for Educational Purpose Only. Please invest after consulting a professional financial advisor.
NIFTY looks strong but not STRONG ENOUGH!!?As we can see NIFTY has finally breached its previous swing but is showing signs of rejection around 25900-26000 levels as it is now trading at important GAP which has been filled and cam act as a resistance as long as NIFTY doesn't sustains itself above 25900-26000 psychological level every rise can be sold as it could be a possible trap leading to sharp fall. Moreover one who had been rallying this uptrend from our zones should start booking partially and wait for signs of reversal or sustainment above 26000 level for confirmation so plan your trades accordingly and keep watching everyone.
Nifty key levels for 23.10.2025These levels are the places where the nifty may take reversals or breakouts which acts as resistance and support levels.

Nifty Testing Major Fibonacci Confluence Zone – Possible ShakeouNifty has recently retested a key Fibonacci retracement level, which coincides with a well-defined supply zone on the higher timeframe. The price action suggests strong resistance absorption in this area, followed by a period of sideways consolidation — often a precursor to a decisive move.
Unlike previous market cycles, the Indian indices are showing relative strength and reduced correlation with US markets, indicating a potential domestic-driven breakout scenario.
A short-term shakeout or liquidity hunt cannot be ruled out before the index establishes a clear direction. If the current structure holds, we could see a one-sided rally towards the 32,488 zone in the upcoming sessions.
📊 This is my personal technical view, not financial advice.
⚠️ I am not a SEBI-registered analyst. Please do your own research and risk assessment before taking any trades.
Nifty 50 - weely cup & handle breakout near resistance zone 📈 Nifty 50 – Weekly Cup & Handle Breakout Near Major Resistance Zone (25,850–26,000)
Description:
The Nifty 50 Index (Weekly) chart is forming a Cup and Handle pattern, one of the strongest continuation patterns in technical analysis.
Pattern Structure:
The cup formed between September 2024 and May 2025, followed by a handle consolidation in June–September 2025.
The breakout is now visible as price closes above the 25,850–26,000 resistance zone — an area that acted as a strong supply region in the past.
Volume & Momentum:
Increasing bullish candles near resistance suggest accumulation and breakout intent.
Key Levels:
Resistance Zone (Neckline): 25,850–26,000
Breakout Confirmation: Weekly close above 26,000
Immediate Target: 26,800 (pattern depth projection)
Extended Target: 27,400–27,500 (1.618 Fibonacci extension)
Stop Loss: Weekly close below 25,500
Trading Plan:
✅ Enter on sustained move/close above 26,000
🔒 Stop loss below 25,500
🎯 Targets: 26,800 → 27,400
View:
Bullish (Positional) — As long as Nifty holds above 25,500, momentum remains in favor of a breakout continuation rally.
Full Coverage on my Newsletter this Week
Keep in the Watchlist and DOYR.
NO RECO. For Buy/Sell.
📌Thank you for exploring my idea! I hope you found it valuable.
🙏FOLLOW for more
👍BOOST if you found it useful.
✍️COMMENT below with your views.
Meanwhile, check out my other stock ideas on the right side until this trade is activated. I would love your feedback.
As per the Latest SEBI Mandate, this isn't a Trading/Investment RECOMMENDATION nor for Educational Purposes; it is just for Informational purposes only. The chart data used is 3 Months old, as Showing Live Chart Data is not allowed according to the New SEBI Mandate.
Disclaimer: "I am not a SEBI REGISTERED RESEARCH ANALYST AND INVESTMENT ADVISER."
This analysis is intended solely for informational purposes and should not be interpreted as financial advice. It is advisable to consult a qualified financial advisor or conduct thorough research before making investment decisions.
NSE:NIFTY
