YesPerfect 🔥
Aap F&O (Futures & Options) trade karte ho aur 15-minute timeframe pe kaam karte ho —
toh yahaan par RSI ke “shai settings” aur “entry-exit method” dono batata hoon 👇
---
⚙️ Shai RSI Settings (F&O – 15-Minute Chart)
Setting Value Explanation
RSI Period 9 Fast & sensitive — F&O me quick momentum capture ke liye best
Overbought Level 75 Iske upar profit-booking ya short signal check karo
Oversold Level 25 Iske neeche buying setup banta hai
RSI Midline (50) Trend confirmation — Above 50 = Bullish, Below 50 = Bearish
---
🧠 Strategy: RSI + CPR + EMA Combo (High Accuracy)
1. Confirm Trend:
Price above CPR → Bullish bias
Price below CPR → Bearish bias
2. RSI Confirmation:
RSI crosses above 50 → Buy zone
RSI crosses below 50 → Sell zone
3. Extra Filter (EMA)
Add EMA 20 & EMA 50
If price + RSI both above EMA → strong buy
If below both → strong sell
---
🕒 Best Intraday Timing (for RSI signals on 15m F&O)
Time Typical Market Action
09:15 – 09:45 Initial breakout zone
10:30 – 11:15 First RSI reversal (often reliable)
12:30 – 13:00 Sideways or retracement
14:15 – 15:00 Final trend / breakout continuation
---
✅ Example Setup
Suppose NIFTY FUT 15-min chart:
RSI = 9
Price > CPR
RSI = 53 crossing upward
➡️ Buy entry, target till RSI = 70 – 75.
If RSI starts turning down from 75 – 80 zone → exit or short.
---
Chaaho to main aapke liye ready-made TradingView indicator script bhi likh sakta hoon
(jo RSI + EMA + CPR combo auto signal dega).
Batao — banau kya “RSI + EMA + CPR buy/sell auto signal indicator”?
Trade ideas

NIFTY – Professional Trading Plan for 20-Oct-2025 (educationaMarket context and key levels
Reference from your map: Opening/last intraday resistance 25,815; “No‑Trade Zone” 25,698–25,744; Opening Support Zone 25,581–25,597; Last Intraday Support 25,503; Profit‑booking zone near 26,007. The plan focuses on trading acceptance or rejection around these zones and avoiding low‑edge chop inside the No‑Trade box. 🚦
GAP UP OPEN (≥ +100 pts)
Educational logic: Positive gaps can trap shorts; the edge is to wait for acceptance above resistance, not the first spike. 📈
If open prints around 25,780–25,820 and first 5–15 minutes hold above VWAP/first high, consider a momentum long toward 25,860–25,900; partials there, then trail for 25,950–26,007 (profit‑booking zone). Stop below the retest low of 25,770–25,780.
If open jumps near 25,950–26,007, avoid chasing into supply. Prefer a pullback to 25,880–25,840; go long only on a higher low and reclaim of 25,900 with a tight stop under pullback low; targets 25,960 → 26,007.
Failure short: Rejection wicks from 25,880–26,007 followed by a 15‑min close back below 25,820. Take a tactical short to 25,744 then 25,698; cover if 25,860 is reclaimed decisively.
FLAT OPEN (±0–50 pts)
Educational logic: Neutral opens favor range trades around nearby pivots until a breakout with time + volume occurs. ⚖️
Avoid initiating inside the No‑Trade Zone 25,698–25,744 unless playing quick scalps; wait for a break and retest.
Breakout long: A 15‑min close and successful retest above 25,744 opens 25,780 → 25,815; if breadth strengthens, extend toward 25,860–25,900.
Breakdown short: Acceptance below 25,698 on retest targets 25,640–25,600, then 25,597–25,581 (Opening Support). Consider partials into 25,581 and trail for 25,503 if momentum persists.
GAP DOWN OPEN (≤ −100 pts)
Educational logic: Negative gaps near support can either trend down (“gap‑and‑go”) or reverse sharply if buyers defend key zones. 📉
Gap‑and‑go short: Open around 25,610–25,590 and failure to reclaim 25,597–25,581 on retest → short to 25,540–25,520; extend to 25,503 if sellers maintain control. Book partials into 25,503 and trail with lower highs.
Reversal long: Strong rejection from 25,503 with bullish engulfing/hammer and pickup in volume → long back to 25,560 then 25,597–25,598; shift stop to breakeven once 25,597 holds.
Bias flip: If price re-enters above 25,698 and sustains, abandon shorts and prepare for rotation through 25,744→25,780; don’t fight a reclaim day.
Execution checklist
Predefine the scenario, trigger (acceptance or clean retest), invalidation (where the idea is wrong), and first target.
Respect the No‑Trade Zone 25,698–25,744 to reduce whipsaw risk; act only after a clear break and retest.
Use structure-based stops beyond the far side of the zone; scale out at each next pivot and trail to protect gains.
Options risk management tips
Define risk : Prefer debit spreads near decision areas (bull call above 25,744/25,815; bear put below 25,698/25,581) to cap tail risk.
Size by volatility: Wider expected range → smaller position; avoid oversizing because premiums “look cheap.”
Liquidity first: Use near‑ATM, current‑week Nifty options with tight spreads; avoid illiquid deep OTMs that decay fast in chop.
Confirm before entry: Wait for 5–15 min acceptance or a clean retest hold; be cautious in the first 1–3 minutes unless trading a planned opening drive.
Manage winners: Take partials at the next pivot and trail; if IV expands, consider converting naked options into verticals to lock risk while keeping upside.
Avoid overlap: If structure flips (e.g., reclaim above 25,698 after a breakdown), exit losers decisively rather than hedging passively.
Summary
Core map: 25,698–25,744 is a No‑Trade chop box; 25,815 is resistance to beat; 25,581–25,597 is opening support; 25,503 is last intraday support; 26,007 is profit‑booking supply. Upside unlocks on acceptance above 25,744/25,815 toward 25,900–26,007, while downside strengthens below 25,698/25,581 toward 25,503. 🙂
Conclusion
Prepare three plays: continuation long above 25,744/25,815, responsive range trades around 25,698–25,744 only with clear edges, and momentum shorts below 25,698/25,581 aiming 25,503. Execute with strict invalidations, scale responsibly, and adapt quickly if pivots are reclaimed. 📊
Disclaimer: This is an educational plan, not investment advice or a trade recommendation; I am not a SEBI registered analyst .

Nifty Breaks Trendline Ahead of Diwali| ATH LoadingAfter several months of consolidation, Nifty has finally broken the major trendline, turning the structure from bearish to bullish just in time for Diwali.
The breakout above 25,320 (gap zone and key resistance) confirms buyer strength. As long as the index stays above 25,200, dips are likely to be bought aggressively.
The market structure now suggests a "Buy on Dip" scenario, with the first major upside target around 26,900–27,000, which also aligns with the all-time high zone.
Support Levels: 25,320 → 24,900 → 24,400
Resistance Levels: 26,130 → 26,900
Invalidation Level: Any sustained close below 25,200 will invalidate the bullish setup.
Overall, the bias remains bullish for Diwali week, with strong momentum and sentiment backing the breakout. Traders can look for buying opportunities on intraday dips or after minor pullbacks.

Nifty - Expiry day analysis Oct 20Price was moving from one support to another. The nearby support/resistance levels are 25500, 25620 and 25800.
If the price opens with a gap up and faces resistance at the 25800 zone, then the price will try to find support at 25620 and 25500.
Buy above 25820 with the stop loss of 25780 for the targets 25860, 25900, 25940 and 25980.
Sell below 25640 with the stop loss of 25680 for the targets 25600, 25560, 25520 and 25480.
Expected expiry day range is 25600 and 25900.
Always do your analysis before taking any trade.

Ready for the Breakout? NIFTY’s Chart Points to 30,500 AheadThe cup base formed between Sept 2024 (26,277 high) and Apr 2025 (21,743 low), representing a well-rounded accumulation phase.
The handle consolidation has been developing just below the 26,200–26,300 resistance zone, accompanied by declining volume, which aligns with textbook breakout behavior.
A decisive close above 26,300 would mark a pattern breakout, confirming bullish momentum.
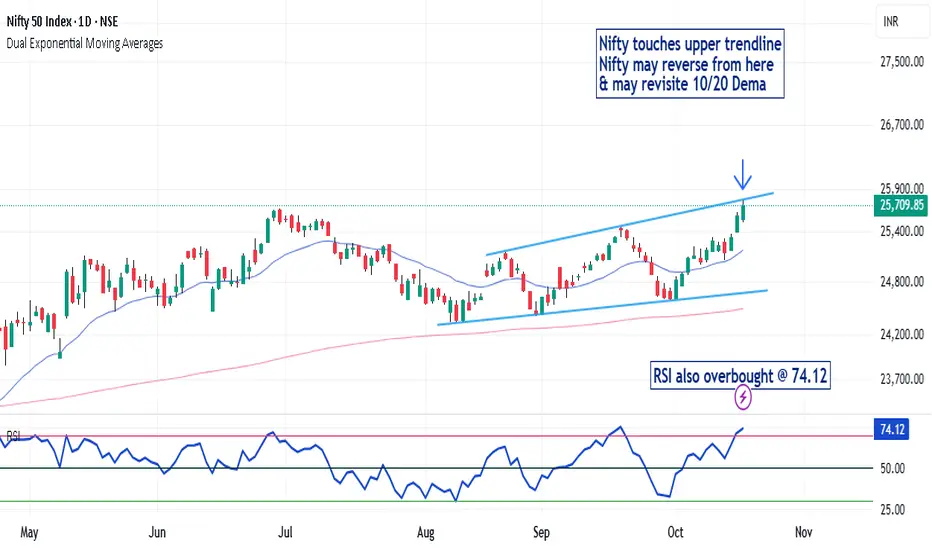
Nifty 50 analysis on Daily chartAs shown in Daily chart Nifty 50 touches upper trendline
from here Nifty may reverse & may reisit 10/20 Dema.
It's only prediction not sure.
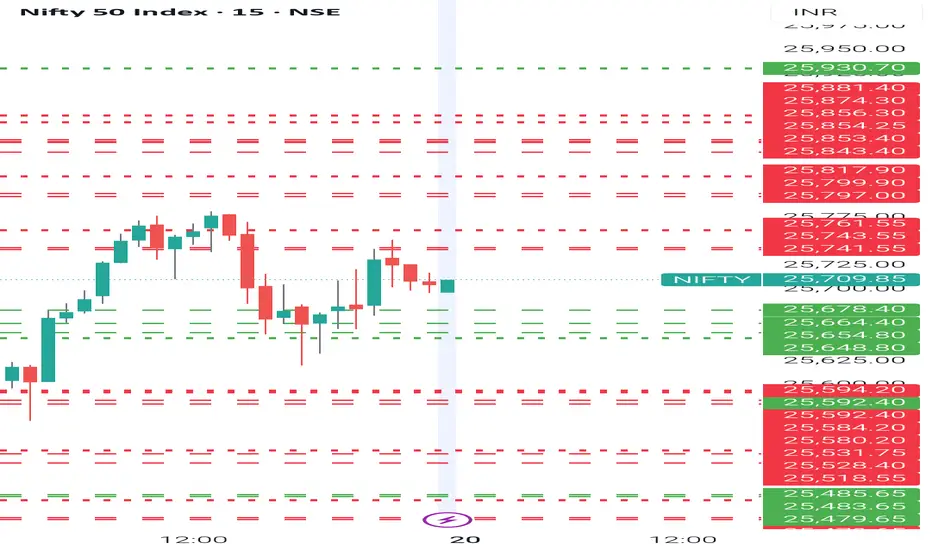
NIFTY- Intraday Levels - 20th October 2025If NIFTY sustain above 2741/61 above this bullish then around 25797/25817 then 25843/56 strong level or 25874/25882 above this more bullish
If NIFTY sustain below 25678/48 below this bearish around 25594/80 then 25531/18 strong level if sustain below this more bearish then last hope 25485 or 25479 below this wait
Consider some buffer points in above levels.
Please do your due diligence before trading or investment.
**Disclaimer -
I am not a SEBI registered analyst or advisor. I does not represent or endorse the accuracy or reliability of any information, conversation, or content. Stock trading is inherently risky and the users agree to assume complete and full responsibility for the outcomes of all trading decisions that they make, including but not limited to loss of capital. None of these communications should be construed as an offer to buy or sell securities, nor advice to do so. The users understands and acknowledges that there is a very high risk involved in trading securities. By using this information, the user agrees that use of this information is entirely at their own risk.
Thank you.
Cross-Market ArbitrageIntroduction
In the world of finance and trading, arbitrage represents a powerful strategy for exploiting price inefficiencies across markets. Simply put, arbitrage involves buying an asset in one market at a lower price and simultaneously selling it in another market at a higher price, thereby earning a risk-free profit. Among various types of arbitrage, cross-market arbitrage is particularly significant because it leverages discrepancies in pricing between two or more markets, often in different locations, trading platforms, or financial instruments.
Cross-market arbitrage plays a critical role in ensuring market efficiency, stabilizing prices, and providing liquidity to the financial system. With globalization, the interconnectedness of markets, and the rise of electronic trading platforms, this type of arbitrage has become more prevalent, sophisticated, and competitive.
Definition of Cross-Market Arbitrage
Cross-market arbitrage can be defined as the practice of simultaneously buying and selling the same or equivalent financial instruments in different markets to profit from price differences. The key characteristics include:
Two or More Markets: Arbitrage opportunities arise when an asset is traded across multiple markets—this could be geographically separated stock exchanges, commodities exchanges, or derivatives platforms.
Price Discrepancy: The underlying principle is that the same asset may trade at slightly different prices in different markets due to differences in supply, demand, liquidity, transaction costs, or market inefficiencies.
Simultaneous Execution: To minimize risk, the arbitrage transactions are executed almost simultaneously, locking in a risk-free profit.
Example: If a share of a multinational company trades at $100 on the New York Stock Exchange (NYSE) but is available at $101 on the London Stock Exchange (LSE), a trader could theoretically buy the stock in New York and sell it in London, capturing the $1 price difference, adjusted for transaction costs and currency conversion.
Types of Cross-Market Arbitrage
Cross-market arbitrage can be classified into several types depending on the nature of the instruments and the markets involved:
Equity Cross-Market Arbitrage:
Involves stocks listed on multiple exchanges.
Example: A company listed on both the NYSE and the LSE may have temporary price differences due to market hours, liquidity differences, or currency fluctuations.
Currency Arbitrage:
Also called foreign exchange (FX) arbitrage, it involves exploiting discrepancies in currency exchange rates between markets.
Example: Triangular arbitrage in forex markets involves trading three currencies to exploit mismatches in cross-exchange rates.
Commodity Arbitrage:
Occurs in physical commodities or futures contracts traded across different exchanges.
Example: Gold trading on COMEX versus the London Metal Exchange (LME). Differences in demand, storage costs, and shipping can create arbitrage opportunities.
Derivatives Arbitrage:
Involves futures, options, or other derivatives on the same underlying asset traded in different markets.
Example: Index futures on the S&P 500 traded in Chicago versus equivalent derivatives traded offshore.
Mechanisms and Execution
The success of cross-market arbitrage depends on efficient execution and analysis. The steps typically include:
Identifying Price Discrepancies:
Traders use advanced software, real-time market data, and algorithms to detect differences in pricing across markets.
Calculating Transaction Costs:
Arbitrage profits must exceed the sum of transaction costs, including brokerage fees, taxes, currency conversion costs, and potential settlement delays.
Executing Simultaneous Trades:
Speed is critical because price discrepancies are often short-lived. High-frequency trading (HFT) systems are commonly used to perform trades within milliseconds.
Hedging Risk:
Even though arbitrage is considered "risk-free," operational, settlement, or currency risks exist. Traders may use hedging techniques to neutralize potential exposures.
Factors Influencing Cross-Market Arbitrage
Several factors determine the feasibility and profitability of cross-market arbitrage:
Market Efficiency:
In highly efficient markets, price discrepancies are minimal and short-lived, making arbitrage challenging.
Liquidity:
Markets with higher liquidity allow faster execution and larger trades, enhancing arbitrage opportunities.
Transaction Costs:
High fees, taxes, or currency conversion costs can erode profits, making some arbitrage opportunities non-viable.
Regulatory Environment:
Cross-border arbitrage may be affected by capital controls, restrictions on foreign investment, or differences in trading regulations.
Market Hours:
Differences in trading hours across global exchanges create temporary opportunities, especially when one market reacts to news before another opens.
Technological Infrastructure:
Advanced trading platforms, direct market access, and high-speed connectivity are critical to capturing fleeting arbitrage opportunities.
Examples in Practice
1. Equity Arbitrage Example:
Consider a company listed on both the NYSE and LSE. Due to market inefficiencies, its shares trade at $100 in New York and £80 in London. With a current exchange rate of $1.25/£:
London price in USD = 80 × 1.25 = $100
If due to demand fluctuations, London price rises to £82 ($102.5 USD), a trader could buy in NY at $100 and sell in London at $102.5, making a $2.5 profit per share.
2. Forex Arbitrage Example:
Triangular arbitrage occurs when three currency exchange rates are mismatched:
USD/EUR = 0.95
EUR/GBP = 0.88
USD/GBP = 0.83
A trader may convert USD to EUR, EUR to GBP, and GBP back to USD to exploit the inconsistency in exchange rates.
3. Commodity Arbitrage Example:
Gold trades at $1,900 per ounce on COMEX and €1,820 per ounce in Europe. If the USD/EUR rate is 1.05:
European price in USD = 1,820 × 1.05 = $1,911
Buying gold in COMEX at $1,900 and selling in Europe at $1,911 yields an $11 profit per ounce, minus costs.
Advantages of Cross-Market Arbitrage
Profitability:
Provides risk-free or low-risk profit opportunities by exploiting temporary inefficiencies.
Market Efficiency:
Arbitrage helps reduce price discrepancies across markets, contributing to price convergence and stability.
Liquidity Enhancement:
Arbitrageurs provide liquidity to both buying and selling markets, facilitating smoother transactions.
Diversification Opportunities:
By engaging across multiple markets and instruments, traders can diversify risk and return sources.
Challenges and Risks
Despite its theoretical risk-free nature, cross-market arbitrage involves certain challenges:
Execution Risk:
Delay in simultaneous execution can turn a profitable arbitrage into a loss.
Settlement Risk:
Especially in international markets, differences in settlement cycles may expose traders to counterparty risk.
Market Volatility:
Sudden price swings can eliminate arbitrage opportunities before trades are completed.
High Competition:
With widespread algorithmic trading, arbitrage opportunities are quickly exploited, requiring speed and technological edge.
Regulatory Constraints:
Cross-border transactions may be subject to capital controls, taxes, or trading restrictions.
Currency Risk:
For cross-border arbitrage, currency fluctuations can affect the net profit.
Technological Impact
In modern finance, technology has revolutionized cross-market arbitrage:
High-Frequency Trading (HFT):
HFT firms use complex algorithms to detect and execute arbitrage trades in microseconds.
Real-Time Market Data:
Access to live data feeds across global exchanges allows traders to react instantaneously to price discrepancies.
Automated Risk Management:
Algorithms continuously calculate transaction costs, slippage, and exposure, optimizing profitability.
Global Connectivity:
Advanced communication networks allow simultaneous trading across continents, making arbitrage more efficient.
Regulatory and Ethical Considerations
Cross-market arbitrage, while legal, must comply with regulations in each jurisdiction:
Insider Trading and Market Manipulation:
Traders must avoid using non-public information to gain an unfair advantage.
Exchange Rules:
Some exchanges restrict certain arbitrage practices or require disclosure of large trades.
Cross-Border Compliance:
International arbitrage must follow anti-money laundering (AML) laws, tax regulations, and trading restrictions.
Ethically, arbitrage contributes to market efficiency, benefiting all participants by reducing unfair price deviations.
Conclusion
Cross-market arbitrage is a cornerstone of modern trading and financial theory. By exploiting temporary price inefficiencies across markets, arbitrageurs play a critical role in ensuring market efficiency, providing liquidity, and stabilizing asset prices. While the practice offers significant opportunities for profit, it also demands speed, precision, and advanced technological infrastructure, especially in the era of high-frequency trading and globalized financial markets.
Moreover, successful arbitrage requires a deep understanding of market dynamics, transaction costs, regulatory frameworks, and risk management. As financial markets continue to evolve, cross-market arbitrage will remain a vital tool for traders, institutions, and regulators aiming to maintain efficient, fair, and liquid markets.
In a world where milliseconds can determine profit or loss, cross-market arbitrage exemplifies the interplay between strategy, technology, and market forces, highlighting both the ingenuity and challenges inherent in global finance.

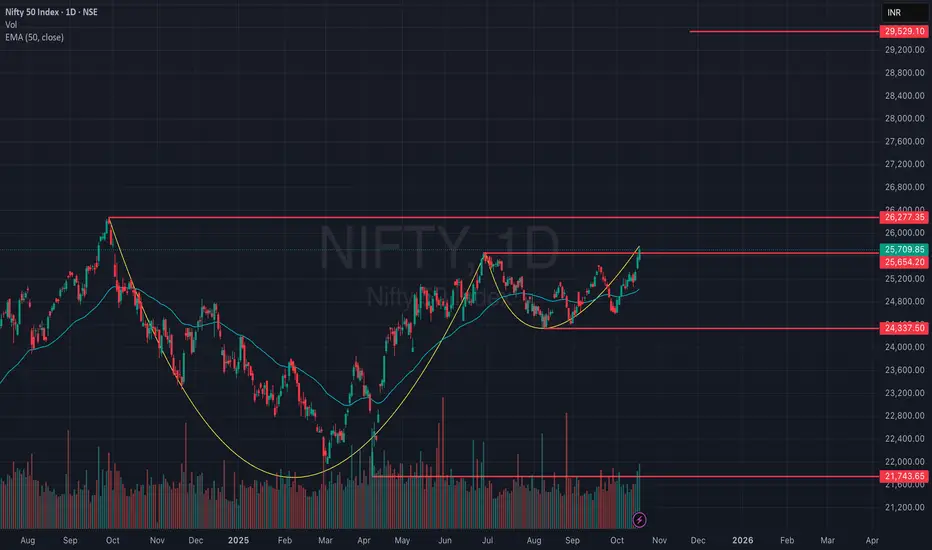
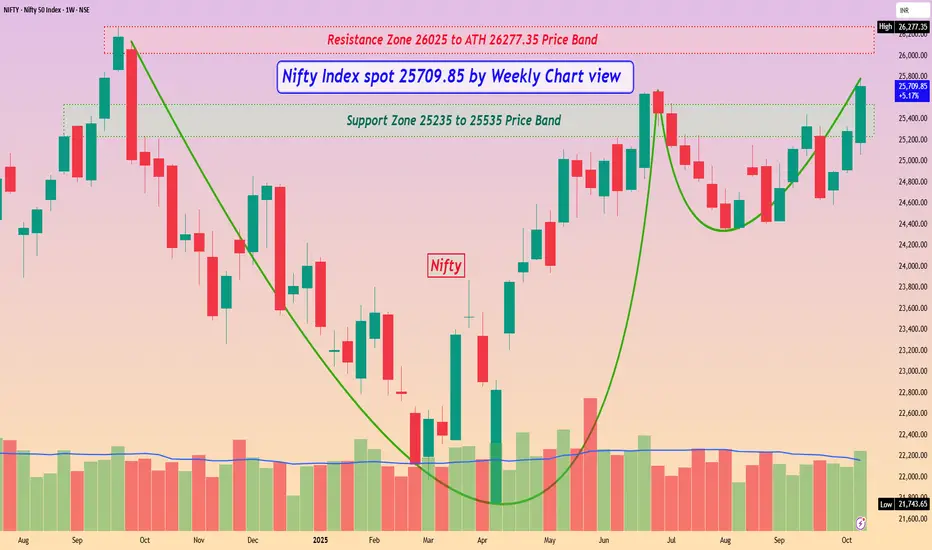
Nifty Index spot 25709.85 by Weekly Chart viewNifty Index spot 25709.85 by Weekly Chart view
- Support Zone 25235 to 25535 Price Band
- Resistance Zone 26025 to ATH 26277.35 Price Band
- Crystal Clear Bullish Cup & Handle formed around Support Zone
- Lets hope for the best to happen based on this Nifty 50 Index Chart setup
- Sharing this beautiful Nifty Index Chart setup, courtesy by a curious Co-Learners observation 😊👍🏽🤞🏽
Nifty Mad Bull Unleashed !! 30000Nifty has Broken out of The Falling Trendline after testing the Bottom of the Rising Parallel Channel!
Ready to test ATH with Target set at 30,000ish
🐂
No Rocket Science Simple Tech Analysis
Every Dip Can be Bought!

Nifty 50 Index - Supply Zone Breakout- Trend Resitance📊 Nifty 50 Index – Supply Zone Breakout & Resistance Retest
Nifty has successfully broken out above a key supply zone, signaling renewed bullish momentum in the broader trend. However, Friday’s session showed a fake trendline breakout, suggesting possible short-term indecision among market participants.
🔍 Key Technical Highlights:
Supply Zone Breakout: The price managed to clear the upper resistance band, confirming breakout strength.
Fake Trendline Breakout: Friday’s candle closed back within the structure, indicating that follow-through buying was weak.
Resistance Watch: A decisive close above 25,800 remains crucial for establishing a new All-Time High (ATH) and validating bullish continuation.
Support Levels: The breakout zone around 25,550–25,600 now acts as immediate short-term support.
📚 Educational Insight:
Breakouts from supply zones often face retests or false signals before establishing a sustainable move. Traders monitor closing strength, volume confirmation, and follow-up candles to distinguish between fake breakouts and genuine momentum shifts.
⚠️ This chart and commentary are shared purely for educational purposes. It is not financial advice or a trade recommendation. Always perform your own research and risk assessment before taking any market position.

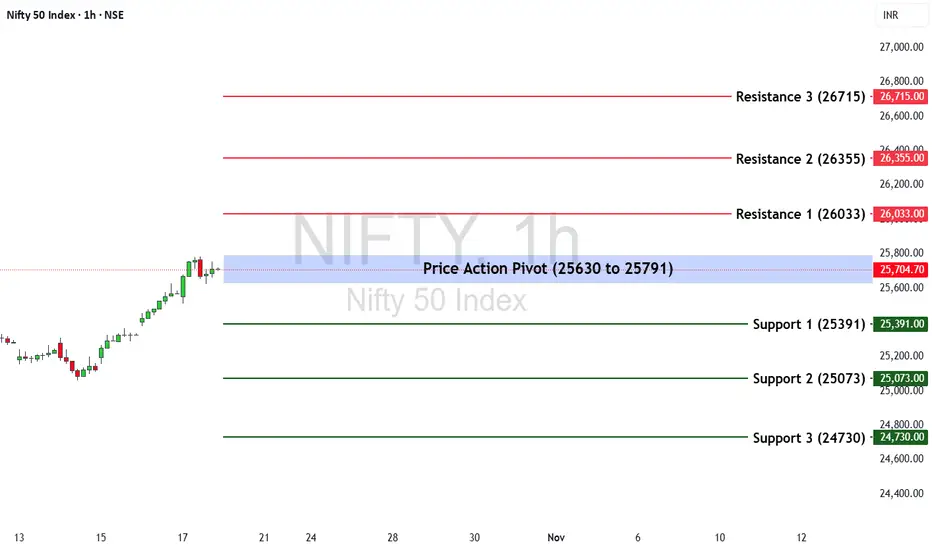
Nifty 50 Weekly Outlook (20th Oct – 24th Oct 2025)The Nifty 50 ended the week at 25,709.85, gaining +1.68%.
🔹 Key Levels for the Upcoming Week
📌 Price Action Pivot Zone:
25,630 to 25,791 – This blue-shaded range will act as the critical zone. A breakout or breakdown from this area may determine the next directional move.
🔻 Support Levels:
S1: 25,391
S2: 25,073
S3: 24,730
🔺 Resistance Levels:
R1: 26,033
R2: 26,355
R3: 26,715
📈 Market Outlook
✅ Bullish Scenario:
If Nifty sustains above the pivot zone high of 25,791, buyers may take control, pushing the index toward R1 (26,033), with potential upside targets at R2 (26,355) and R3 (26,715).
❌ Bearish Scenario:
If the index slips below the pivot zone low of 25,630, it may witness profit booking or selling pressure. In that case, Nifty could move toward S1 (25,391) and possibly extend losses to S2 (25,073) and S3 (24,730).
Disclaimer: tinyurl.com
Nifty 50 1 Day Time Frame 📊 Key Technical Levels (1-Day Time Frame)
Support Levels: 25,508.60 – 25,350 INR
Resistance Levels: 25,700 – 25,781.50 INR
Pivot Level: Approximately 25,600 INR
🔍 Market Sentiment
The Nifty 50 Index is exhibiting a bullish trend, trading above the critical 25,000 INR level. However, investors should monitor for any signs of reversal or consolidation in the coming sessions.
Which Trading Style You Should Choose in the Indian Trading MarkIntroduction
The Indian stock market has evolved into one of the most dynamic and liquid markets in the world, offering numerous opportunities for traders and investors. From the Bombay Stock Exchange (BSE) to the National Stock Exchange (NSE), millions of market participants engage daily in buying and selling securities. Yet, the choice of trading style determines whether one succeeds or fails in the market. Selecting the right trading style is not merely about making profits—it is about aligning your personality, capital, risk appetite, and time availability with a specific method of trading.
India’s market participants generally adopt one of several trading styles: intraday trading, swing trading, positional trading, scalping, or long-term investing. Each style has its unique approach, timeframe, and risk-reward ratio. This essay explores these styles in depth and helps you identify which one suits you best in the Indian trading environment.
1. Understanding Trading Styles
A trading style is a strategy that defines how long you hold a position, how you manage risk, and how actively you participate in the market. Broadly, trading styles range from short-term (intraday, scalping) to medium-term (swing, positional) to long-term (investing). The Indian market’s volatility, liquidity, and regulatory environment make all these styles viable under the right circumstances.
Let’s break down the major trading styles commonly used in India.
2. Intraday Trading
Definition
Intraday trading, or day trading, involves buying and selling stocks within the same trading day. The trader closes all positions before the market closes, avoiding overnight risk.
Characteristics
Timeframe: Minutes to hours
Goal: Capture small price movements within a day
Tools Used: Technical indicators like moving averages, RSI, MACD, and price action analysis
Common Stocks: Highly liquid shares like Reliance Industries, HDFC Bank, TCS, and Infosys
Advantages
Quick returns: Profits can be realized the same day.
No overnight risk: Avoids losses due to global or after-market events.
High liquidity: Frequent opportunities to trade due to India’s active market participants.
Disadvantages
High stress and screen time: Requires constant monitoring.
Leverage risk: Brokers offer intraday margins that can magnify losses.
Emotional discipline: Fear and greed can lead to impulsive decisions.
Who Should Choose Intraday Trading
If you are a full-time trader who can monitor the market actively from 9:15 AM to 3:30 PM, have strong technical knowledge, and can handle volatility, intraday trading may suit you. It’s ideal for individuals who thrive on quick decision-making and have high-risk tolerance.
3. Scalping
Definition
Scalping is an ultra-short-term trading style aimed at making multiple small profits throughout the day. Scalpers usually hold positions for seconds or minutes.
Characteristics
Timeframe: Seconds to a few minutes
Number of Trades: Dozens or even hundreds daily
Instruments Used: Liquid stocks, Nifty or Bank Nifty futures, and options
Advantages
Frequent opportunities: Small moves occur constantly in liquid stocks.
Low exposure risk: Positions are closed very quickly.
Disadvantages
Brokerage and transaction costs: High volume of trades increases costs.
Requires speed and precision: A few seconds delay can cause losses.
Mental exhaustion: Demands extreme focus and fast reflexes.
Who Should Choose Scalping
Scalping is best for experienced traders with access to advanced trading terminals, fast internet connections, and low-cost brokerage accounts. It suits those who can make lightning-fast decisions and have the discipline to exit trades quickly without hesitation.
4. Swing Trading
Definition
Swing trading involves holding positions for several days to weeks to profit from short- to medium-term market trends. It’s a popular style in India because it balances risk and time commitment.
Characteristics
Timeframe: 2 days to 3 weeks
Goal: Capture “swings” or trend movements in the market
Tools Used: Chart patterns, Fibonacci retracements, trendlines, and moving averages
Advantages
Less stressful than intraday: No need to monitor the screen all day.
Captures significant price moves: Larger potential profit per trade.
Ideal for working professionals: Can be managed part-time with end-of-day analysis.
Disadvantages
Overnight risk: Prices can gap up or down due to global cues.
Requires patience: You may need to hold trades longer than expected.
Who Should Choose Swing Trading
Swing trading is ideal for working professionals or students who cannot watch the market all day but can spend some time analyzing charts in the evening. If you prefer moderate risk and can stay patient for days or weeks, swing trading may be your best fit.
5. Positional Trading
Definition
Positional trading involves holding trades for weeks to months, focusing on broader trends rather than daily fluctuations. It’s a blend between swing trading and long-term investing.
Characteristics
Timeframe: Several weeks to a few months
Goal: Benefit from medium-term market trends
Tools Used: Fundamental analysis combined with technical trend identification
Advantages
Lower stress: Minimal screen time required.
Rides big market trends: Captures major directional moves.
Less brokerage cost: Fewer trades mean lower transaction fees.
Disadvantages
Capital lock-in: Funds remain tied for longer durations.
Higher overnight risk: Exposed to economic and policy changes.
Who Should Choose Positional Trading
If you are a part-time trader who believes in broader market cycles and wants to balance risk and reward, positional trading is suitable. It fits individuals with moderate risk tolerance who want consistent returns without daily stress.
6. Long-Term Investing
Definition
Long-term investing focuses on buying quality companies and holding them for years, benefiting from business growth and compounding. In India, this style is associated with value investors like Rakesh Jhunjhunwala and Radhakishan Damani.
Characteristics
Timeframe: Several years or even decades
Goal: Wealth creation through capital appreciation and dividends
Tools Used: Fundamental analysis, company financials, economic outlook
Advantages
Compounding effect: Wealth grows exponentially over time.
Lower risk: Less affected by short-term volatility.
Tax benefits: Long-term capital gains tax is lower than short-term.
Disadvantages
Patience required: Returns take time to materialize.
Market cycles: Long bear phases can test confidence.
Who Should Choose Long-Term Investing
Long-term investing suits professionals, business owners, and retirement planners who want to build wealth gradually without actively trading. It’s perfect for those with low-risk tolerance and a belief in India’s economic growth story.
7. Factors to Consider Before Choosing a Trading Style
1. Risk Appetite
If you can handle frequent losses and volatility, intraday or scalping might fit you. If you prefer stable returns, swing or positional trading is better.
2. Capital Availability
Some trading styles, especially intraday and positional trading, require sufficient capital to manage margin and risk effectively.
3. Time Commitment
If you can monitor markets throughout the day, intraday or scalping may suit you. Otherwise, swing or long-term investing is ideal.
4. Market Knowledge
Beginners should start with swing or positional trading to learn market behavior before moving to faster styles like scalping.
5. Personality Type
Are you patient or impulsive? Aggressive or analytical? Scalping needs quick reflexes, while investing needs calm patience.
8. The Indian Context: Market Volatility and Regulation
The Indian stock market is influenced by:
High retail participation (especially in NSE’s F&O segment)
Regulatory oversight by SEBI
Global factors like crude oil prices, U.S. interest rates, and geopolitical tensions
Volatility in Indian indices like Nifty50 and Bank Nifty creates ample opportunity for short-term traders. However, long-term investors benefit from India’s economic expansion, strong corporate earnings, and government reforms. Hence, your choice must align with both your goals and India’s market conditions.
9. Blended Approach: The Smart Trader’s Edge
Many successful Indian traders adopt a hybrid approach:
They keep long-term investments in fundamentally strong companies.
Simultaneously, they trade short-term trends for additional income.
For example, you may hold long-term positions in HDFC Bank or Infosys while taking short-term trades in Nifty futures. This diversification balances risk and reward efficiently.
10. Conclusion
Choosing the right trading style in the Indian market is about self-awareness as much as market knowledge. There is no “one-size-fits-all” approach — your trading style must reflect your financial goals, risk tolerance, time commitment, and emotional temperament.
If you are a risk-taker with full-time availability, intraday trading or scalping might be your arena. If you have a job or business and want to participate without daily stress, swing or positional trading offers balance. If your focus is wealth creation, long-term investing remains the timeless path.
The Indian market, with its vast opportunities and volatility, rewards discipline, patience, and strategy. The best trading style is not the one that makes money the fastest — it’s the one you can follow consistently without losing sleep or confidence. Master your chosen style, manage your risk, and the Indian market will open endless opportunities for financial growth.
Nifty50 - 4th November 2025 TrendHi everyone, I’m still learning technical analysis, but I wanted to share my observation and get your views.
Multi-Year Channel (2020–2025):
Nifty has been moving steadily inside a long-term rising channel since 2020.
The current price is below the median, but the trend suggests it’s trying to retest the median line.
Based on the current pace, this retest could happen around October 20th–28th expiry — if the recent short-term momentum continues.
Short-Term Channel (Aug–Oct 2025):
The recent trend (from August to mid-October) is also forming a smaller upward channel within the broader structure.
This local channel points toward a potential test of 25,700 / 25,800 / 26,000, which aligns perfectly with the multi-year median zone.
Possible Scenario:
If Nifty reaches 25,700–26,000 and fails to sustain above it, a short-term reversal looks probable.
The downside levels to watch could be around the Bollinger Band median near 25,100, or even 24,900, based on the short-term channel support.
Indicators:
RSI is near 70 and Stoch RSI around 90–100, showing overbought conditions.
Price is at the upper Bollinger Band and near trendline resistance — suggesting possible exhaustion unless a strong breakout happens.
I’d love to hear your thoughts — does this setup look valid or am I missing something?

Nifty Structure Analysis & Trade Plan: 2025-10-201. Market Structure Analysis (Top-Down)
Higher Timeframe (4H / Daily) Bias: The Nifty 50 is in a Strong Bullish Trend. The recent price action confirms a continuation, with the index decisively making a Higher High on Friday. The institutional bias is clearly to the long side, meaning the highest probability trades will be Buys. We are currently in an Overbought condition, so a pullback is healthy and expected before the next leg up.
Immediate Structure (1H / 15M): The strong rally has left significant Fair Value Gaps (FVG), which function as institutional magnets or price inefficiency areas that the market tends to revisit. We will use these FVG zones as our Points of Interest (POI) for low-risk entries.
Current MSS Status: There is NO Market Structure Shift (MSS) to the downside. The structure remains bullish. A bearish MSS would only be confirmed if the price breaks below a major swing low with displacement.
2. Key Levels and Points of Interest (POI)
Immediate Resistance / Target Zone: The area between 25,800 and 26,000 contains the next psychological barrier and liquidity zone before the all-time high. This will be our primary profit-taking zone for long trades.
Primary Demand Zone (POI / FVG): The critical area for a pullback entry is between 25,400 and 25,500. This zone aligns with the first major FVG created during the strong impulse move and should attract institutional buying.
Critical Invalidating Low: The major swing low that protects the current uptrend is 25,250.
3. Trade Setup: Bullish MSS Reversal (Primary Plan - Buy the Dip)
This setup targets a continuation of the primary trend following a retracement to an institutional POI.
Scenario: Price opens or retraces into our Primary Demand Zone (25,400 - 25,500).
Entry Zone: Wait for the price to drop into the 25,400 to 25,500 region.
Entry Trigger: On the lower timeframe (e.g., 5-minute chart), wait for the price to show a rejection or confirm a local Bullish MSS (break of the internal lower high) inside the 25,400 - 25,500 zone. Execute a Long (Buy) trade on this confirmation.
Stop-Loss (SL): Place the stop-loss order safely below the demand zone at approximately 25,380.
Take-Profit (TP):
T1: Target the recent high at 25,750.
T2: Target the next major psychological level at 26,000.
4. Contingency Plan: Bearish MSS (High-Risk Reversal)
This plan is for a major structural shift that confirms the bullish trend is over.
MSS Confirmation: The Nifty breaks and sustains a close below the Critical Low of 25,250 on the 15-minute or 1-hour chart with a strong displacement. This is a definitive Bearish MSS.
Entry Trigger: Execute a Short (Sell) trade on the retest (pullback) to the broken 25,250 level (which now acts as new resistance).
Stop-Loss (SL): Place the stop-loss order above the new supply zone, around 25,350.
Take-Profit (TP): Target the next major support levels: 25,100 and 25,000 (Psychological support).

17 Oct 2025 – 869pts profits and counting on Nifty + PostMortemNifty Stance Bullish 🐂
The last crossover signal for long was on 3rd Oct 2025, and since then, Nifty has gone up a whopping 869pts. After April 2025, this is the longest long-only streak by Nifty this year.
Surprisingly, Nifty almost crossed over on 14th October at 15.23. If the market were open for the next 32 minutes, we would have gone short. In fact, I was looking at the open on 15th, wherein we gapped up and then rallied. If the markets had fallen in the opening 16mts, we would have gone short as well, reducing our profits. This time, the long only stance had a bit of luck as well.
From the 15th Oct, the next three days also saw a one-sided upmove, almost magical. What is more surprising is that the actual portfolio's upmove is not even half of what Nifty was moving. I was checking my portfolio from the 3rd to the 17th, and it is not even up 1.7% versus Nifty, which went up 3.5%.
The last known resistance was 25681, and we are above that, meaning Nifty can directly aim at the all-time highs of 26277. If you look at the daily chart, Nifty had reconquered these levels on 30th June, but we started falling badly thereafter. For the current uptrend to continue, we must stay above 25681 on Monday.
---
If you liked this article, consider sharing it with someone who could benefit from this.

#Nifty Weekly Analysis 20-10-25 to 24-10-25#Nifty Weekly Analysis 20-10-25 to 24-10-25
25500-25780 is the sideways range for nifty next week.
Long above 25780 for the targets of 26000/26200.
25480-25500 is the support for this week and also
ideal pull back level for long for the targets of 25780/26000.
Short level is only below 25480 for the targets of 25400/25300.
View: Sideways to Upside.
Nifty vs Gold vs Silver Return between 2020-2025⚡ See how 3 major assets performed on a single chart.
💰 Helps you spot outperformers & diversify smartly.
📈 Data visualized using TradingView.
🚀 Follow for more market hacks!

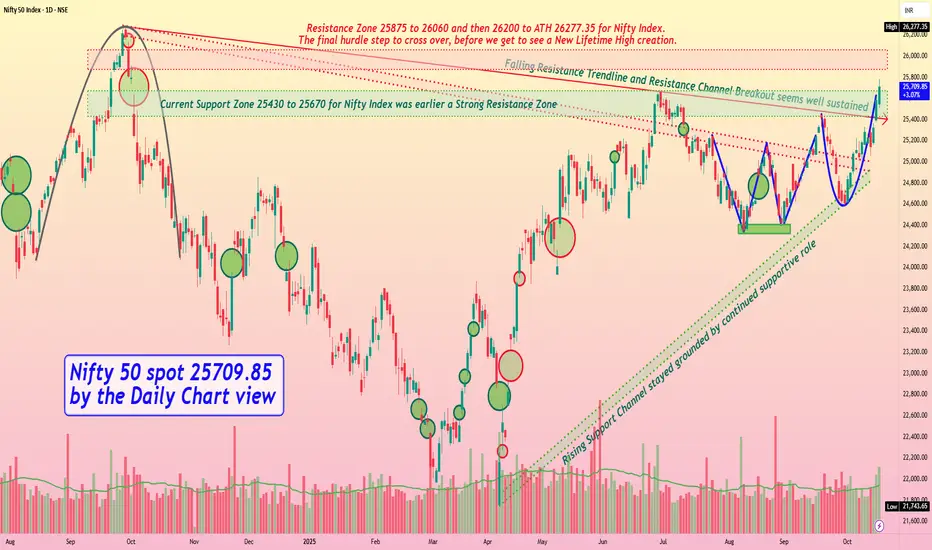
Nifty 50 spot 25709.85 by the Daily Chart view - Weekly updateNifty 50 spot 25709.85 by the Daily Chart view - Weekly update
- [ b]Nifty Index now just 567.50 points away from ATH 26277.35 for creating a New Lifetime High Milestone
- Resistance Zone 25875 to 26060 and then 26200 to ATH 26277.35 for Nifty Index
- The final hurdle step to cross over before we get to see a New Lifetime High creation
- Both Falling Resistance Trendline and Resistance Channel Breakout seem well sustained
- Current Support Zone 25430 to 25670 for Nifty Index was earlier a Strong Resistance Zone
- Rising Support Channel has stayed firmly grounded by providing the continued supportive role
- Bullish Technical patterns Double Bottom "W" followed by Rounding Bottom formed by Support Zone neckline
Nifty 50 Technical Analysis (October 19 To 24 , 2025)The Nifty 50 index closed at 25,709.85 INR, marking a gain of +124.55 points or +0.49% for the day.
Based on the latest data, the overall technical outlook is Strong Buy, driven by bullish signals from moving averages and technical indicators.
Key Support Levels (Aggregated):Immediate: 25,500–25,300
Strong: 24,850–25,613.58
Deep: 23,530–23,400
Key Resistance Levels (Aggregated):Immediate: 25,760
Next: –26,370.
Next Immediate Target : 26,300
Monthly Target - 28,000 - 28,500
Overall Outlook
The Nifty 50 shows robust bullish momentum in the short to medium term, with the index well above its 200-day moving average and supported by strong indicator readings. However, overbought conditions in momentum oscillators suggest possible minor pullbacks—watch for support around 25,500 - 25,300. Traders might consider buying on dips For Targets 26,300 - 28,000 - 28,500 . Always combine with risk management and fundamental factors.
Disclaimer
High Risk Investment
Trading or investing in assets like crypto, equity, or commodities carries high risk and may not suit all investors.
Analysis on this channel uses recent technical data and market sentiment from web sources for informational and educational purposes only, not financial advice. Trading involves high risks, and past performance does not guarantee future results. Always conduct your own research or consult a SEBI-registered advisor before investing or trading.
This channel, Render With Me, is not responsible for any financial loss arising directly or indirectly from using or relying on this information.

Nifty Breakout!Breaking out on falling trendline and cup & handle pattern, making 52 week high of 25781.50, nifty might retest the trendline but overall sentiments turns positive with FII being buyers in some recent sessions. With this breakout we can expect nifty to hit a new all time high of around 26500.

Nifty Intraday Analysis for 17th October 2025NSE:NIFTY
Index is poised to make a new All Time High in coming weeks as the Momentum has shifted upward.
Index has resistance near 25750 – 25800 range and if index crosses and sustains above this level then may reach near 25950 – 26000 range.
Nifty has immediate support near 25450 – 25400 range and if this support is broken then index may tank near 25250 – 25200 range.
