A quick alert for Nifty PUT buyers; 17/10/25All details in the video. Be alert for potential pitfalls in the market. If holding trades, make sure you know your exit points.
In my opinion, we have another high pending this Diwali 👍🏻
Trade ideas

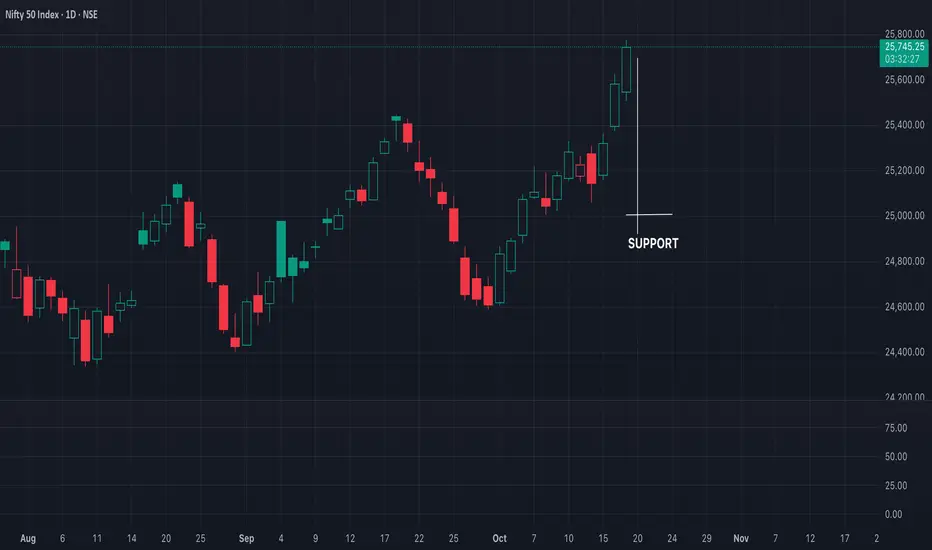
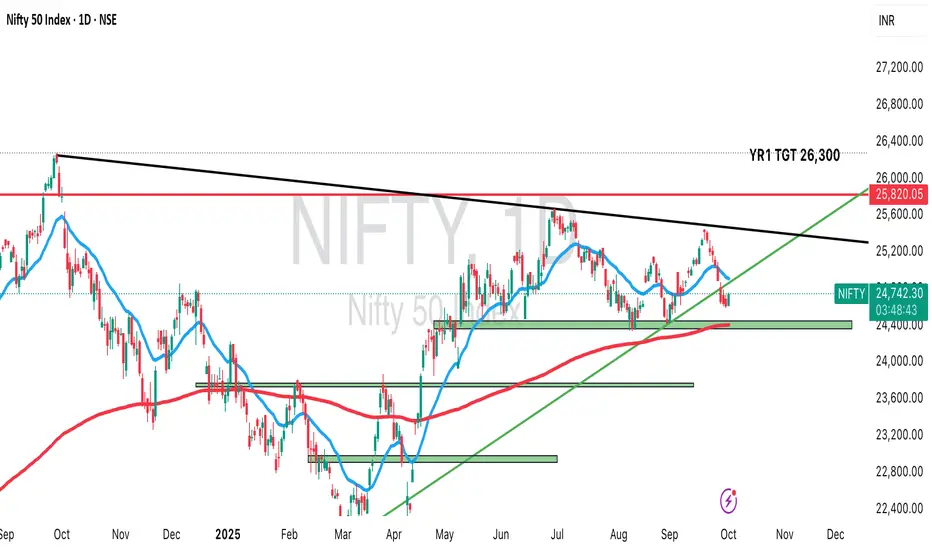
Nifty 50 Hits Major Supply Zone After Trendline & VCP Breakout!Today, we're diving deep into the Nifty 50 chart, which is painting a very interesting picture. After a significant downturn, the bulls have been patiently and persistently fighting back. We've seen the index respect several supply zones in the past, leading to temporary declines. However, the character of the market seems to be shifting, and a major breakout has just occurred that we need to talk about.
🚀 A Tale of Two Patterns: Triangles and VCPs
If you look closely at the price action, a story unfolds. For months, Nifty was constrained by a sloping trendline, getting rejected from it on two separate occasions. At the same time, the price was carving out a series of higher lows. This convergence of a flat top (the trendline resistance) and rising bottoms formed a classic ascending triangle pattern—a sign of building bullish pressure.
What makes this setup even more compelling is the subtle pattern within the pattern: a Volatility Contraction Pattern (VCP). Notice how after each minor decline, the pullbacks became shallower. This "drying up" of selling pressure is a textbook sign that sellers are losing control and the big players are accumulating positions. The formation of this VCP right before the breakout was a strong hint that the subsequent move could be powerful and decisive.
Yesterday, we witnessed the culmination of this battle. The price broke out of the triangle and shattered the downward-sloping trendline with significant momentum, slicing through previously tested supply zones. This is a clear victory for the bulls in the short to medium term.
What's Next? Navigating the Path Ahead 🎯
Now for the million-dollar question: where do we go from here? The breakout is strong, but the path ahead isn't without its obstacles.
The Immediate Hurdle: Price is currently pushing into a fresh supply zone . This is the first significant test for the bulls post-breakout. We should anticipate some friction here as sellers who were waiting at these levels might try to defend their territory. This could lead to a bit of consolidation or a minor pullback, which is perfectly healthy.
The Ultimate Test: If the momentum continues and buyers overwhelm the sellers at the current zone, the next major target comes into view. This upper supply zone is particularly critical because it coincides with the All-Time High (ATH). The ATH is not just a technical level; it's a major psychological barrier where many traders may look to book profits. A rejection from this all-important zone is a high probability, given its significance.
In the upcoming sessions, we'll be watching closely to see how the price behaves at these key levels. The strength of the current momentum suggests that the immediate supply zone could be overcome, but the real test awaits at the peak.
Lastly, Thank you for your support, your likes & comments. Feel free to ask if you have questions.
The goal of a successful trader is to make the best trades. Money is secondary.
Disclaimer: Please note that this analysis is purely for educational purposes and should not be considered as a trading or investment recommendation. I am not a SEBI registered Analyst. Always conduct your own research and consult with a financial advisor before making any investment decisions.

NIFTY GETTING OVERVALUED Amid soft global cues, Nifty’s recent jump appears unsupported by fundamentals. Global markets are subdued, with U.S. indices trending lower and Fed rate expectations uncertain. Domestically, banks have already priced in new provisions, while IT remains a laggard with no fresh triggers, indicating the rally lacks breadth or conviction .
India’s MEA denial of Trump’s Russian oil claim adds geopolitical noise, potentially straining trade sentiment . The move from the recent support zone (“value line”) has been too steep and low-volume, suggesting distribution at current levels (~25,700–25,900).
Technically, Nifty faces strong downside risk toward 25,500–25,000, especially if global weakness persists. With no tangible drivers to justify this rise, traders should remain cautious — a short-term pullback looks increasingly probable.
Sources:
Reuters – India’s Nifty at one-year high as Reliance counters IT pressure
Politico – India contradicts Trump on Russian oil pledge
The Guardian – India casts doubt on Trump’s claims on Russian oil
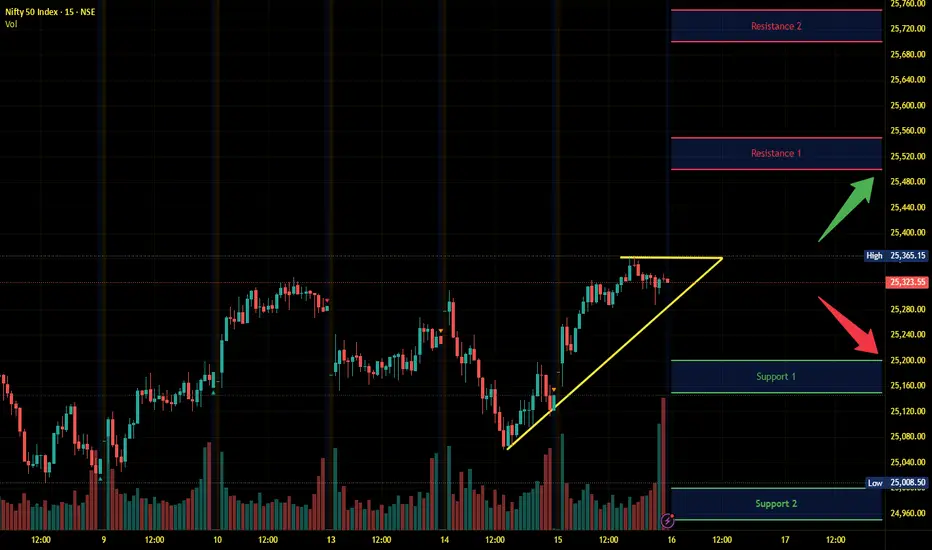
NIFTY KEY LEVELS FOR 17.10.2025NIFTY KEY LEVELS FOR 17.10.2025
Timeframe: 3 Minutes
If the candle stays above the pivot point, it is considered a bullish bias; if it remains below, it indicates a bearish bias. Price may reverse near Resistance 1 or Support 1. If it moves further, the next potential reversal zone is near Resistance 2 or Support 2. If these levels are also broken, we can expect the trend.
When a support or resistance level is broken, it often reverses its role; a broken resistance becomes the new support, and a broken support becomes the new resistance.
If the range(R2-S2) is narrow, the market may become volatile or trend strongly. If the range is wide, the market is more likely to remain sideways
please like and share my idea if you find it helpful
📢 Disclaimer
I am not a SEBI-registered financial adviser.
The information, views, and ideas shared here are purely for educational and informational purposes only. They are not intended as investment advice or a recommendation to buy, sell, or hold any financial instruments.
Please consult with your SEBI-registered financial advisor before making any trading or investment decisions.
Trading and investing in the stock market involves risk, and you should do your own research and analysis. You are solely responsible for any decisions made based on this research.

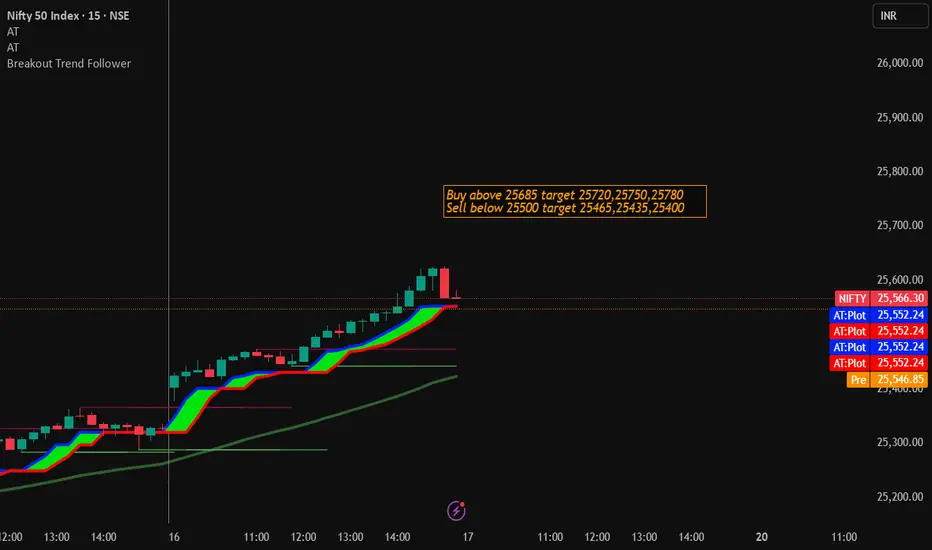
Nifty Trading Strategy for 17th October 2025📊 NIFTY INTRADAY LEVELS –
🚀 Buy Setup:
👉 Buy Above: 25685 (after 15-min candle close above this level)
🎯 Targets:
25720 🥇
25750 🥈
25780 🏁
⚠️ Stoploss: Below the breakout candle low
🔻 Sell Setup:
👉 Sell Below: 25500 (after 15-min candle close below this level)
🎯 Targets:
25465 🥇
25435 🥈
25400 🏁
⚠️ Stoploss: Above the breakdown candle high
📌 Notes:
Always wait for candle confirmation and volume support.
Avoid trading during high volatility news events.
Follow proper risk management (1:2 or better RR).
⚖️ Disclaimer:
📢 I am not a SEBI-registered analyst.
This analysis is for educational and informational purposes only.
Please consult your financial advisor before taking any trades.
Trading in the stock market involves risk of capital loss — trade responsibly. 💹
nifty targeting towards 26000cup and handle formation on nifty chart, buy for target 26000 with strict stoploss of as shown in chart.

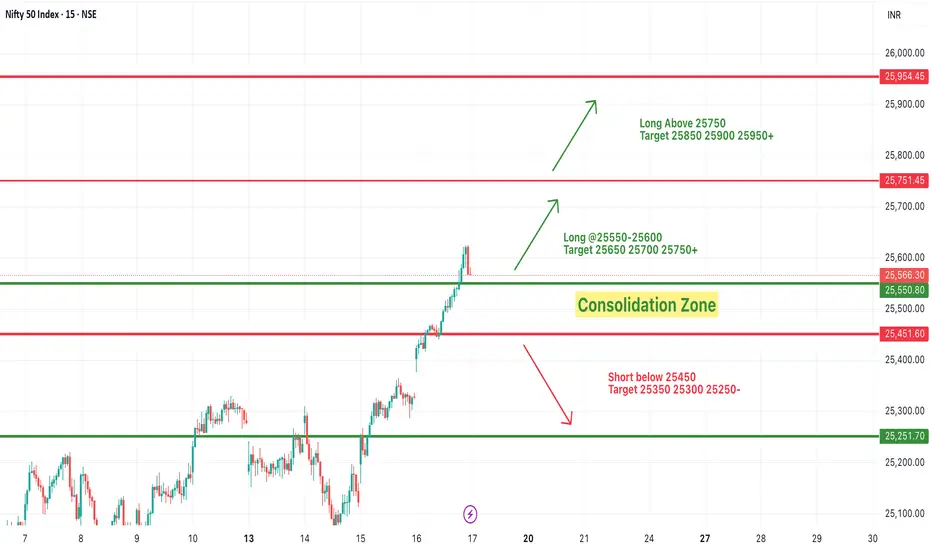
#NIFTY Intraday Support and Resistance Levels - 17/10/2025Nifty is likely to open with a gap up near the 25,550–25,600 zone, continuing the strong bullish momentum from the previous session. The index has broken out of its recent consolidation zone, indicating buyer strength and potential continuation toward higher levels.
If Nifty sustains above 25,600–25,650, we may witness a further rally toward 25,700, 25,750, and 25,850+ levels. A breakout above 25,750 will further strengthen the bullish trend, opening the path toward 25,900–25,950+.
On the downside, immediate support lies near 25,450–25,400. A drop below this zone could lead to a mild retracement toward 25,350, 25,300, and 25,250 levels.
Overall, the sentiment remains strongly bullish with a gap up opening, but traders should stay alert near upper resistance zones as short-term profit booking may occur. Maintaining a trailing stop loss and booking partial profits at key targets is advisable to safeguard gains.
NIFTY Levels for TodayHere are the NIFTY's Levels for intraday (in the image below) today. Based on market movement, these levels can act as support, resistance or both.
Please consider these levels only if there is movement in index and 15m candle sustains at the given levels. The SL (Stop loss) for each BUY trade should be the previous RED candle below the given level. Similarly, the SL (Stop loss) for each SELL trade should be the previous GREEN candle above the given level.
Note: This idea and these levels are only for learning and educational purpose.
Your likes and boosts gives us motivation for continued learning and support.
25500++ is here!!! heading towards new ATH!!??As we can see NIFTY finally achieved our target and also broke above the important supply zone and psychological level of 25500 with ease and managed to close above. Moreover, it has formed a strong bullish candle with volume and if tomorrow it manages to close above 25550, we will see a strong weekly candle too hence tomorrows day and closing can be crucial for deciding upcoming rally in market so plan your trades accordingly and keep watching everyone.

NIFTY – Professional Trading Plan for 17-Oct-2025NIFTY – Professional Trading Plan for 17-Oct-2025 (educational)
Market context and key levels
Reference from your map: Opening/last intraday resistance 25,659–25,674, strong resistance zone 25,720–25,740, opening pivot 25,549, last intraday supports 25,426 and 25,363. Momentum remains constructive while above 25,549; sustained acceptance above 25,674 is needed for continuation. 🚦
GAP UP OPEN (≥ +100 pts)
Educational logic: Positive gaps can trap late shorts; edge comes from waiting for acceptance above resistance (time + volume) and then riding continuation rather than chasing the first spike. 📈
If open lands around or just above 25,659–25,674 and the first 5–15 minutes hold above VWAP/first high, consider a momentum long toward 25,700–25,720; scale partials, then trail for 25,740. Stop below the retest low of 25,650 zone.
If open jumps near 25,720–25,740, avoid impulsive buys into strong resistance. Prefer a pullback to 25,680–25,660; go long only on a higher low plus reclaim of 25,700 with stop under pullback low; targets 25,720–25,740 and possible extension if breadth expands.
Failure short: Rejection wicks from 25,720–25,740 followed by a 15‑min close back below 25,680. Take a tactical short toward 25,659 → 25,600–25,549; exit if 25,700 is reclaimed decisively.
FLAT OPEN (±0–50 pts)
Educational logic: Neutral opens favor range trades around nearby pivots until a breakout confirms with acceptance. ⚖️
Range buy: Look for reversal signals near 25,560–25,549 with risk below the session swing; targets 25,620 → 25,659–25,674.
Breakout buy: A 15‑min close and successful retest above 25,674 opens 25,700–25,720; scale out into 25,740 if momentum broadens.
Breakdown short: Acceptance below 25,549 on retest targets 25,500–25,426; if sellers maintain control, extend to 25,380–25,363. Trail using successive lower highs.
GAP DOWN OPEN (≤ −100 pts)
Educational logic: Negative gaps near support often lead to “gap‑and‑go” trend days if acceptance stays below, or sharp reversals if buyers defend key zones. 📉
Gap‑and‑go short: Open around 25,470–25,450 and failure to reclaim 25,549 on retest → short to 25,426; book partials, then trail for 25,380–25,363.
Reversal long: Strong rejection from 25,426–25,363 (long lower wicks/engulfing) → long back to 25,500 then 25,549; move stop to breakeven once 25,549 holds.
Bias flip: If price re-enters above 25,659 after a weak open and sustains, abandon shorts and prepare for rotation to 25,700–25,720; don’t fight a reclaim day.
Execution checklist
Predefine scenario, trigger (acceptance/retest), invalidation (where the idea is wrong), and first target.
Key decision areas: 25,549 support/pivot, 25,659–25,674 resistance, and 25,720–25,740 strong resistance; 25,426/25,363 supports. Trade the reaction to zones, not the exact number.
Use structure-based stops beyond the far side of the zone; scale out at the next pivot and trail to protect gains.
Options risk management tips
Define risk : Prefer debit spreads near zones (bull call above 25,674; bear put below 25,549) to cap tail risk on volatile gap opens.
Size by volatility: Wider expected range → smaller position; avoid oversizing because options look “cheap.”
Liquidity first: Use near‑ATM, current‑week Nifty options with tight spreads; avoid illiquid deep OTMs that decay fast if rangebound.
Confirm before entry: Use 5–15 min acceptance or clean retest holds to avoid false breaks; be cautious in the first 1–3 minutes unless trading a planned opening drive.
Manage winners: Take partials at first pivot; if IV expands, consider converting naked calls/puts into verticals to lock risk while keeping upside.
Avoid overlap: If structure flips (e.g., reclaim of 25,659 after breakdown), exit losers decisively instead of hedging passively.
Summary
Primary map: 25,549 is the intraday pivot; 25,659–25,674 is the gate to continuation; 25,720–25,740 is strong resistance. Upside opens on acceptance above 25,674 toward 25,720–25,740; downside strengthens below 25,549 toward 25,426 and 25,363. 🙂
Conclusion
Prepare three plays: continuation long above 25,674, responsive range trades around 25,549/25,659, and momentum shorts below 25,549 aiming 25,426–25,363. Execute with clear invalidations, scale responsibly, and adapt quickly if pivots are reclaimed. 📊
Disclaimer: This is an educational plan, not investment advice or a trade recommendation; I am not a SEBI registered analyst .

“Nifty 50 Intraday Key Levels | Buy & Sell Zones 17th Oct 2025”“Want to learn more? Like this post and follow me!”
25832 🔴 Above 10m closing Shot Cover Level
Strong resistance — short covering likely above this.
25720 🟠 Below 10m hold PE By level /
Above 10m hold CE by level
25623 🟣 Above 10M hold positive trade view
Below 10M hold negative trade view
Sentiment deciding level — crucial for trend direction.
25523 ⚫ Above Opening S1 10m Hold CE By level
Bullish entry level — CE hold area.
25433 🟠 Below Opening R1 10m Hold PE By level
Below 10m hold PE By Risky Zone Weak zone — PE may strengthen below this.
25327 🟢 Above 10M hold CE By Safe Zone level
Safe bullish zone — CE can be held confidently above.
25318 🔵 BELOW 10M hold UNWINDING level
Breakdown zone — unwinding or heavy selling possible below.

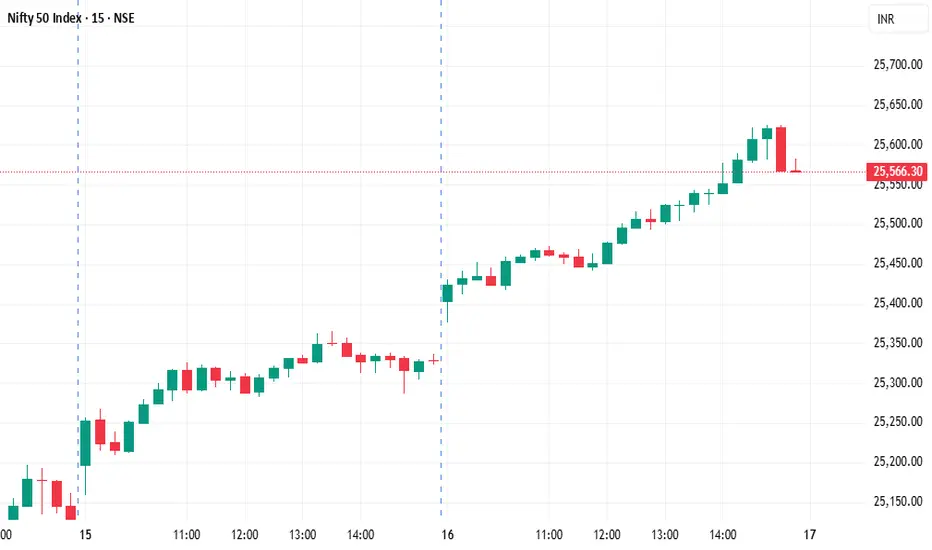
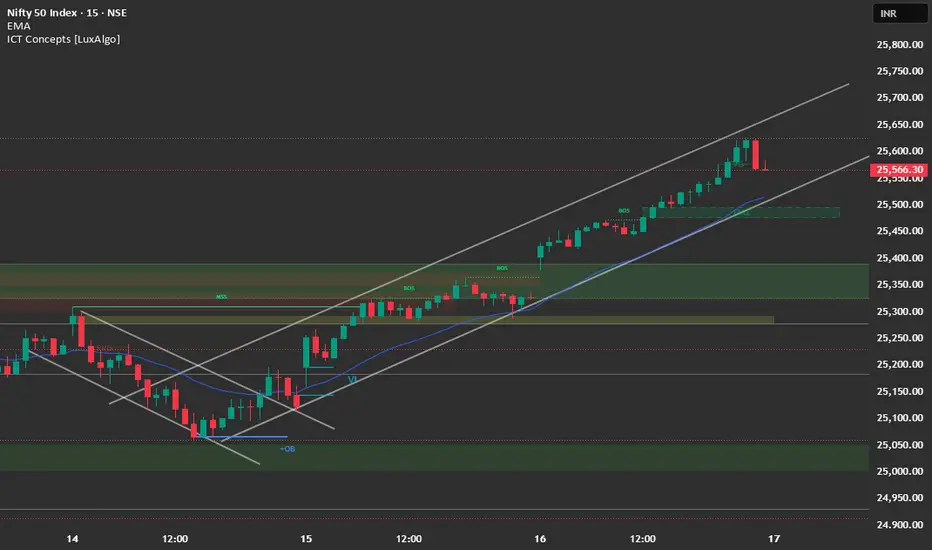
Nfity Structure Analysis & Trade Plan: 17th OctoberBased on the charts and the market's performance on Thursday, October 16, the Nifty experienced a powerful breakout, crossing the major resistance zone and closing near the day's high. The structure is now firmly bullish and aiming for higher targets.
Detailed Market Structure Breakdown
4-Hour Chart (Macro Trend)
Structure: The Nifty is now in a strong momentum phase. The price has decisively broken out above the 25,300 - 25,400 major supply zone, confirming the continuation of the bullish recovery. The candle has broken out of the ascending channel and is trading at levels not seen since the high in September.
Key Levels:
Major Supply (Resistance): 25,650 - 25,750. This area is the next significant resistance zone, aligning with the extended trendline (as seen on the 4H chart) and previous swing highs.
Major Demand (Support): 25,300 - 25,400. This area, which was the critical resistance zone, is now the new must-hold demand zone for the bulls.
Outlook: The short-term bias is strongly bullish. The rally is aggressive and the next target is near the 25,700 level.
1-Hour Chart (Intermediate View)
Structure: The 1H chart shows an exceptionally strong day, with the price making higher highs and higher lows and closing near the top. The bullish conviction is very high. The recent correction on Oct 14 was efficiently bought up at the FVG.
Key Levels:
Immediate Resistance: 25,650 (Upper channel trendline).
Immediate Support: 25,480 - 25,500 (Recent consolidation support and lower channel trendline).
15-Minute Chart (Intraday View)
Structure: The 15M chart confirms the powerful bullish momentum. The market consolidated around 25,450 and then broke out aggressively, closing at the day's high. The structure is a clear uptrend continuation.
Key Levels:
Intraday Supply: 25,650.
Intraday Demand: 25,480 - 25,500.
Outlook: Aggressively Bullish.
📈 Trade Plan (Friday, 17th October)
Market Outlook: The Nifty is in a high-conviction bullish trend. The market is also digesting Q2 results from IT majors (Infosys, Wipro, LTIMindtree). The primary strategy will be to buy on dips for continuation.
Bullish Scenario (Primary Plan)
Justification: The strong breakout and close above 25,300 - 25,400 strongly favor continuation towards the next major resistance.
Entry: Long entry on a decisive break and 15-minute candle close above 25,650 (breaking the upper channel). Alternatively, look for a dip entry near 25,480 - 25,500 (the immediate support/FVG zone).
Stop Loss (SL): Place a stop loss below 25,400 (below the major breakout level).
Targets:
T1: 25,750 (Extension target).
T2: 25,850 (Major weekly resistance).
Bearish Scenario (Counter-Trend Plan)
Justification: Only valid if a sharp sell-off occurs, likely due to unexpected negative global news or disappointing market reaction to the full suite of IT earnings.
Trigger: A decisive break and 1-hour candle close below 25,300.
Entry: Short entry below 25,300.
Stop Loss (SL): Above 25,450.
Targets:
T1: 25,150 (Previous consolidation support).
T2: 25,000 (Psychological support).
Key Levels for Observation:
Immediate Decision Point: 25,500 - 25,650 zone.
Bullish Confirmation: A break and sustained move above 25,650.
Bearish Warning: A move below 25,450 suggests profit-booking is aggressive.
Line in the Sand: 25,300. Below this level, the short-term bullish momentum is lost.
Time Cluster: Friday, Oct 17 is projected as a key time cluster for heightened momentum.
Nifty Intraday Analysis for 16th October 2025NSE:NIFTY
Momentum is shifting upward.
Index has resistance near 25500 – 25550 range and if index crosses and sustains above this level then may reach near 25700 – 25750 range.
Nifty has immediate support near 25200 – 25150 range and if this support is broken then index may tank near 25000 – 24950 range.
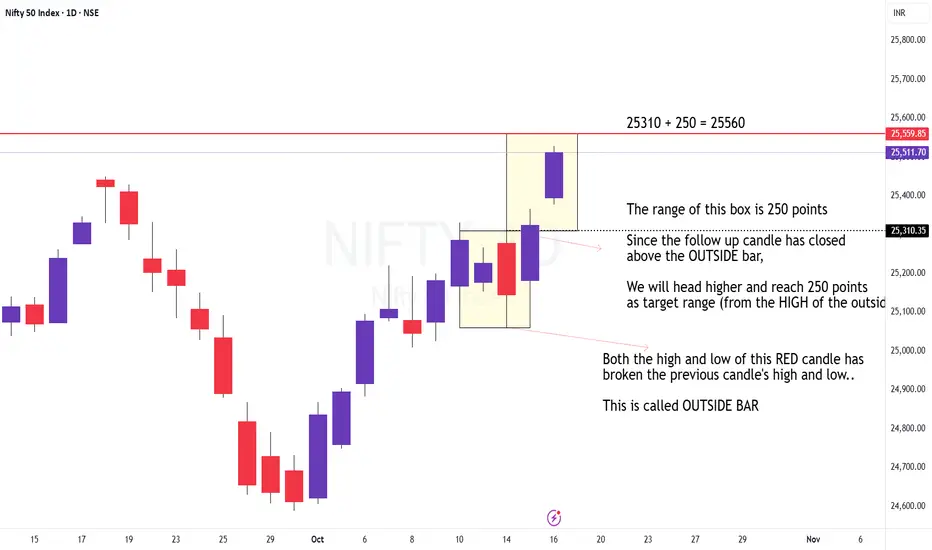
NIFTY PRZ at 25560? - OUTIDE BARThe Outside bar target on daily TF is placed at 25560..
Detailed explanation is marked in the chart..
It is prudent to book profit here or trail with tight SL.
Disclaimer: I am not a SEBI registered Analyst and this is not a trading advise. Views are personal and for educational purpose only. Please consult your Financial Advisor for any investment decisions. Please consider my views only to get a different perspective (FOR or AGAINST your views). Please don't trade FNO based on my views. If you like my analysis and learnt something from it, please give a BOOST. Feel free to express your thoughts and questions in the comments section.
NIFTY The Nifty has moved up nicely after opening strong above the trend line. The first resistance is at 25,650, and the second is near the all-time high. Let's see what happens tomorrow, as it's Friday. Hopefully, Donald Trump isn't upset or planning any actions that could turn the market bearish.

NIFTY 50 CLEAR BREAKOUTIn day chart there is a breakout in nifty 50.
here drawn a triangle pattern in which breakout is clearly visibe it is broken previous high as well.If nifty holds it's psycological level 25500,I think this will carry on it's trend.

The Power of Mindset in Trading Success1. Understanding Trading Mindset
The term "trading mindset" refers to the set of psychological attitudes, beliefs, and emotional controls that guide a trader's decision-making process. It encompasses a trader's ability to manage stress, stick to strategies, control impulses, learn from mistakes, and maintain a positive and disciplined approach. Unlike technical skills, which can be learned through study and practice, the trading mindset is a continual development process that evolves with experience.
A healthy trading mindset is not about eliminating emotions but rather mastering them. Traders who can observe their feelings without being controlled by them are better equipped to make rational, objective decisions even under pressure. Emotional self-awareness, resilience, patience, and confidence are key traits of a successful trading mindset.
2. Emotional Challenges in Trading
Financial markets are inherently uncertain and unpredictable. Traders face constant challenges such as price volatility, unexpected news events, and losses that can test emotional fortitude. Several emotional challenges can hinder trading performance:
Fear: Fear is a common emotion that can prevent traders from taking opportunities or cause premature exits from profitable trades. It can stem from fear of losing money, fear of missing out (FOMO), or fear of being wrong.
Greed: Greed can drive traders to overtrade, take excessive risks, or hold positions longer than prudent. The desire for higher profits can overshadow rational decision-making.
Regret: Traders may dwell on past mistakes or missed opportunities, which can affect confidence and lead to reactive trading decisions.
Overconfidence: Experiencing a winning streak can make traders overconfident, causing them to deviate from their strategy and risk larger losses.
Understanding and managing these emotional states is critical to sustaining long-term trading success. Emotional discipline ensures that decisions are guided by strategy rather than impulses.
3. The Role of Discipline
Discipline is the backbone of a successful trading mindset. Even the best strategies will fail if a trader cannot adhere to rules regarding entry, exit, and risk management. Discipline in trading manifests in several ways:
Following a Trading Plan: A trading plan outlines strategies, risk parameters, and trade management rules. Traders with strong discipline stick to this plan consistently, avoiding impulsive decisions.
Risk Management: Proper position sizing, stop-loss levels, and capital allocation are essential to protect against catastrophic losses. A disciplined trader respects risk parameters even in emotionally charged market conditions.
Consistency: Markets fluctuate, but disciplined traders maintain a consistent approach to analysis, execution, and evaluation. Consistency reduces the impact of random market movements on psychological stability.
Discipline is cultivated over time and is often tested in moments of stress. Successful traders develop habits and routines that reinforce disciplined behavior, such as journaling trades, reviewing performance, and maintaining clear decision-making processes.
4. Growth Mindset vs. Fixed Mindset
The concept of mindset, popularized by psychologist Carol Dweck, can be applied directly to trading. Traders with a growth mindset view challenges, losses, and mistakes as opportunities to learn and improve. They embrace feedback, adapt to changing market conditions, and see setbacks as temporary hurdles. Conversely, traders with a fixed mindset may view losses as personal failures, resist learning, and struggle to adapt.
A growth mindset in trading leads to several advantages:
Continuous Learning: Markets evolve, and successful traders continually educate themselves about new strategies, instruments, and market dynamics.
Adaptability: Traders with a growth mindset adjust their methods in response to market changes, avoiding rigid adherence to outdated strategies.
Resilience: Viewing losses as learning experiences reduces emotional stress and helps traders recover more quickly from setbacks.
5. Psychological Biases and Their Impact
Cognitive biases can subtly influence trading decisions, often without conscious awareness. Understanding these biases is essential for developing a strong trading mindset:
Confirmation Bias: Traders may seek information that supports their preconceptions and ignore contradictory data, leading to poor decision-making.
Loss Aversion: The tendency to fear losses more than valuing equivalent gains can result in holding losing positions too long or exiting winning trades prematurely.
Recency Bias: Recent events may disproportionately influence decisions, causing traders to overemphasize short-term trends rather than considering long-term patterns.
Herd Mentality: Following the crowd can lead to impulsive decisions and market bubbles. Independent thinking and critical analysis help counteract this bias.
By recognizing and mitigating these biases, traders can make more objective, rational, and profitable decisions.
6. Developing Mental Resilience
Resilience is the ability to recover from setbacks and remain focused on long-term goals. In trading, mental resilience allows individuals to:
Handle Losses: Losses are inevitable in trading. Resilient traders analyze mistakes without self-blame and use them as lessons for improvement.
Maintain Confidence: Confidence in one’s strategy and skills prevents panic-driven decisions and promotes patience during drawdowns.
Control Stress: High-pressure environments can trigger stress and anxiety. Resilient traders use techniques such as mindfulness, meditation, or deep breathing to maintain composure.
Resilience is not innate; it can be strengthened through deliberate practice, reflection, and psychological conditioning.
7. The Importance of Patience
Patience is a critical trait in trading. Successful traders wait for the right setups rather than chasing the market. Impatience can lead to overtrading, premature exits, or taking trades that do not fit the strategy. Cultivating patience involves:
Trusting the Process: Believing in your analysis and strategy allows you to wait for optimal trade opportunities.
Avoiding Impulsive Decisions: Emotional reactions often result in losses. Patience ensures that trades are executed based on logic and analysis rather than temporary market fluctuations.
Long-Term Perspective: Traders with a long-term mindset focus on cumulative performance rather than short-term outcomes, reducing stress and impulsive behavior.
8. Visualization and Mental Preparation
Many successful traders use visualization techniques to reinforce a positive trading mindset. Visualization involves mentally rehearsing trades, imagining successful execution, and preparing for potential challenges. Benefits include:
Reducing Anxiety: Anticipating potential scenarios reduces emotional reactions during actual trades.
Enhancing Focus: Visualization reinforces clarity of strategy and decision-making under pressure.
Building Confidence: Mentally experiencing success boosts confidence and reinforces disciplined behavior.
Mental preparation, combined with regular reflection and journaling, strengthens a trader’s ability to navigate markets effectively.
9. Balancing Emotion and Logic
While technical and fundamental analysis provides a logical framework, emotions are an inseparable part of trading. The key to success lies in balance:
Emotional Awareness: Recognizing feelings such as fear, greed, or frustration helps traders respond consciously rather than react impulsively.
Rational Decision-Making: Logic-based decisions ensure consistency and reduce the influence of temporary emotions.
Adaptation: Markets are dynamic, and emotions sometimes signal real opportunities or risks. Effective traders integrate emotional insights with rational strategies.
10. Continuous Self-Reflection and Improvement
Trading success is not static. Even experienced traders must continually evaluate performance, adapt strategies, and refine their mindset. Self-reflection helps in:
Identifying Weaknesses: Recognizing recurring emotional or behavioral patterns that affect trading.
Reinforcing Strengths: Building on habits and traits that contribute to consistent success.
Enhancing Decision-Making: Learning from past trades improves judgment and reduces mistakes over time.
Maintaining a trading journal, seeking mentorship, and engaging in peer discussions can accelerate the development of a robust trading mindset.
11. Mindset and Risk Management
A strong mindset directly influences risk management, which is crucial for survival in trading. Traders with a resilient and disciplined mindset:
Stick to predetermined risk levels even during volatile market conditions.
Avoid overleveraging or taking impulsive positions.
Accept small losses without emotional turmoil, understanding that preservation of capital is essential for long-term success.
Mindset shapes how a trader perceives risk, allowing for calculated decisions rather than emotional gambles.
12. Real-Life Examples of Mindset Impact
Countless traders have demonstrated that mindset often outweighs technical skill in determining success:
Warren Buffett emphasizes patience, emotional control, and long-term thinking rather than rapid, high-risk trades.
Professional day traders often stress the importance of discipline, emotional awareness, and learning from mistakes over short-term technical mastery.
Historical trading failures often result from psychological lapses, such as panic-selling during downturns or overconfidence during market euphoria.
These examples reinforce the principle that trading success is as much about psychological preparation as analytical ability.
13. Strategies to Strengthen Trading Mindset
Building a robust trading mindset is an ongoing process. Effective strategies include:
Develop a Trading Plan: Clear guidelines reduce emotional decision-making.
Practice Mindfulness: Meditation and breathing techniques enhance focus and reduce stress.
Set Realistic Goals: Achievable targets prevent disappointment and emotional swings.
Journal Your Trades: Reflecting on decisions and outcomes improves self-awareness.
Learn from Mistakes: Treat losses as feedback rather than personal failure.
Maintain Work-Life Balance: Physical and mental well-being support cognitive function and emotional stability.
14. Conclusion
The power of mindset in trading success cannot be overstated. While technical analysis, strategies, and market knowledge provide the tools for trading, the psychological aspect determines how effectively those tools are applied. A strong trading mindset combines discipline, emotional control, patience, resilience, and continuous learning. Traders who cultivate these traits are better equipped to navigate market volatility, manage risk, and achieve consistent profitability.
Ultimately, trading is a test of character as much as skill. Success is rarely about luck; it is the result of mental fortitude, self-awareness, and the ability to make rational decisions under pressure. By prioritizing mindset development, traders can unlock their true potential, turning challenges into opportunities and navigating the financial markets with confidence, discipline, and long-term success.
Nifty buy recommended near 25060 , now 25750-25800 next target How My Harmonic pattern projection Indicator work is explained below :
Recent High or Low :
D-0% is our recent low or high
Profit booking zone ( Early / Risky entry) : D 13.2% -D 16.1 % is
range if break them profit booking start on uptrend or downtrend but only profit booking, trend not changed
SL reversal zone (Safe entry ) : SL 23.1% and SL 25.5% is reversal zone if break then trend reverse and we can take reverse trade
Target : T1, T2, T3, T4 and .
Are our Target zone
Any Upside or downside level will activate only if break 1st level then 2nd will be active if break 2nd then 3rd will be active.
Total we have 7 important level which are support and resistance area
Until , 16% not break uptrend will continue if break then profit booking will start.
If break 25% then fresh downtrend will start then T1, T2,T3 will activate
1,3,5,10,15,20 minutes are short term levels.
30 minutes 60 minutes , 2 hours,3 hours, ... 1 day and 1 week chart positional and long term levels

Nifty There is cup and holder formation in NIFTY weekly chart. It seems there will be upside breakout and it will create new high. Closing below 24400 will negate this pattern. Trigger point will be relief in tarrif from US government and positive commentary from Indian companies after Q2 numbers

Allow Nifty to close Bullish today on D chartIf Nifty closes Bullish today with an O=L candle, it would signal that buying is back.
Nifty has been consolidating in this range since it formed a last high in Jul-25.
Today if we have a Bullish close, look for a W type pattern on the 1H chart which if broken will give a confirmation of resumption of Bullish trend.
Those looking for swing entries can then build long position for Target of 25,800 as a first target.
Nifty is poised to hit 26,300 level in the near term.
NIFTY KEY LEVELS FOR 16.10.2025NIFTY KEY LEVELS FOR 16.10.2025
Timeframe: 3 Minutes
If the candle stays above the pivot point, it is considered a bullish bias; if it remains below, it indicates a bearish bias. Price may reverse near Resistance 1 or Support 1. If it moves further, the next potential reversal zone is near Resistance 2 or Support 2. If these levels are also broken, we can expect the trend.
When a support or resistance level is broken, it often reverses its role; a broken resistance becomes the new support, and a broken support becomes the new resistance.
If the range(R2-S2) is narrow, the market may become volatile or trend strongly. If the range is wide, the market is more likely to remain sideways
please like and share my idea if you find it helpful
📢 Disclaimer
I am not a SEBI-registered financial adviser.
The information, views, and ideas shared here are purely for educational and informational purposes only. They are not intended as investment advice or a recommendation to buy, sell, or hold any financial instruments.
Please consult with your SEBI-registered financial advisor before making any trading or investment decisions.
Trading and investing in the stock market involves risk, and you should do your own research and analysis. You are solely responsible for any decisions made based on this research.

#NIFTY Intraday Support and Resistance Levels - 16/10/2025Nifty is expected to open with a gap up near the 25,320–25,350 zone, reflecting bullish sentiment and continuation of positive momentum. The index is currently trading within a consolidation zone between 25,200 and 25,550, indicating accumulation before a possible breakout.
If Nifty sustains above 25,350 and crosses 25,550 decisively, a breakout move could trigger a rally toward 25,650, 25,700, and 25,750+.
On the downside, immediate support lies near 25,250–25,200. A breakdown below 25,200 may bring weakness toward 25,100, 25,050, and 25,000-.
Overall, the sentiment is mildly bullish with a gap up opening, but traders should be cautious near 25,550 — the upper band of the consolidation. Breakout confirmation above this zone will likely lead to fresh long opportunities, while failure could result in a range-bound session.

“Nifty 50 Intraday Key Levels | Buy & Sell Zones 16th Oct 2025”“Want to learn more? Like this post and follow me!”
25580 🔴 Above 10m closing Shot Cover Level
Strong resistance — short covering likely above this.
25433 🟠 Below 10m hold PE By level /
Above 10m hold CE by level
25370 🟣 Above 10M hold positive trade view
Below 10M hold negative trade view
Sentiment deciding level — crucial for trend direction.
25280 ⚫ Above Opening S1 10m Hold CE By level
Bullish entry level — CE hold area.
25170 🟠 Below Opening R1 10m Hold PE By level
Below 10m hold PE By Risky Zone Weak zone — PE may strengthen below this.
24990🟢 Above 10M hold CE By Safe Zone level
Safe bullish zone — CE can be held confidently above.
24980🔵 BELOW 10M hold UNWINDING level
Breakdown zone — unwinding or heavy selling possible below.
