“Nifty 50 Intraday Key Levels | Buy & Sell Zones 16th Oct 2025”“Want to learn more? Like this post and follow me!”
25580 🔴 Above 10m closing Shot Cover Level
Strong resistance — short covering likely above this.
25433 🟠 Below 10m hold PE By level /
Above 10m hold CE by level
25370 🟣 Above 10M hold positive trade view
Below 10M hold negative trade view
Sentiment deciding level — crucial for trend direction.
25280 ⚫ Above Opening S1 10m Hold CE By level
Bullish entry level — CE hold area.
25170 🟠 Below Opening R1 10m Hold PE By level
Below 10m hold PE By Risky Zone Weak zone — PE may strengthen below this.
24990🟢 Above 10M hold CE By Safe Zone level
Safe bullish zone — CE can be held confidently above.
24980🔵 BELOW 10M hold UNWINDING level
Breakdown zone — unwinding or heavy selling possible below.
Trade ideas

NIFTY Levels for TodayHere are the NIFTY's Levels for intraday (in the image below) today. Based on market movement, these levels can act as support, resistance or both.
Please consider these levels only if there is movement in index and 15m candle sustains at the given levels. The SL (Stop loss) for each BUY trade should be the previous RED candle below the given level. Similarly, the SL (Stop loss) for each SELL trade should be the previous GREEN candle above the given level.
Note: This idea and these levels are only for learning and educational purpose.
Your likes and boosts gives us motivation for continued learning and support.
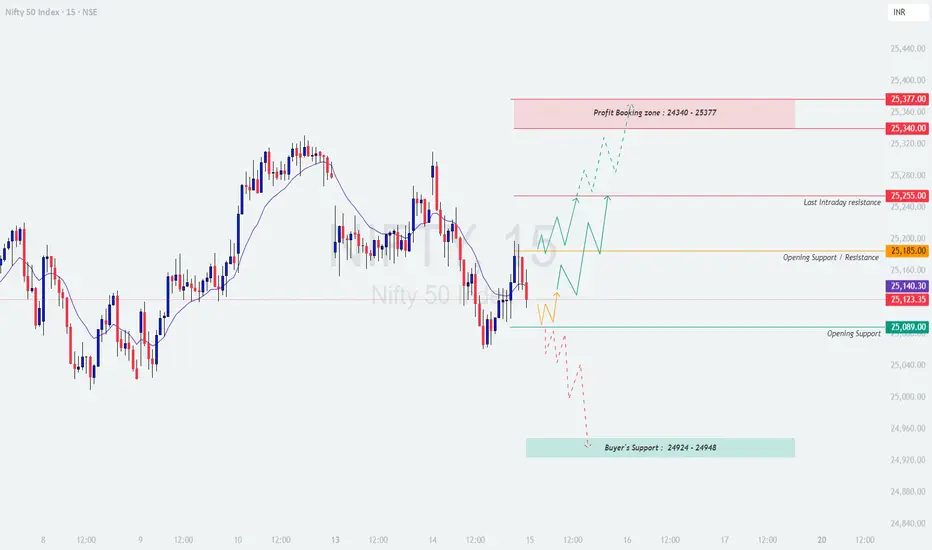
We are getting closer to our TARGET!As we can see despite closing extremly weak previous day NIFTY managed to reverse sharply exactly as analysed. Hence we always say that we should always stick with our analysis and should not get distracted or lose hope with minor corrections or retracements until it is our structure. So, following our structure, we can still expect NIFTY to remain strong and head towards 25500 in near future so plan your trades accordingly and keep wathcing everyome.

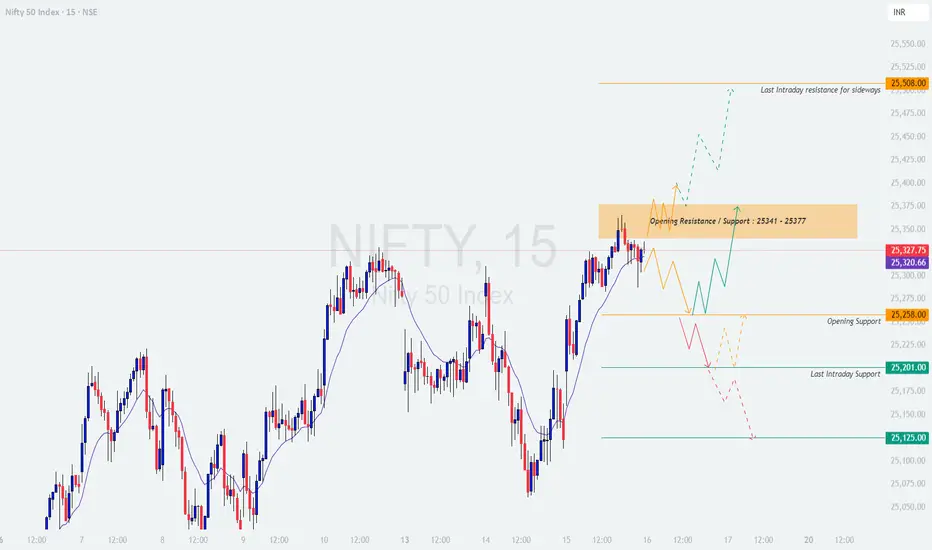
NIFTY – Professional Trading Plan for 16-Oct-2025NIFTY 50 – Professional Trading Plan for 16-Oct-2025 (educational)
Market context and key levels
Reference map from 15‑Oct close: price is hovering around 25,320 with an opening resistance/support band at 25,341–25,377; immediate supports at 25,258 (opening support) and 25,201 (last intraday support), with a deeper line in the sand near 25,125. Trend bias is constructive above 25,258 and momentum unlocks only on acceptance above 25,377; sustained loss of 25,201–25,125 flips control to bears. 🚦
GAP UP OPEN (≥ +100 pts)
Educational logic: A strong positive gap often traps shorts from the prior day. The edge is to wait for “acceptance” (time + volume) above resistance rather than chasing a spike.
If open is inside or just above 25,341–25,377 and the first 5–15 minutes hold above VWAP, consider a momentum long toward 25,420–25,450; partial profit inside the band, then trail for 25,508 (prior sideways resistance marker). Stop below the retest low of the zone.
If open is directly near 25,480–25,520, avoid chasing into resistance. Prefer a pullback to 25,377/25,360. Go long only on a higher low plus reclaim of 25,400 with a tight stop under the pullback low; targets 25,480 → 25,508.
Failure short: Rejection wicks from 25,400–25,480 followed by a 15‑min close back below 25,360. Take a tactical short to 25,341 → 25,300–25,258. Exit if price reclaims 25,377 with strength.
FLAT OPEN (±0–50 pts)
Educational logic: Neutral open favors range trading between nearby pivots until the market shows acceptance beyond the range. ⚖️
Range buy: Look for reversal candles near 25,280–25,258 with risk below the session swing; targets 25,341–25,360, then 25,377 if acceptance builds.
Breakout buy: A 15‑min close and retest hold above 25,377 opens 25,400–25,450; scale out on the way to 25,508 if momentum broadens.
Breakdown short: Acceptance below 25,258 on retest aims 25,220–25,201; if sellers keep control, extend to 25,150–25,125. Manage risk by moving stops above the last lower high.
GAP DOWN OPEN (≤ −100 pts)
Educational logic: Negative gaps near support can lead to “gap‑and‑go” trend days or sharp reversals if responsive buyers defend key zones. 📉
Gap‑and‑go short: Open near 25,210–25,201 and failure to reclaim 25,201 on retest → short to 25,150, then 25,125. Take partials at each target; trail using 5–15 min lower highs.
Reversal long: Strong rejection from 25,125 (long lower wicks/engulfing) → long back to 25,201 then 25,258; shift stop to breakeven once 25,201 is accepted.
Bias flip: If price re-enters above 25,258 and sustains, abandon shorts and prepare for rotation to 25,341–25,377. Avoid fighting a reclaim day—trade with the acceptance, not the open.
Execution checklist
Predefine scenario, entry trigger (acceptance/retest), invalidation (where the idea is wrong), and first target.
Treat 25,258, 25,341–25,377, and 25,508 as decision areas. Trade the reaction to these levels rather than the level itself.
Use structure-based stops: beyond the last swing or the far side of the zone. Scale out at the next pivot and trail to protect gains.
Options risk management tips
Define risk : Prefer debit spreads over naked options at key zones (bull call above 25,377; bear put below 25,258) to cap tail risk on volatile opens.
Size by volatility: Wider expected ranges require smaller position size; don’t oversize because premiums look “cheap.”
Liquidity first: Stick to near‑ATM, current‑week options with tight spreads; avoid far OTM contracts that decay rapidly if the market ranges.
Enter on confirmation: Use a 15‑min acceptance or a clean retest hold to avoid false breakouts; avoid entries during the first 1–3 minutes unless trading a planned opening drive.
Manage winners: Take partials at the first pivot; if IV expands in your favor, consider converting naked calls/puts into verticals to lock risk while keeping upside.
Event awareness: Watch for midday global cues; if structure flips (e.g., reclaim of 25,258 after a breakdown), exit losers decisively instead of hedging passively.
Summary
Primary range: 25,258 support to 25,377 resistance. Upside continuation requires acceptance above 25,377 to target 25,400–25,450 and potentially 25,508. Downside momentum strengthens on acceptance below 25,258 toward 25,201 and 25,125. Trade level‑to‑level, let acceptance guide direction, and prioritize defined risk. 😊
Conclusion
Prepare three plays: continuation long above 25,377, responsive range trades around 25,258/25,341, and momentum shorts below 25,258 with extensions to 25,201–25,125. Execute with clear invalidations, scale responsibly, and adapt quickly if key pivots are reclaimed. 📊
Disclaimer: This is an educational plan, not investment advice or a trade recommendation; I am not a SEBI registered analyst .
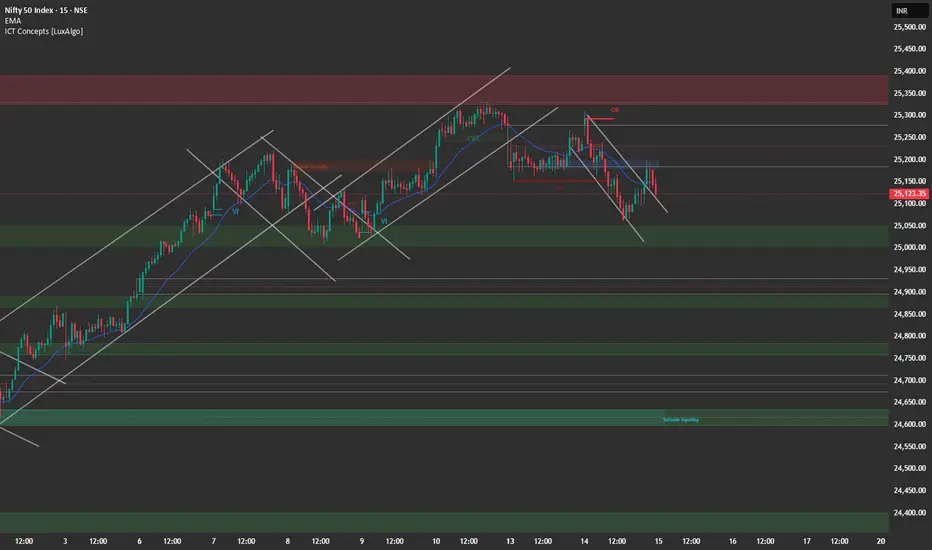
NIFTY_50Hello friends, welcome to all of you. We have discussed many things about WD Gyan's theory square,and Gann Fan before. Today also we will reveal a little about Gann Fan. This is 3rd time Market respect Gann Fan.
Hope tomorrow we will aspect one reversal from here.

Nifty 50 (2-hour timeframe) chart... Nifty 50 (2-hour timeframe) chart
from TradingView — here’s what can be inferred visually:
Current Nifty price: ≈ 25,323
You’ve drawn:
A horizontal resistance zone around 25,450–25,500 (highlighted in green)
A rising trendline from lower lows (support line)
A projected “target point” arrow pointing toward that rising support line, intersecting around the 24,700–24,750 zone
📊 Interpretation
My chart setup suggests a potential short-term pullback from the resistance zone (25,450–25,500) toward the support region.
🎯 Likely Target Zone
Target: Around 24,700 ±50 points
Stop Loss (if short): Above 25,500
Support levels:
24,900 (minor Ichimoku support)
24,700 (trendline + target point)
⚠ Note
The Ichimoku cloud is providing near-term support around 24,950–25,000, so expect consolidation before any deeper correction.
If Nifty breaks above 25,500 with volume, this bearish setup invalidates and could open upside toward 25,800–26,000.

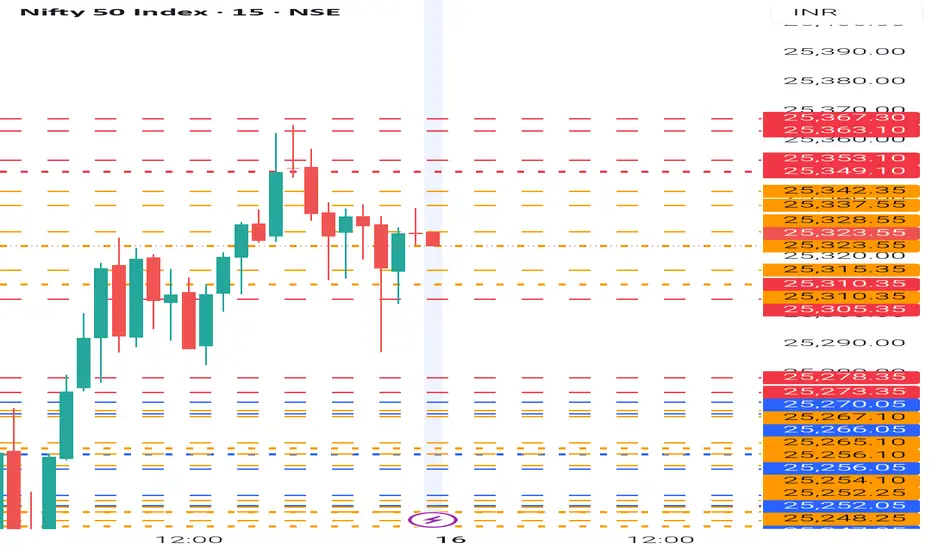
NIFTY- Intraday Levels - 16th October 2025If NIFTY sustain above 25328 above this bullish then around 25337/42 then 25349/53/63/67 strong level above this more bullish
If NIFTY sustain below 25323 below this bearish around 25315/10/05 strong level if sustain below this more bearish 25278/73 again strong level below this more bearish then 25270/65 then2525/25252 then last hope 25248 or 25238/24 below this wait more downside
Consider some buffer points in above levels.
Please do your due diligence before trading or investment.
**Disclaimer -
I am not a SEBI registered analyst or advisor. I does not represent or endorse the accuracy or reliability of any information, conversation, or content. Stock trading is inherently risky and the users agree to assume complete and full responsibility for the outcomes of all trading decisions that they make, including but not limited to loss of capital. None of these communications should be construed as an offer to buy or sell securities, nor advice to do so. The users understands and acknowledges that there is a very high risk involved in trading securities. By using this information, the user agrees that use of this information is entirely at their own risk.
Thank you.
Gold or Equities? A Crucial Turning Point Ahead#NIFTY/GOLD Ratio (Monthly Timeframe)
📊 What Is the NIFTY/GOLD Ratio?
NIFTY/GOLD ratio measures how the Indian equity market (#NIFTY) performs relative to #Gold over time.
Ratio ↑ = NIFTY outperforming Gold
Ratio ↓ = Gold outperforming NIFTY
📍 Current Market Structure
The ratio is now:
Approaching the long-term rising yellow trendline (dynamic support)
Converging with horizontal price structure zones (white dotted lines)
This confluence forms a major support zone — a potential bounce region .
📈 Trend Insight:
✅ Primary Trend: Long-term uptrend (favoring NIFTY)
⚠️ Short-Term: At a critical decision point
🧭 Scenarios:
✅ Bounce from support → NIFTY may begin outperforming Gold again
❌ Breakdown below support → Gold likely continues its outperformance
⏳ Neutral for now → Wait for confirmation (bullish reversal candle or momentum shift)
🏁 Conclusion:
This is a key macro-info tip for asset allocation and long-term investing.
Use this ratio to guide shifts between equity and gold exposure.
#NiftyVsGold | #GoldVsEquity | #AssetAllocation | #InvestSmart | #Nifty50 | #GoldInvestment | #TechnicalAnalysis | #MarketTrends | #WealthBuilding | #LongTermInvesting

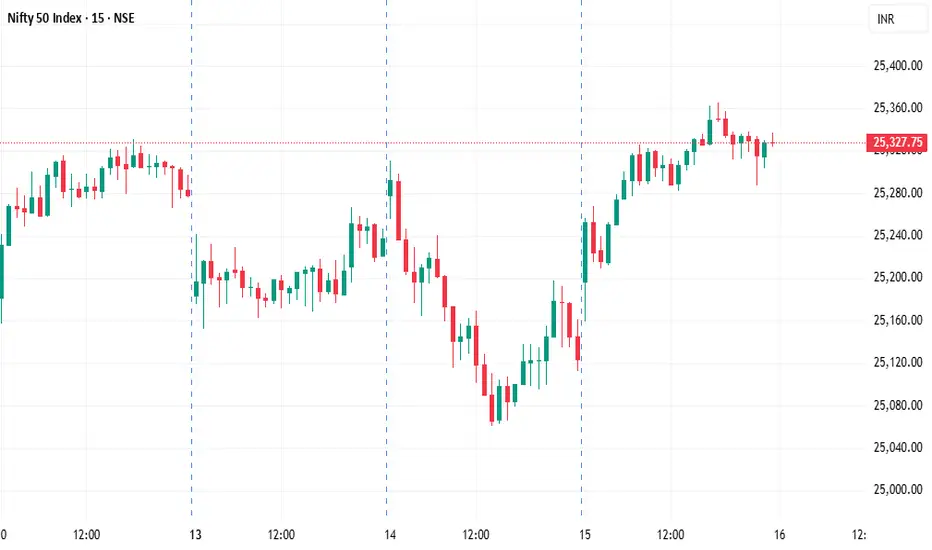
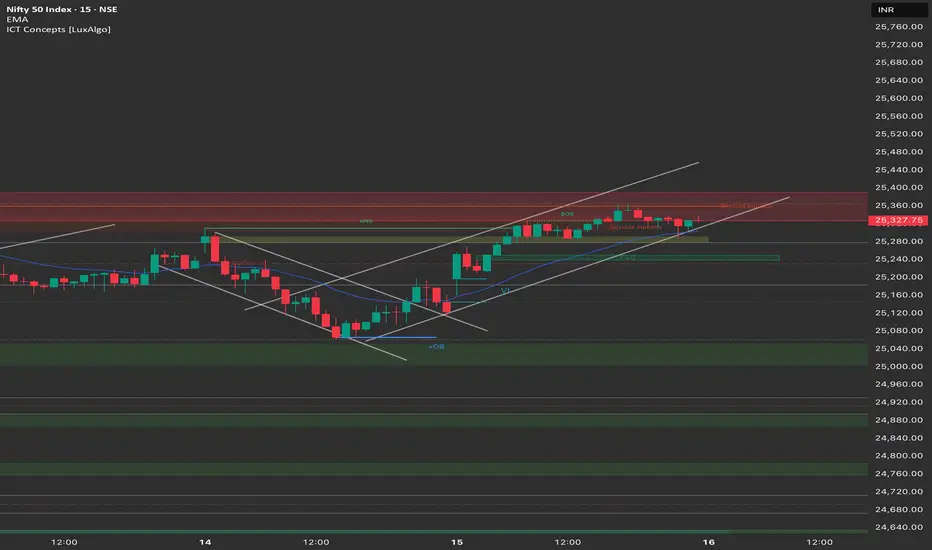
Nifty Structure Analysis & Trade Plan: 16th OctoberBased on the charts and the market's performance on Wednesday, October 15, the Nifty experienced a strong rebound, successfully defending a crucial support level and confirming a resumption of the short-term bullish trend.
Detailed Market Structure Breakdown
4-Hour Chart (Macro Trend)
Structure: The Nifty is firmly back in a bullish recovery phase. The price successfully defended the lower boundary of the steep ascending channel and the 25,050 support zone. The strong bullish candle on the 4H chart confirms that the correction seen on Monday/Tuesday was shallow and quickly bought up, reinforcing the overall uptrend.
Key Levels:
Major Supply (Resistance): 25,350 - 25,400. This area is the immediate overhead hurdle, aligning with the recent swing high. A decisive breakout here is needed to challenge the September high of 25,450.
Major Demand (Support): 25,050 - 25,150. This area, which includes the lower boundary of the ascending channel and the 9-period EMA, is the must-hold zone for the continuation of the rally.
Outlook: The short-term bias is strongly bullish. The market is poised to challenge the 25,400 resistance and attempt to test higher levels.
1-Hour Chart (Intermediate View)
Structure: The 1H chart shows a clear Market Structure Shift (MSS) back to the upside. The price broke the immediate swing high after defending the 25,050 level. The index closed strongly within its ascending channel.
Key Levels:
Immediate Resistance: 25,400.
Immediate Support: 25,250 (Recent consolidation zone and Order Block).
15-Minute Chart (Intraday View)
Structure: The 15M chart confirms the strong bullish momentum. The market closed with a small BOS on the upside, setting up for a bullish opening. The strong close suggests momentum is favorable for continuation. The price is trading within a bullish flag pattern.
Key Levels:
Intraday Supply: 25,400.
Intraday Demand: 25,250.
Outlook: Strongly Bullish.
📈 Trade Plan (Thursday, 16th October)
Market Outlook: The Nifty has shown strong resilience and has resumed its short-term rally. The focus is on a move toward the 25,400 resistance. Infosys, LTIMindtree, and Wipro Q2 results are due today, which will heavily influence the market.
Bullish Scenario (Primary Plan)
Justification: The confirmed bullish reversal, the recapture of key moving averages, and the sustained ascent in the ascending channel favor continuation.
Entry: Long entry on a decisive break and 15-minute candle close above 25,400. Alternatively, look for a dip entry near 25,250 (the immediate consolidation support).
Stop Loss (SL): Place a stop loss below 25,180 (below the recent swing low/FVG).
Targets:
T1: 25,450 (Previous swing high/upper channel).
T2: 25,550 - 25,600 (Next major target zone).
Bearish Scenario (Counter-Trend Plan)
Justification: Only valid if IT earnings disappoint heavily, leading to a breakdown of the short-term bullish structure.
Trigger: A decisive break and 1-hour candle close below 25,000.
Entry: Short entry below 25,000.
Stop Loss (SL): Above 25,150.
Targets:
T1: 24,900 (Major FVG support).
T2: 24,800 (Next support base).
Key Levels for Observation:
Immediate Decision Point: 25,250 - 25,400 zone.
Bullish Confirmation: A break and sustained move above 25,400.
Bearish Warning: A move below 25,180 suggests the bounce is failing.
Major Event: Infosys, LTIMindtree, Wipro Q2 Results. Volatility in IT stocks will be key.
Line in the Sand: 25,000. Below this level, the short-term bullish bias is nullified.
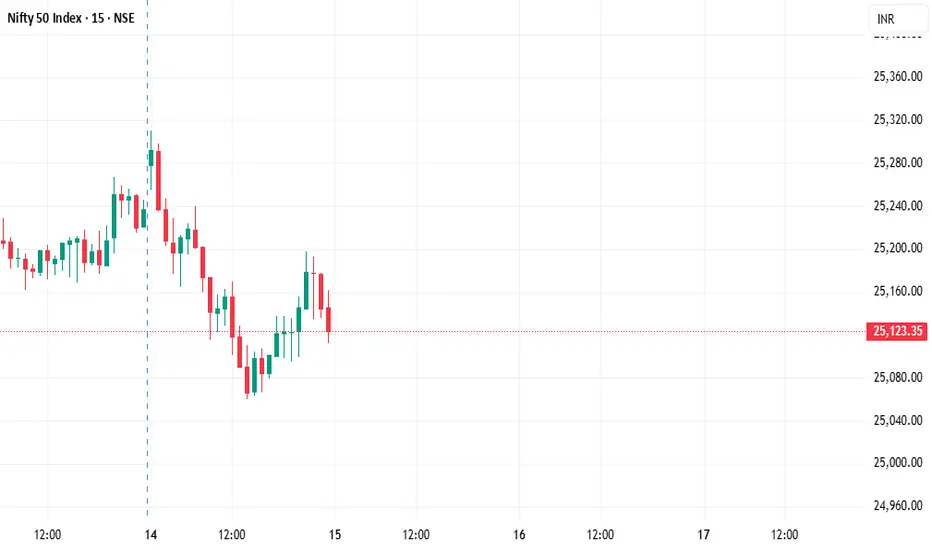
Nifty Intraday Analysis for 15th October 2025NSE:NIFTY
Index has resistance near 25300 – 25350 range and if index crosses and sustains above this level then may reach near 25500 – 25550 range.
Nifty has immediate support near 25000 – 24950 range and if this support is broken then index may tank near 24800 – 24750 range.
Nifty @ 25,323 What Next ? Daily Levels & Views --> CE or PE Continuation from
Recap:
💡 View shared on 14th Oct 2025:
📌 LTP: 25,145
🔻 R: 25,255 - 25,338
🔺 S: 25,052 - 24980/30
💡 View:
Expecting a positive move.
Nifty breaking out above 25,256 and closing higher will be a clear sign of strength.
At present, 25,000 remains a strong and crucial level to watch.
If it gets decisively broken, bears may take control — otherwise, everything continues to favour the bulls.
Key Levels to Watch:
Bulls > 25,255 - 25,338
Bears > 25,055 - 25K - 25,980
✅ Strength above 25521
❌ Weakness below 24,930
⚠️ Keep Churning as per Trend
Actual on 15th Oct 2025
OHLC
25,182 🎯 Gap up as mentioned
25,365 🎯 Match with 25,338
25,159 🎯 Bang On Match with 25,155
25,223 🎯 Below Key S level of 25,338
As expected & shared yesterday, Nifty opened Gap Up & maintained a +ve trend Matching our Given levels.
16/10/2025 Nifty View
📌 LTP: 25,323
🔻 R: 25,426 - 25,514
🔺 S: 25,255 - 25,155
💡 View:
Today's trend & closing is +ve & Nifty is expected to continue its Upward momentum, provided there is NO STUPID STATEMENTS from 🫥
At present, 25,000 remains a strong and crucial level to watch.
If it gets decisively broken, bears may take control — otherwise, everything continues to favor the bulls.
Key Levels to Watch:
Bulls > 25,415 - 25,520
Bears > 25,055 - 25K - 25,980
✅ Strength above 25521
❌ Weakness below 24,930
⚠️ Keep Churning as per Trend
👉 Do you find these daily views useful and want to receive them regularly?
If yes, show 👍
Your support motivates us to share more
For more insights & trade ideas,
📲 Visit my profile and hit Follow
Warm regards,
Naresh G
SEBI Registered Research Analyst
💬 Comment below if you want me to analyse any stock for you 🔍

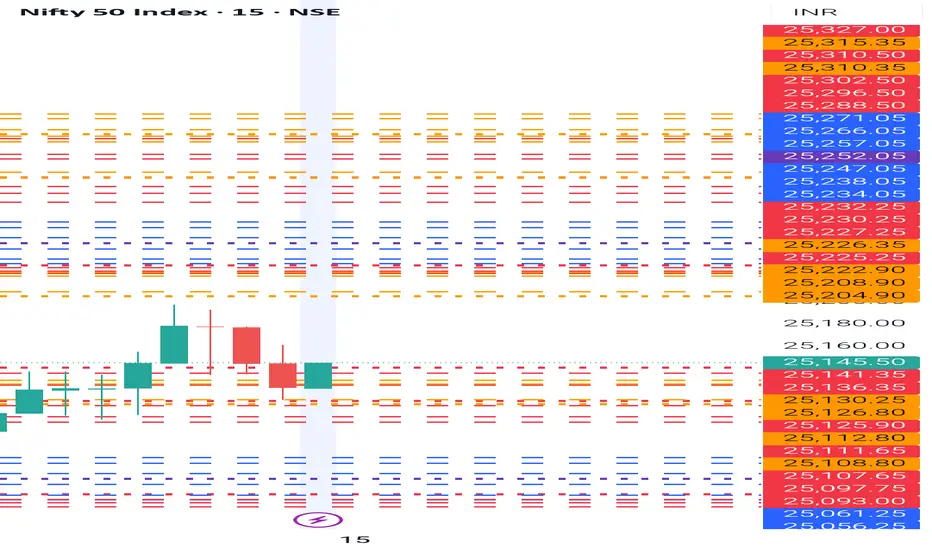
NIFTY KEY LEVELS FOR 15.10.2025NIFTY KEY LEVELS FOR 15.10.2025
Timeframe: 3 Minutes
If the candle stays above the pivot point, it is considered a bullish bias; if it remains below, it indicates a bearish bias. Price may reverse near Resistance 1 or Support 1. If it moves further, the next potential reversal zone is near Resistance 2 or Support 2. If these levels are also broken, we can expect the trend.
When a support or resistance level is broken, it often reverses its role; a broken resistance becomes the new support, and a broken support becomes the new resistance.
If the range(R2-S2) is narrow, the market may become volatile or trend strongly. If the range is wide, the market is more likely to remain sideways
please like and share my idea if you find it helpful
📢 Disclaimer
I am not a SEBI-registered financial adviser.
The information, views, and ideas shared here are purely for educational and informational purposes only. They are not intended as investment advice or a recommendation to buy, sell, or hold any financial instruments.
Please consult with your SEBI-registered financial advisor before making any trading or investment decisions.
Trading and investing in the stock market involves risk, and you should do your own research and analysis. You are solely responsible for any decisions made based on this research.

Daily Update 15/10/25 NIFTY50Clear rule-based entry/exit levels for Nifty are shared.
All details are in the video itself.

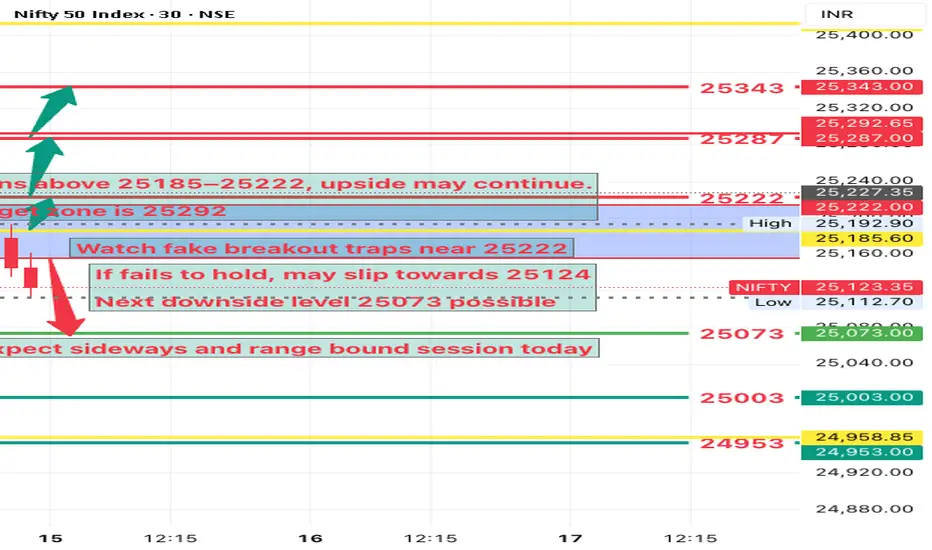
NIFTY Analysis 15 october 2025 ,Daily Morning update at 9 amNifty spot is in overbought zone in chart
Market is consolidating to create space for next move
For last 3 sessions, Nifty is moving sideways
Indicates accumulation and range formation
Expected open around 25185
If sustains above 25185–25222, upside may continue
Next target zone is 25292
Watch for sustainability above 25182 level.
If fails to hold, may slip towards 25125
Next downside level 25073 possible
Expect sideways and range bound session today
Support levels 25073, 25003, 24953.
Resistance levels 25222, 25287, 25343
Watch false breakout traps near 25222
Confirm direction using 1H candle close. and use your mind
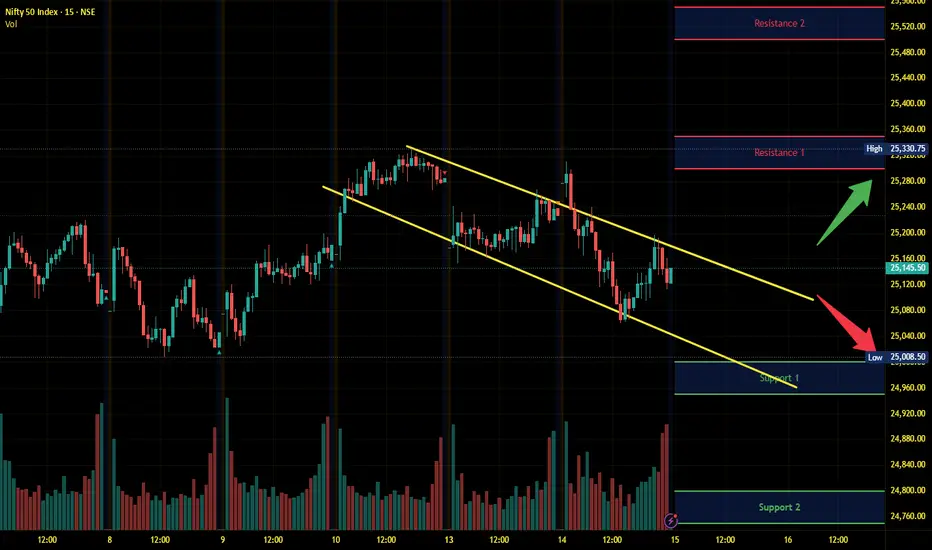
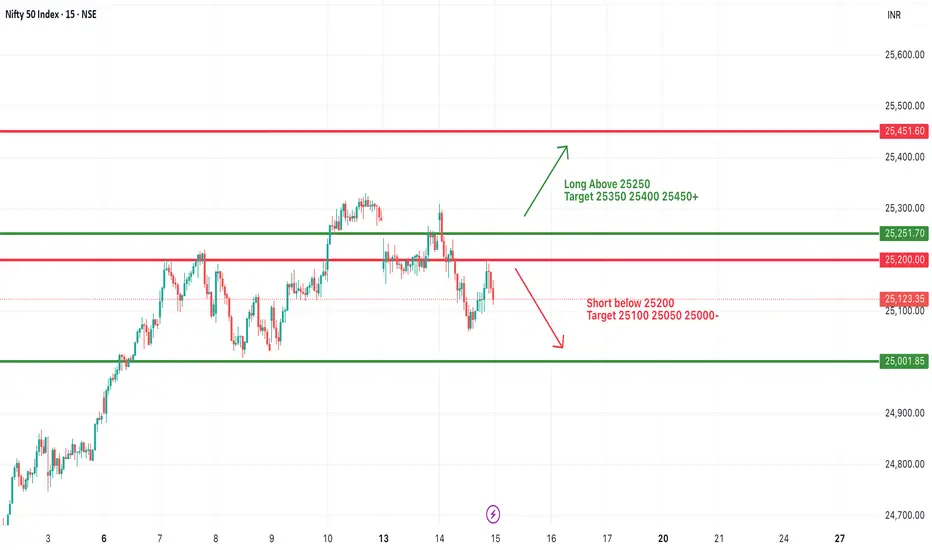
#NIFTY Intraday Support and Resistance Levels - 15/10/2025Nifty is likely to open slightly gap up near the 25,150–25,200 zone, indicating a cautious positive sentiment in the market. After recent consolidation, the index continues to trade between well-defined support and resistance levels, suggesting indecision among traders.
If Nifty sustains above 25,250, it may trigger a bullish momentum toward 25,350, 25,400, and 25,450+. A breakout above 25,450 could further strengthen the uptrend.
On the downside, a fall below 25,200 may invite selling pressure, leading the index toward 25,100, 25,050, and 25,000-.
Overall, the trend remains range-bound with a slight bullish bias. Traders should focus on breakout or breakdown confirmation before taking positions, keeping a strict stop loss and booking partial profits at each target level.
NIFTY Levels for Today
Here are the NIFTY's Levels for intraday (in the image below) today. Based on market movement, these levels can act as support, resistance or both.
Please consider these levels only if there is movement in index and 15m candle sustains at the given levels. The SL (Stop loss) for each BUY trade should be the previous RED candle below the given level. Similarly, the SL (Stop loss) for each SELL trade should be the previous GREEN candle above the given level.
Note: This idea and these levels are only for learning and educational purpose.
Your likes and boosts gives us motivation for continued learning and support.
NIFTY still above 25000!As we can see despite the weak closing, it still maintained itself above 25000 level which meets our bullishness criteria hence as long as we are above 25000 level, every dip can be bought for 25500 and new ATH so plan your trades accordingly and keep watching everyone.

Nifty Head & Shoulder 1 Hrs Chart Nifty Taken Good move from Bottom. Now Yesterday Nifty taken Resistance near 25300. It's Clearly Visible Head & Shoulder Pattern .
We may see Down side till 25000 level. 25000 is a Round level & Psychology level also so may take a pause . Or if it Breaks then may Fall more . So be careful.
Make Position accordingly to ur financial advisor. My views for for educational purposes only.
For more information Visit my Tradingview Profile.

Nifty Analysis - 15/10/25 Nifty Analysis - Start of new week expiry so expect 2 sides movement. If we close above 25210 then look for CE and if we close below 25060 look for PE trades. Do keep one thing in mind, first break out candle is always a fake breakout candle do not jump to take trades in it. Wait for retest and then look for trades. For the last 6 days we are in same zone of 25000 and 25300 so if we get breakout on either side we can see good movements, have patience.

“Nifty 50 Intraday Key Levels | Buy & Sell Zones 15th Oct 2025”“Want to learn more? Like this post and follow me!”
25433 🔴 Above 10m closing Shot Cover Level
Strong resistance — short covering likely above this.
25280 🟠 Below 10m hold PE By level /
Above 10m hold CE by level
25170 🟣 Above 10M hold positive trade view
Below 10M hold negative trade view
Sentiment deciding level — crucial for trend direction.
25080 ⚫ Above Opening S1 10m Hold CE By level
Bullish entry level — CE hold area.
24980 🟠 Below Opening R1 10m Hold PE By level
Below 10m hold PE By Risky Zone Weak zone — PE may strengthen below this.
24790 🟢 Above 10M hold CE By Safe Zone level
Safe bullish zone — CE can be held confidently above.
24970 🔵 BELOW 10M hold UNWINDING level
Breakdown zone — unwinding or heavy selling possible below.

NIFTY : Trading levels and Plan for 15-Oct-2025NIFTY 50 – Professional Trading Plan for 15-Oct-2025 (educational)
Market context and key levels
Nifty closed near 25,145 on 14-Oct after a mild decline, with immediate supports at 25,089/25,060 and deeper demand around 24,950–24,924. Sentiment is balanced; expect two-way moves early. 🙂
Overhead resistances are 25,185 (opening pivot), 25,255–25,268 (last intraday barrier), 25,326, and the supply/profit zone at 25,340–25,450.
Bias roadmap: Momentum unlocks only on acceptance beyond 25,326; bearish momentum strengthens below 25,060 toward 24,950 and 24,924–24,948.
GAP UP OPEN (≥ +100 pts)
Educational logic: Gaps higher can trap shorts; wait for acceptance above resistance rather than chasing the first spike.
If open ≥ 25,245–25,260 and first 5–15 min high holds above VWAP, plan a momentum buy toward 25,300 → 25,326, scale partials into 25,340–25,360; trail for 25,422 if strength persists.
If open directly inside 25,340–25,450 supply, avoid chasing; wait for a pullback to 25,300–25,326. Go long only on a higher low plus reclaim of 25,340 with stop below the retest low.
Failure short: Bearish rejection wicks in 25,340–25,450 followed by a 15‑min close back below 25,300. Short to 25,255/25,268 and 25,200–25,185; exit if 25,326 is reclaimed with strength.
FLAT OPEN (±0–50 pts)
Educational logic: Neutral opens favor range trading around nearby pivots until a confirmed breakout with volume. ⚖️
Range buy: Look for reversal signals near 25,100–25,150 aiming for 25,255 then 25,268/25,326; keep stops tight under the reversal low.
Breakout buy: Sustained 15‑min close above 25,326 with rising volume/market breadth opens 25,340–25,450; scale out inside that zone, trail below last swing low.
Breakdown short: Loss of 25,060 with acceptance below on retest targets 24,950; extension possible to 24,924–24,948 buyer zone. Cover partials into these supports and trail.
GAP DOWN OPEN (≤ −100 pts)
Educational logic: Negative gaps near support can either trend down (“gap-and-go”) or reverse sharply if buyers defend key zones. 📉
Gap-and-go short: Open around 25,030–25,060 and failure to reclaim 25,060 on retest → short toward 24,950; manage risk by trailing as price approaches 24,924–24,948.
Reversal long: Strong rejection from 24,924–24,948 (bullish engulfing/inside-bar break) → long back to 25,060 then 25,185; move stop to breakeven once 25,060 is accepted.
Bias flip: If price re-enters and sustains above 25,185 intraday, switch to long bias for 25,255/25,268 → 25,326; avoid fighting a reclaim day.
Execution checklist
Plan the open : Define your initial scenario, invalidation level, and first target before the bell.
Map accept/reject: Treat 25,060, 25,185, 25,255–25,268, 25,326, and 25,340–25,450 as decision points; act only on acceptance or rejection, not touches.
Use structure: Place stops beyond the structure that invalidates your idea (last swing or the other side of the zone).
Scale management: Take partials at the next pivot; trail stops bar-by-bar or below/above last swing to lock gains.
Options risk management tips
Define risk upfront : Prefer debit spreads (bull call above 25,326, bear put below 25,060) to cap tail risk on volatile opens.
Size by volatility: Wider stops need smaller size; don’t oversize just because options look “cheap.”
Choose liquidity: Trade near-ATM, same-week options for intraday; avoid illiquid deep OTMs that decay fast in ranges.
Time entries: Enter after acceptance (15‑min close or retest hold) to reduce false breaks.
Manage winners: Scale at first target; convert naked options into spreads if IV expands in your favor.
Event watch: Stay alert to midday global cues; if structure flips (e.g., reclaim of 25,185), exit losers decisively instead of hedging passively.
Summary
Inside day plan favors responsive trades between 25,060–25,326. Upside expansion requires acceptance above 25,326 toward 25,340–25,450; downside momentum strengthens below 25,060 toward 24,950 and 24,924–24,948.
Trade level-to-level, let acceptance guide direction, and prioritize defined-risk option structures with disciplined scaling. 🚦
Conclusion
Prepare three plays: momentum continuation above 25,326, range trades around 25,185/25,255, and breakdowns below 25,060. Respect invalidations, scale responsibly, and adapt if the market reclaims key pivots. 📊
Disclaimer: This is an educational plan, not investment advice or a trade recommendation; I am not a SEBI registered analyst .
NIFTY- Intraday Levels - 15th October 2025If NIFTY sustain above 25141 above this bullish then around 25204/08 then 25225/27/30/32 strong level above this more bullish then around 25234/38/47/53 again strong level and if it comes then watch for around 25257/66/71 above this wait
If NIFTY sustain below 25141/25 below this bearish around 25112/25093 strong level if sustain below this more bearish 25061/56 then 25047/37 then last hope 25028/17 below this wait
Consider some buffer points in above levels.
Please do your due diligence before trading or investment.
**Disclaimer -
I am not a SEBI registered analyst or advisor. I does not represent or endorse the accuracy or reliability of any information, conversation, or content. Stock trading is inherently risky and the users agree to assume complete and full responsibility for the outcomes of all trading decisions that they make, including but not limited to loss of capital. None of these communications should be construed as an offer to buy or sell securities, nor advice to do so. The users understands and acknowledges that there is a very high risk involved in trading securities. By using this information, the user agrees that use of this information is entirely at their own risk.
Thank you.
Nifty Structure Analysis & Trade Plan: 15th OctoberBased on the charts and the market's performance on Tuesday, October 14, the Nifty experienced a sharp reversal from its high and a breakdown from a short-term consolidation, indicating a shift to a short-term corrective bias.
Detailed Market Structure Breakdown
4-Hour Chart (Macro Trend)
Structure: The Nifty is now in a corrective phase within its broader bullish trend. The sharp red candle on the 4H chart indicates that the 25,250 - 25,350 supply zone has held firm.
Key Levels:
Major Supply (Resistance): 25,180 - 25,250. This area is now the critical overhead hurdle, coinciding with the previous high and a fresh Order Block (OB).
Major Demand (Support): 25,000 - 25,050. This area includes the psychological 25,000 mark and a prior FVG (Fair Value Gap), serving as the must-hold zone to prevent a deeper correction.
Outlook: The trend has shifted to sideways-to-bearish. The market is expected to test the 25,000 support zone.
1-Hour Chart (Intermediate View)
Structure: The 1H chart shows a clear Break of Structure (BOS) to the downside. The price sold off sharply after failing to sustain the move above 25,250, breaking the immediate swing low and closing below the lower trendline of the ascending channel.
Key Levels:
Immediate Resistance: 25,180 (Prior support, now resistance).
Immediate Support: 25,050 (The lower boundary of the consolidation range).
15-Minute Chart (Intraday View)
Structure: The 15M chart confirms the sharp selling pressure. The market broke out of a small consolidation range to the downside, confirming intraday bearish control. The index is currently moving within a small descending channel.
Key Levels:
Intraday Supply: 25,180.
Intraday Demand: 25,000.
Outlook: Bearish. A "Sell on Rise" strategy is recommended near 25,180.
📈 Trade Plan (Wednesday, 15th October)
Market Outlook: The Nifty is undergoing a sharp short-term correction. The primary strategy will be to sell into strength or on a breakdown of immediate support. Tech Mahindra and Persistent Systems Q2 results are due today, which will heavily influence the market.
Bearish Scenario (Primary Plan)
Justification: The market has confirmed a short-term reversal, and the structure is now corrective. Continuation toward the primary support is favored.
Entry: Short entry on a decisive break and 15-minute candle close below 25,050. Alternatively, short a retest and rejection of the 25,180 level.
Stop Loss (SL): Place a stop loss above 25,250 (above the immediate swing high/supply zone).
Targets:
T1: 25,000 (Psychological support).
T2: 24,900 (Major FVG support).
Bullish Scenario (Counter-Trend/Reversal Plan)
Justification: Only valid if Q2 results are exceptionally strong, leading to a strong move that negates the current selling pressure.
Trigger: A sustained move and close above the resistance at 25,250.
Entry: Long entry on a confirmed 15-minute close above 25,250.
Stop Loss (SL): Below 25,180.
Targets:
T1: 25,350 (Upper resistance).
T2: 25,450 (Previous high).
Key Levels for Observation:
Immediate Decision Point: 25,050 - 25,180 zone.
Bearish Confirmation: A break and sustained move below 25,050.
Bullish Confirmation: A move back above 25,250.
Line in the Sand: 25,000. Below this level, the short-term bullish bias is nullified.