NIFTY : Trading levels and Plan for 13-Oct-2025NIFTY TRADING PLAN – 13-Oct-2025
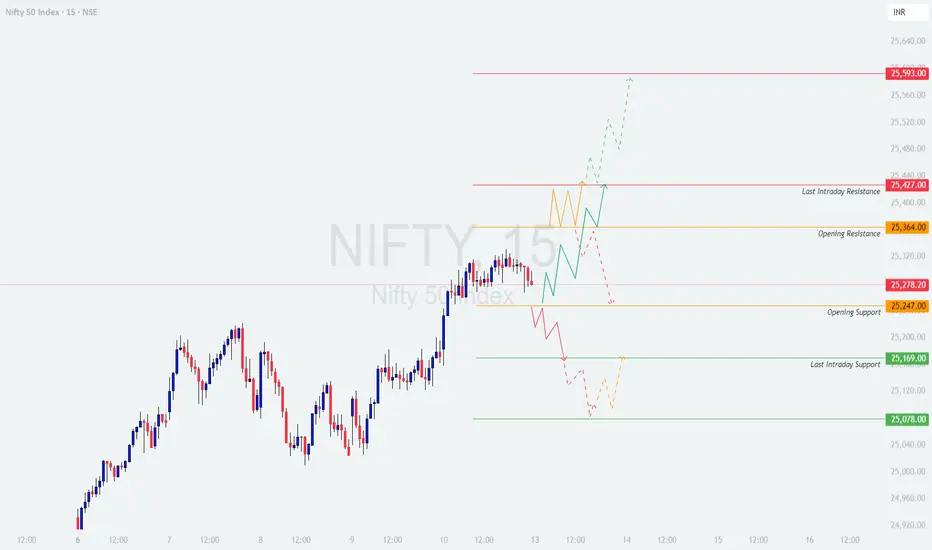
📊 Chart Timeframe: 15-Minutes
📍 Last Close: 25,278.20 | 🔽 -6.00 pts (-0.02%)
📅 Analysis Type: Psychological + Technical Levels-Based
🔍 Key Technical Levels to Watch
🟥 Last Intraday Resistance: 25,427
🟧 Opening Resistance: 25,364
🟠 Opening Support: 25,247
🟩 Last Intraday Support: 25,169
🟢 Major Support Zone: 25,078
🚀 Scenario 1 – Gap Up Opening (100+ pts above 25,380)
If Nifty opens above 25,380, it will enter a near-resistance zone between 25,364 – 25,427, making the early session crucial for direction confirmation.
In case the index sustains above 25,427 for 15–30 minutes with supportive volume, it could trigger a momentum rally toward 25,520–25,593 levels.
Avoid aggressive long entries immediately at open — instead, wait for a controlled pullback or retest near 25,364–25,400, which can offer a low-risk long entry zone.
If rejection candles appear near 25,427, it may indicate short-term profit booking. In that case, downside retracement toward 25,247 can occur.
A sustained failure to hold above 25,364 post-gap-up could turn the session choppy, so trade with confirmation.]
💡 Educational Insight:
Gap-up openings near resistance zones often invite emotional buying. Wait for the market to confirm strength through structure — not just price. Watch volume and candle behavior closely before acting.
⚖️ Scenario 2 – Flat Opening (Around 25,250 ± 50 pts)
A flat opening around the previous close keeps Nifty within the decision zone between 25,247 – 25,364.
If Nifty sustains above 25,364, bulls may regain control with upside potential toward 25,427 and then 25,593.
Failure to hold above 25,247 can trigger mild profit booking, dragging prices toward 25,169 — the last intraday support.
A bounce from 25,169 can act as a low-risk buy setup with strict stop loss below 25,078.
If a 15-min candle closes below 25,078, it confirms short-term weakness; sellers can then aim for 25,000–24,950 zones.]
🧠 Educational Tip:
Flat openings give the best opportunity to follow structure-based breakouts. Don’t predict — let price action dictate direction. Wait for a clear breakout above 25,364 or breakdown below 25,169 for a decisive trade setup.
📉 Scenario 3 – Gap Down Opening (100+ pts below 25,180)
If Nifty opens below 25,180, sentiment will lean negative, but watch how it reacts near the 25,078 major support zone.
A bounce from 25,078 can offer a relief rally toward 25,169–25,247, especially if short covering kicks in.
However, a breakdown and 15-min close below 25,078 may extend weakness toward 24,950–24,900.
Avoid chasing shorts aggressively at open — instead, wait for a pullback toward resistance near 25,169–25,200 to re-enter with better risk-reward.
The key here is patience — let the initial volatility settle before entering positions.]
💬 Educational Note:
Gap-down openings near major support often create traps. Let confirmation come through a strong close — don’t rely solely on the first few minutes of panic or excitement.
🛡️ Risk Management Tips for Options Traders
Limit your risk to 2%–3% of total trading capital per trade.
Use 15-min or hourly candle close to confirm breakouts and stop losses.
Trade ATM or slightly ITM options to minimize time decay.
Avoid over-leveraging during high-volatility gap openings.
Consider using spreads (Bull Call / Bear Put) to hedge against rapid time decay.
Book partial profits once your trade achieves a 1:1 risk/reward to protect gains.
Avoid holding options beyond 2:45 PM, as theta decay intensifies in the final hour. ⏳]
📊 Summary & Conclusion
Nifty continues to hover in a tight consolidation range, with key resistance at 25,427 and support at 25,078.
A breakout above 25,427 can trigger fresh bullish momentum toward 25,593, while a breakdown below 25,078 may open the path for 24,950.
Patience, disciplined execution, and confirmation-based entries are essential — avoid emotional trading during gap openings.
Remember: The best trades are those backed by both structure and timing, not prediction.]
🎯 Focus Zones for 13-Oct-2025:
🟩 Buyers’ Zone: 25,169 → 25,078
🟥 Sellers’ Zone: 25,364 → 25,427
📢 Disclaimer:
I am not a SEBI-registered analyst . This analysis is meant purely for educational and informational purposes. Traders are advised to perform their own research or consult a certified financial advisor before making trading decisions.
Trade ideas
Nifty Analysis - 13/10/25Nifty Analysis for tomorrow. If market react to negative word wide news then we can a good gap down opening which might be below retest or buying Zone. If that is the case then let the market close the gap first then we can look for trades. If the market opens flat then we can market going retest zone then going up, if we cross friday high then look for CE trades. For Pe trades look for candle closing below 20 EMA in 15 minutes TF, then with a small SL of 5/10 points try PE. I do not see any gap up opening as per chart.

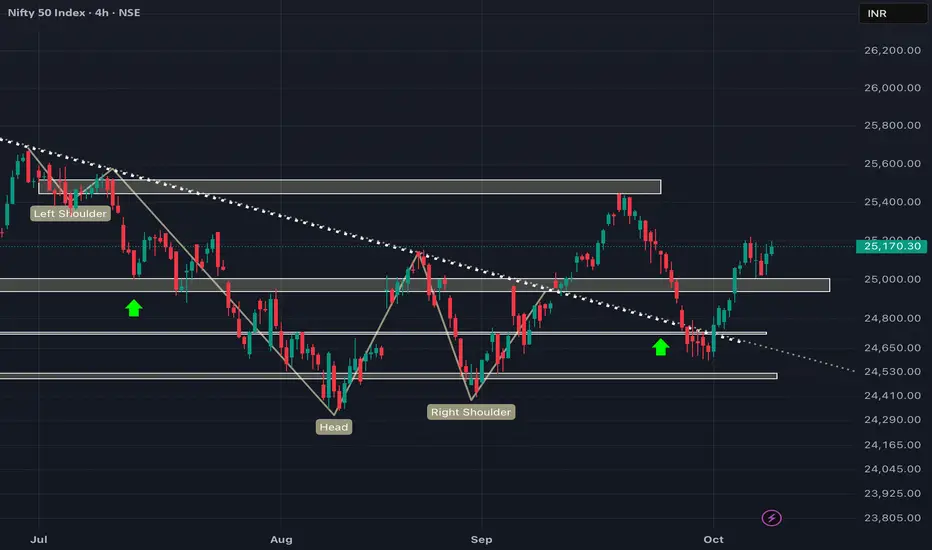
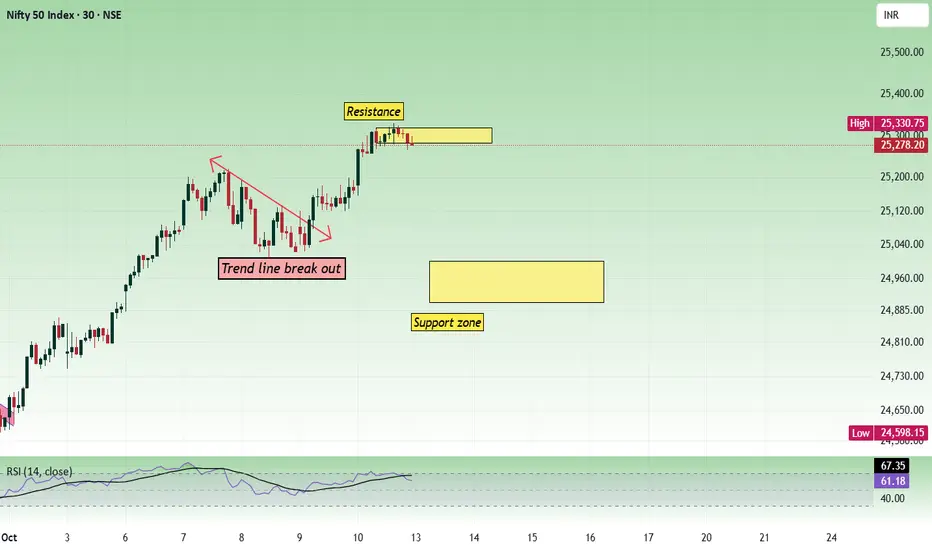
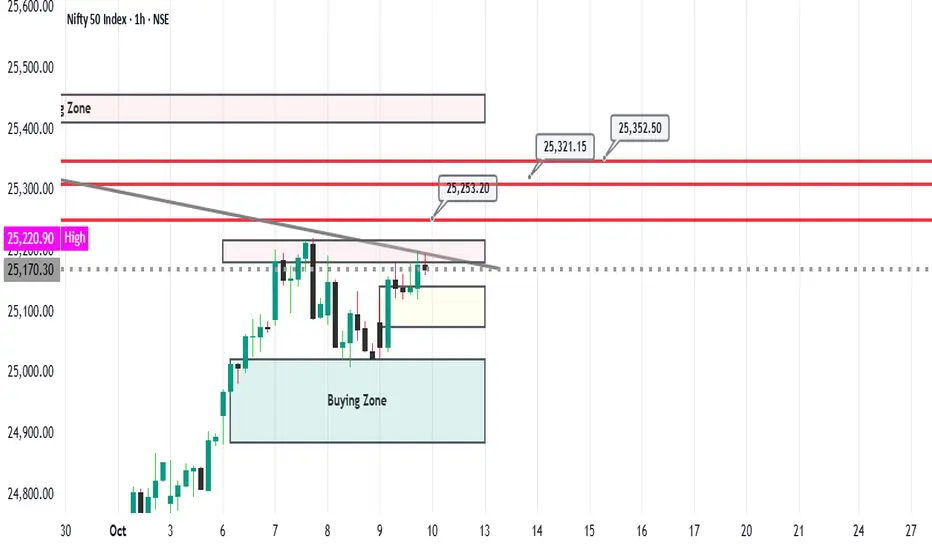
Nifty ready for 26000After the Shakeout on Wednesday, NSE:NIFTY gave two consecutive green candles and pushed the index above 25300.
That was a key resistance level, and it got broken on Friday.
Now Nifty’s Pivot has shifted up to 25257, which also sits above a major resistance zone.
On the intraday chart, the index shows a possible pullback towards the support at 25222. If that happens, it’ll be a great opportunity to accumulate some longs.
Resistance for tomorrow is at 25335.
Pivot Percentile is tight, which means if this resistance breaks, we could see a sharp rally towards 26000 very soon.
My view remains bullish from both swing and positional perspectives.
Market breadth looks positive, and the overall environment supports continued strength. So, stocks should perform well next week.
Sectors looking strong — #PSUBanks and #Finance.
Also, Auto Parts and #Tyres industry setups are forming nicely.
FnO stock for the next week: #LAURUSLABS
That’s all for the day. Take care and have a profitable tomorrow.
---
📊 Levels at a glance:
Pivot: 25257
Support: 25222 (good zone to accumulate)
Resistance: 25335 (break = rally towards 26000)
Pivot Percentile: Tight (sharp move possible)
Bias: Bullish for swing and positional trades
Sectors to watch: NSE:CNXPSUBANK , NSE:CNXFINANCE , Auto Parts, Tyres
FnO Focus: NSE:LAURUSLABS

Nifty sill on rise but will take support 24650-24500 Nifty updated levels given on chart for next week
How My Harmonic pattern projection Indicator work is explained below :
Recent High or Low :
D-0% is our recent low or high
Profit booking zone ( Early / Risky entry) : D 13.2% -D 16.1 % is
range if break them profit booking start on uptrend or downtrend but only profit booking, trend not changed
SL reversal zone (Safe entry ) : SL 23.1% and SL 25.5% is reversal zone if break then trend reverse and we can take reverse trade
Target : T1, T2, T3, T4 and .
Are our Target zone
Any Upside or downside level will activate only if break 1st level then 2nd will be active if break 2nd then 3rd will be active.
Total we have 7 important level which are support and resistance area
Until , 16% not break uptrend will continue if break then profit booking will start.
If break 25% then fresh downtrend will start then T1, T2,T3 will activate
1,3,5,10,15,20 minutes are short term levels.
30 minutes 60 minutes , 2 hours,3 hours, ... 1 day and 1 week chart positional and long term levels

“Nifty 50 Intraday Key Levels | Buy & Sell Zones 13th Oct 2025”“Want to learn more? Like this post and follow me!”
25473 🔴 Above 10m closing Shot Cover Level
Strong resistance — short covering likely above this.
25370 🟠 Below 10m hold PE By level /
Above 10m hold CE by level
25283 🟣 Above 10M hold positive trade view
Below 10M hold negative trade view
Sentiment deciding level — crucial for trend direction.
25120 ⚫ Above Opening S1 10m Hold CE By level
Bullish entry level — CE hold area.
24990 🟠 Below Opening R1 10m Hold PE By level
Below 10m hold PE By Risky Zone Weak zone — PE may strengthen below this.
24790 🟢 Above 10M hold CE By Safe Zone level
Safe bullish zone — CE can be held confidently above.
24770 🔵 BELOW 10M hold UNWINDING level
Breakdown zone — unwinding or heavy selling possible below.

#Nifty | Will Nifty Break Free? Triangle Says Soon!#Nifty Daily Outlook:
CMP: 25,285
Pattern: Symmetrical Triangle ▶️
A Symmetrical Triangle pattern is forming on the daily timeframe , following a strong uptrend , a classic bullish continuation setup .
🟣 Breakout Level: A daily close above the falling trendline from the all-time high (ATH) ( marked in purple ) will confirm the breakout.
🎯 Pattern Target: 26,700
🔒 Pattern Invalidation: Close below 24,337 DCB
Price action is compressing tightly within the triangle, indicating a potential volatility expansion soon.
Breakout confirmation could reignite momentum toward new highs.
✅ Dips into support zones can be used for positioning, with proper risk management.
📌 Support & resistance levels remain the same as shared in the tagged weekly post.
#Nifty | #Nifty50 | #SymmetricalTriangle | #ChartPatterns | #SwingTrading | #PriceAction
📌 Disclaimer: This analysis is shared for educational purposes only. It is not a buy/sell recommendation. Please do your own research before making any trading decisions.

Nifty - Weekly Review Oct 13 to Oct 17Price has been facing resistance at the 25320 zone and has been unable to break through it on Friday. If we have a gap-down opening due to the weakness in global markets, 24900 - 25000 can act as a support zone. 24900 to 25000 can become choppy if there is no trend strength. If the support is broken, the next support will be 24600.
Let us assume we have a gap down opening near 25000.
Buy if there is any bullish strength above 25000 with the stop loss of 24950 for the targets 25040, 25080, 25120, 25200, 25280, 24320, 25360, and 24420.
Sell below 24880 with the stop loss of 24930 for the targets 24840, 24800, 24740, 24680, 24620, 24560, 24520, 24480, and 24400.
Always do your own analysis before taking any trade.
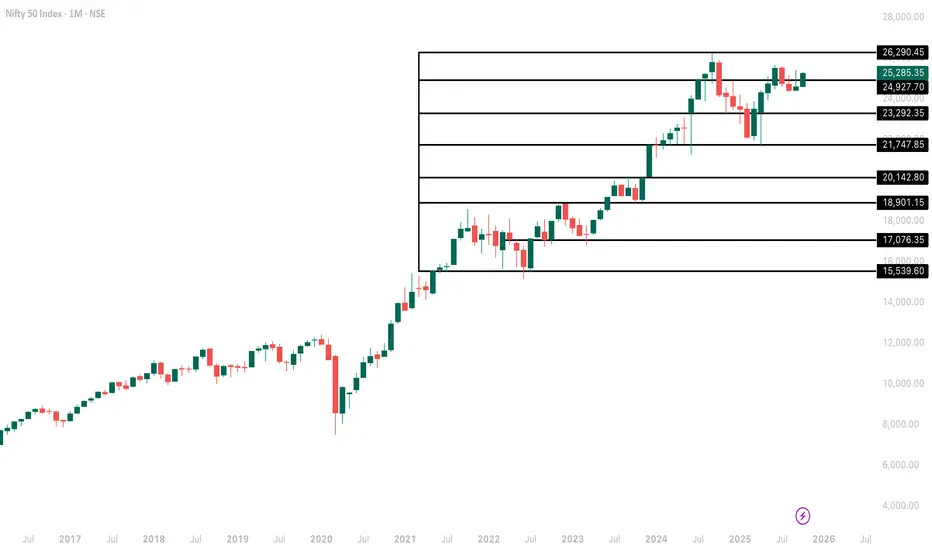
Important Levels - NIFTY50Important NIFTY50 levels that I have been following over the past few years.
#Nifty Weekly Outlook – Cup & Handle in Focus!CMP: 25,285
Primary Trend: Uptrend (Bullish Bias)
🔽 Support Zones
• 25154 – 25084
• 24858 – 24768
• 24588 (Major swing support)
🔼 Resistance Zones
• Immediate Resistance: 25424 – 25449
• Next Hurdles: 25638 – 25669
• Key Breakout Level: 26179 – 26277.35 (ATH)
Pattern: Cup & Handle ☕️
A classic Cup & Handle pattern is forming on the weekly timeframe , following a strong uptrend, which is a bullish continuation setup.
• 🧭 Neckline breakout (sloping white trendline) is the key trigger.
• 🎯 Target Projection: ~29,500 (~16% upside potential post-breakout)
🔒 Pattern Invalidation Level
• Weekly close below 24,337 negates the pattern.
⏳ Awaiting Breakout Confirmation
• A weekly close above the neckline with solid volume will confirm the breakout .
• Until then, price remains in a healthy consolidation.
✅ Dips into support zones can be used for positioning, with proper risk management.
#Nifty | #Nifty50 | #CupAndHandle | #ChartPatterns | #SwingTrading | #PriceAction
📌 Disclaimer: This analysis is shared for educational purposes only. It is not a buy/sell recommendation. Please do your own research before making any trading decisions.

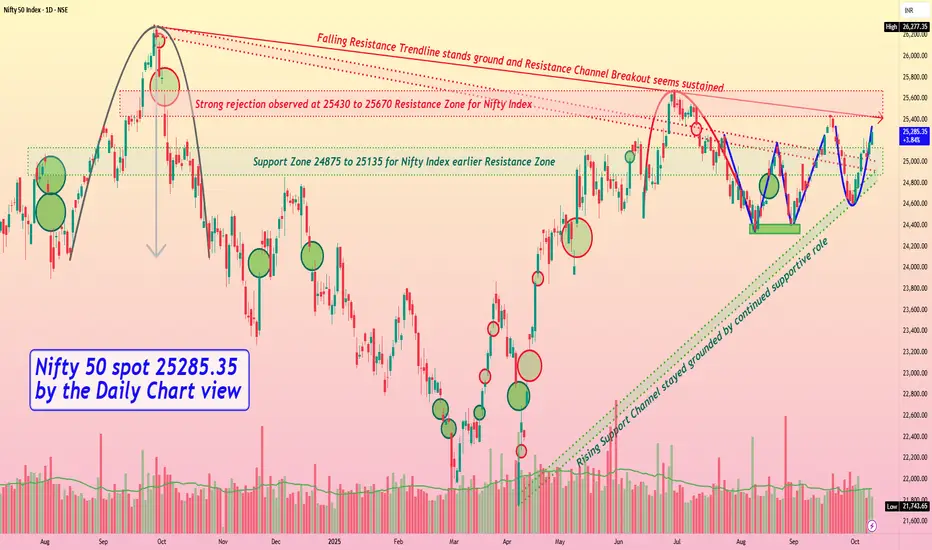
Nifty 50 spot 25285.35 by the Daily Chart view - Weekly updateNifty 50 spot 25285.35 by the Daily Chart view - Weekly update
- Support Zone 24875 to 25135 for Nifty Index earlier Resistance Zone
- Rising Support Channel stayed grounded by continued supportive role
- Strong rejection observed at 25430 to 25670 Resistance Zone for Nifty Index
- Falling Resistance Trendline stands ground and Resistance Channel Breakout seems sustained
- Bullish Technical patterns of "W" Double Bottom followed by Rounding Bottom formed around Support Zone
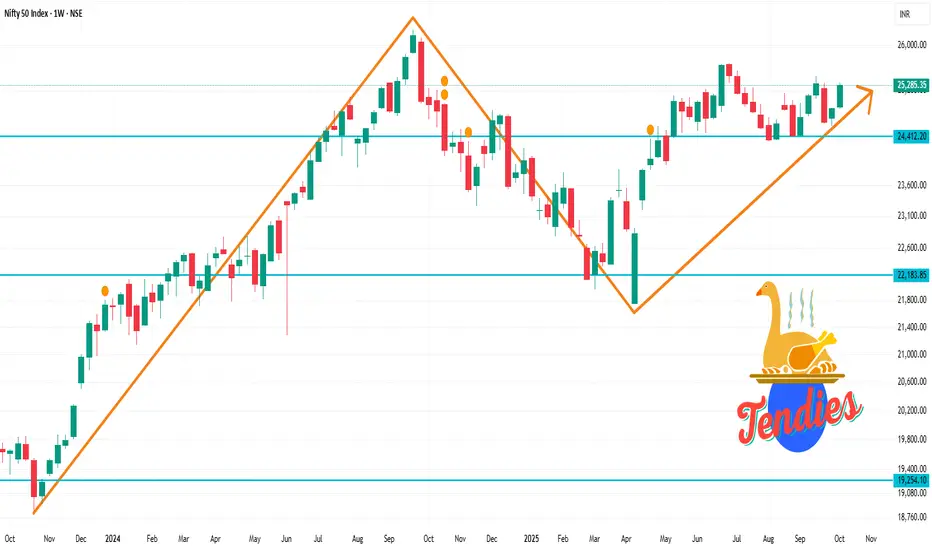
Nifty 50 1 Week time frame Key Technical Levels for the Week Ahead:
Resistance Levels:
25,000–25,100: This zone has been identified as a significant resistance area. A breakout above 25,100 could potentially lead to a rally towards 25,400.
Support Levels:
24,400–24,500: This range is considered a key support zone. A failure to hold above this level may indicate weakness in the index.
Analysts suggest that the Nifty 50 may trade within a defined range in the near term, with resistance expected around the 24,800 mark and strong support near the 200-day exponential moving average at 24,200.
Impact of US Federal Reserve Interest Rate on the Indian EconomyIntroduction
The United States Federal Reserve (commonly known as the Fed) plays a central role in shaping global monetary policy. As the world’s most influential central bank, the Fed’s decisions on interest rates have a ripple effect across global financial markets, influencing currencies, stock markets, trade flows, inflation, and investment decisions worldwide. For emerging economies like India, the impact of US Fed rate changes is particularly significant.
India, being a major developing economy with increasing integration into global markets, is deeply influenced by the movements of the US dollar, capital flows, and investor sentiment — all of which are affected by Fed policies. This relationship underscores how a rate hike or cut by the Fed can either strengthen or strain India’s financial stability, economic growth, and trade balance.
This essay explores how the US Federal Reserve’s interest rate policies affect the Indian economy in multiple dimensions — including the exchange rate, capital markets, inflation, foreign investments, trade, and monetary policy alignment — while also discussing historical trends, recent developments, and possible future scenarios.
Understanding the US Federal Reserve and Its Policy Decisions
The US Federal Reserve determines monetary policy primarily through three tools:
Federal Funds Rate: The benchmark interest rate at which banks lend to each other overnight.
Open Market Operations: Buying or selling government securities to control liquidity.
Reserve Requirements: The portion of deposits that banks must hold as reserves.
When the Fed raises interest rates, it aims to control inflation by making borrowing costlier, reducing consumption and investment in the US economy. Conversely, when it lowers rates, it stimulates economic growth by making credit cheaper.
However, since the US dollar is the world’s dominant reserve currency and global trade is largely denominated in dollars, these decisions extend far beyond the US borders. Emerging markets like India feel the heat (or benefit) almost immediately through movements in capital flows, exchange rates, and commodity prices.
Mechanism of Transmission to the Indian Economy
The Fed’s rate changes affect India through several interconnected channels:
Capital Flows:
Higher US interest rates attract investors to shift funds from emerging markets to the US for better returns. This leads to capital outflows from India, putting pressure on the rupee and Indian financial markets.
Exchange Rate Movements:
As foreign investors withdraw funds, the Indian Rupee (INR) tends to depreciate against the US Dollar (USD). This increases the cost of imports and can worsen India’s trade deficit.
Commodity Prices:
A stronger dollar generally leads to a decline in global commodity prices (such as oil and metals), which can both benefit and hurt India depending on the price elasticity and sectoral dependencies.
Inflationary Impact:
A weaker rupee makes imported goods (especially crude oil) more expensive, contributing to imported inflation.
Stock Market Reactions:
Rate hikes in the US often trigger foreign institutional investors (FIIs) to sell equities in emerging markets. This can cause short-term corrections or volatility in Indian markets.
Monetary Policy Coordination:
The Reserve Bank of India (RBI) often aligns its monetary stance with global trends to maintain stability. If the Fed tightens, the RBI may follow suit to prevent excessive capital flight.
Historical Perspective: Fed Rate Movements and India’s Response
1. The 2008 Global Financial Crisis and Aftermath:
After the 2008 crisis, the Fed reduced rates to near zero and introduced Quantitative Easing (QE) to infuse liquidity into the system. This led to an abundance of cheap money flowing into emerging economies, including India.
India witnessed strong capital inflows, a booming stock market, and currency appreciation during this period.
However, the excess liquidity also created inflationary pressures and asset bubbles.
2. The 2013 “Taper Tantrum”:
When the Fed announced plans to scale back QE, emerging markets faced sudden outflows. India’s rupee depreciated sharply — from around ₹55 to ₹68 per USD — and inflation spiked.
The RBI had to intervene by tightening monetary policy and using foreign exchange reserves to stabilize the rupee.
This episode demonstrated India’s vulnerability to Fed policy shifts.
3. The 2015–2018 Rate Hike Cycle:
The Fed gradually raised rates as the US economy recovered. India faced moderate outflows, but due to strong domestic fundamentals and stable inflation, it managed to withstand the shock better than in 2013.
4. The COVID-19 Pandemic (2020–2021):
During the pandemic, the Fed once again cut rates to near zero and launched massive stimulus programs. This led to large foreign inflows into Indian equity markets, boosting stock valuations and liquidity.
The Sensex and Nifty reached record highs, and the rupee stabilized despite the economic slowdown.
5. The 2022–2023 Rate Hike Cycle:
To combat post-pandemic inflation, the Fed aggressively raised rates. The impact on India was notable — capital outflows increased, the rupee depreciated to record lows near ₹83/USD, and inflationary pressures persisted.
RBI responded with its own rate hikes to maintain balance and defend the currency.
Impact on Key Sectors of the Indian Economy
1. Exchange Rate and External Sector:
The rupee’s value is directly influenced by Fed rate decisions. A stronger dollar reduces the attractiveness of the rupee, leading to depreciation. This has mixed effects:
Positive: Exports (like IT services and pharmaceuticals) become more competitive.
Negative: Imports (especially crude oil, electronics, and gold) become costlier, widening the current account deficit.
2. Inflation and Monetary Policy:
A weaker rupee increases the price of imported goods, pushing inflation higher. To counteract this, RBI may raise domestic interest rates — which can slow down growth and investment.
3. Stock and Bond Markets:
Foreign portfolio investors (FPIs) play a huge role in India’s financial markets.
When US rates rise, they tend to pull out investments from Indian equities and bonds, leading to volatility.
Conversely, when US rates fall, India often witnesses renewed FPI inflows.
4. Banking and Financial Sector:
Higher global rates influence the cost of borrowing for Indian companies with external debt. Firms with significant dollar-denominated loans face higher repayment burdens.
Banks with foreign liabilities may also experience tighter liquidity and reduced profitability.
5. Corporate and Consumer Borrowing:
If RBI raises rates in response to Fed hikes, domestic loan rates increase, affecting business expansion, real estate demand, and consumer spending.
Impact on Foreign Investments (FII and FDI)
Foreign Institutional Investors (FIIs):
FIIs are highly sensitive to interest rate differentials. A higher US yield reduces the relative attractiveness of Indian assets. Sudden outflows can lead to currency depreciation and market instability.
Foreign Direct Investment (FDI):
While FDI is more long-term and less sensitive to short-term rate movements, prolonged tightening cycles can still affect investor sentiment and the cost of capital for multinational corporations investing in India.
Trade Balance and Current Account Deficit (CAD)
When the dollar strengthens due to Fed hikes, India’s import bill rises, especially since the country imports over 80% of its crude oil requirements.
This worsens the Current Account Deficit (CAD), which in turn can pressure the rupee further.
Export-oriented sectors may benefit, but the overall impact on the trade balance is often negative due to high import dependency.
RBI’s Role in Managing the Spillover Effects
The Reserve Bank of India uses multiple strategies to mitigate the impact of Fed rate decisions:
Monetary Policy Adjustments: Aligning repo rate hikes or cuts to maintain interest rate parity and control inflation.
Forex Market Intervention: Selling or buying dollars from its reserves to manage rupee volatility.
Macroprudential Measures: Encouraging domestic capital formation and diversifying external borrowing.
Strengthening Foreign Exchange Reserves: India’s reserves (over $650 billion as of 2024) act as a buffer against external shocks.
Opportunities for India Amid Fed Tightening
While rate hikes pose challenges, they also present strategic opportunities:
Boost for Exporters: A weaker rupee improves export competitiveness.
Domestic Manufacturing Incentives: Costlier imports push local industries to enhance production capabilities under the Make in India initiative.
Long-term Stability: The RBI’s cautious approach helps build macroeconomic resilience and investor confidence.
Challenges Ahead
Despite policy resilience, India faces several ongoing challenges from Fed policy shifts:
Currency Volatility: Persistent depreciation pressures can erode investor confidence.
High Inflation Risk: Imported inflation through oil and commodities can strain household budgets.
Debt Servicing Costs: Higher global interest rates increase repayment costs for companies with external debt.
Portfolio Outflows: Unstable FII flows make Indian markets vulnerable to global risk sentiment.
Future Outlook
As global monetary policy gradually normalizes, India must navigate a complex environment of tightening liquidity, evolving inflation dynamics, and changing investor sentiment.
Short-term: Volatility in currency and equity markets may persist. RBI is likely to continue balancing growth and inflation through calibrated rate moves.
Medium-term: If India maintains fiscal discipline, deepens domestic capital markets, and enhances manufacturing, it can absorb external shocks more effectively.
Long-term: India’s growing economic strength, demographic advantage, and digital transformation position it to emerge as a resilient economy, even amid global monetary tightening cycles.
Conclusion
The US Federal Reserve’s interest rate decisions have profound implications for the Indian economy, influencing everything from currency value and inflation to capital flows and trade dynamics. While India cannot fully insulate itself from global shocks, prudent policy coordination between the RBI and the government has enabled the country to withstand past crises and build a stronger macroeconomic foundation.
Ultimately, the key lies in maintaining a balanced approach — fostering sustainable growth while safeguarding financial stability. As India continues to integrate into the global economy, understanding and anticipating the Fed’s moves will remain essential for policymakers, investors, and businesses alike.
Nifty at Resistance zone Breakout trend line 25700 level close move to next level 26300 zone.
Education purpose only

Nifty Intraday Analysis for 10th October 2025NSE:NIFTY
Index has resistance near 25350 – 25400 range and if index crosses and sustains above this level then may reach near 25550 – 25600 range.
Nifty has immediate support near 25000 – 24950 range and if this support is broken then index may tank near 24800 – 24750 range.
Daily Update Nifty: 10/10/25There is a trap for both buyers and sellers today. Careful in the range of 25300-25330 spot.

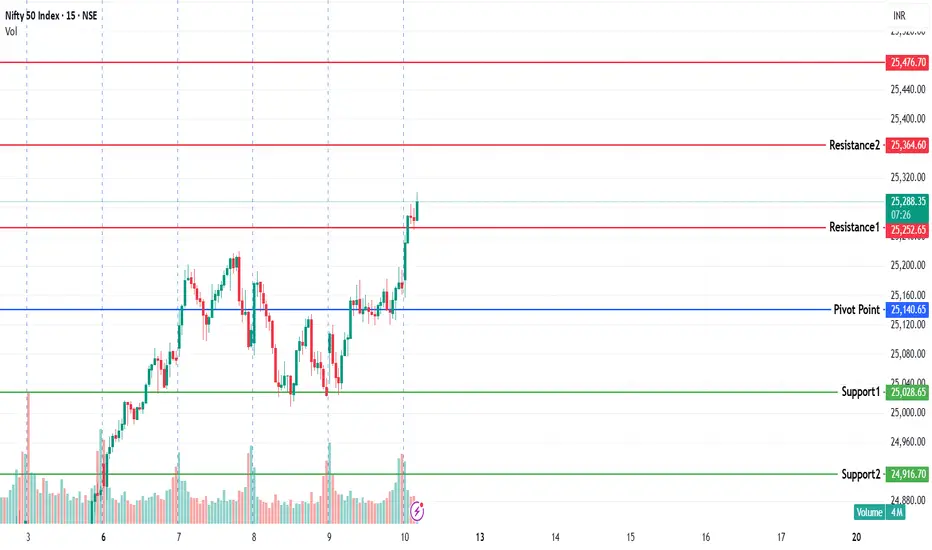
NIFTY KEY LEVELS FOR 10.10.2025NIFTY KEY LEVELS FOR 10.10.2025
Timeframe: 3 Minutes
If the candle stays above the pivot point, it is considered a bullish bias; if it remains below, it indicates a bearish bias. Price may reverse near Resistance 1 or Support 1. If it moves further, the next potential reversal zone is near Resistance 2 or Support 2. If these levels are also broken, we can expect the trend.
When a support or resistance level is broken, it often reverses its role; a broken resistance becomes the new support, and a broken support becomes the new resistance.
If the range(R2-S2) is narrow, the market may become volatile or trend strongly. If the range is wide, the market is more likely to remain sideways
please like and share my idea if you find it helpful
📢 Disclaimer
I am not a SEBI-registered financial adviser.
The information, views, and ideas shared here are purely for educational and informational purposes only. They are not intended as investment advice or a recommendation to buy, sell, or hold any financial instruments.
Please consult with your SEBI-registered financial advisor before making any trading or investment decisions.
Trading and investing in the stock market involves risk, and you should do your own research and analysis. You are solely responsible for any decisions made based on this research.
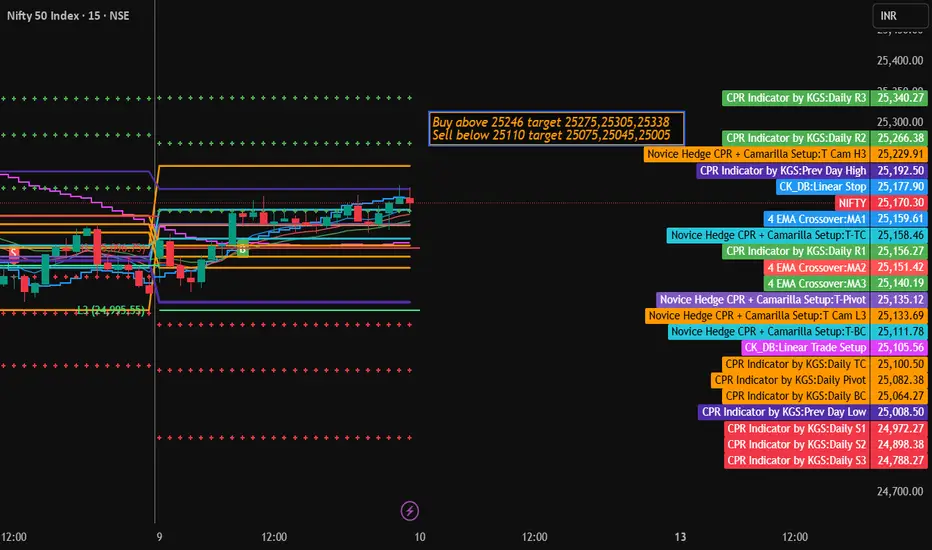
Nifty Trading Strategy for 10th October 2025📊 NIFTY Intraday Trading Plan
🟩 Buy Setup
Entry: Buy above the high of the 5-minute candle if the price closes above 25,246
Targets:
🎯 Target 1: 25,275
🎯 Target 2: 25,305
🎯 Target 3: 25,338
Stop Loss: Below the low of the breakout candle
🟥 Sell Setup
Entry: Sell below the low of the 15-minute candle if the price closes below 25,110
Targets:
🎯 Target 1: 25,075
🎯 Target 2: 25,045
🎯 Target 3: 25,005
Stop Loss: Above the high of the breakdown candle
⚙️ Trade Management Tips
Wait for a candle close confirmation before entering.
Avoid trading during high volatility news events.
Use strict risk management — never risk more than 1–2% of your capital on a single trade.
Trail stop-loss after each target hits to lock in profits.
⚠️ Disclaimer
📢 This analysis is for educational and informational purposes only.
💡 I am not a SEBI-registered analyst or advisor.
💼 Trading in stock markets involves risk. Please consult your financial advisor before taking any position.
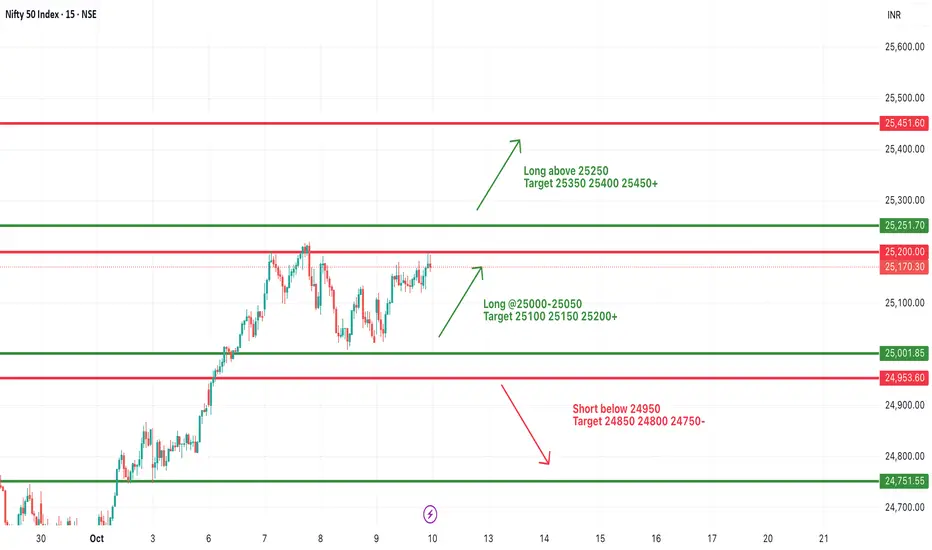
#NIFTY Intraday Support and Resistance Levels - 10/10/2025Nifty is expected to open flat around the 25,150–25,200 zone, indicating a neutral start after recent sessions of consolidation. The index is trading near a crucial resistance area, suggesting that traders may wait for a breakout before committing to fresh positions.
If Nifty sustains above 25,000–25,050, it can gradually move higher toward 25,100, 25,150, and 25,200 levels. A breakout above 25,250 will further strengthen the bullish momentum, paving the way for an extended rally toward 25,350–25,450+.
On the downside, immediate support lies near 24,950. A breakdown below this level may invite short-term selling pressure, pushing the index toward 24,850, 24,800, and 24,750-.
Overall, the sentiment remains range-bound with a slight bullish bias. Traders should wait for a confirmed move beyond 25,250 or below 24,950 for directional clarity, keeping strict stop-loss levels in place for intraday trades.
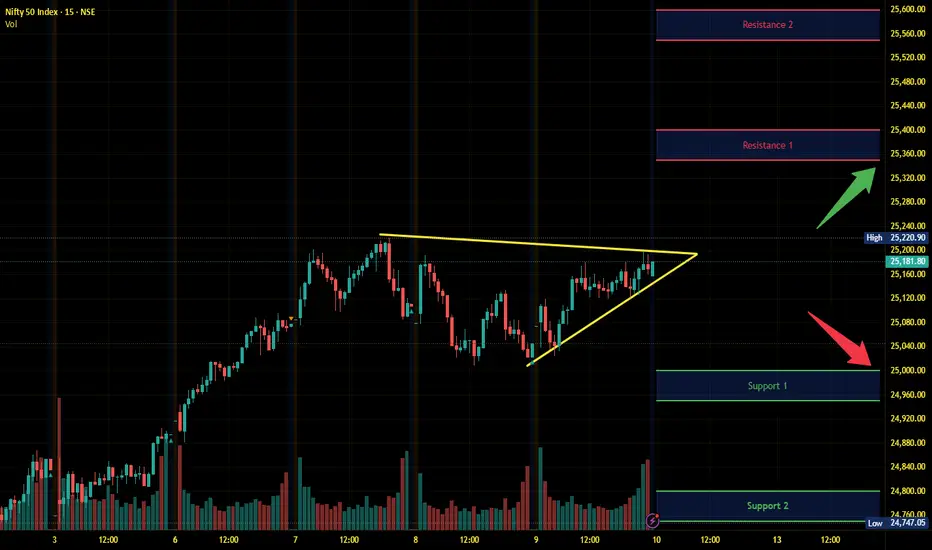
NIFTY Levels for Today
Here are the NIFTY's Levels for intraday (in the image below) today. Based on market movement, these levels can act as support, resistance or both.
Please consider these levels only if there is movement in index and 15m candle sustains at the given levels. The SL (Stop loss) for each BUY trade should be the previous RED candle below the given level. Similarly, the SL (Stop loss) for each SELL trade should be the previous GREEN candle above the given level.
Note: This idea and these levels are only for learning and educational purpose.
Your likes and boosts gives us motivation for continued learning and support.
Nifty Analysis - 10/10/25Market is bullish so look for CE trades. Buy on dip should be followed. On daily and hourly TF we see bullish trend. If we break trendline then we can go for CE with the targets mentioned above. Unless its a big gap down opening I do not see bearish trend on chart. Will update levels if anything unusual happens.
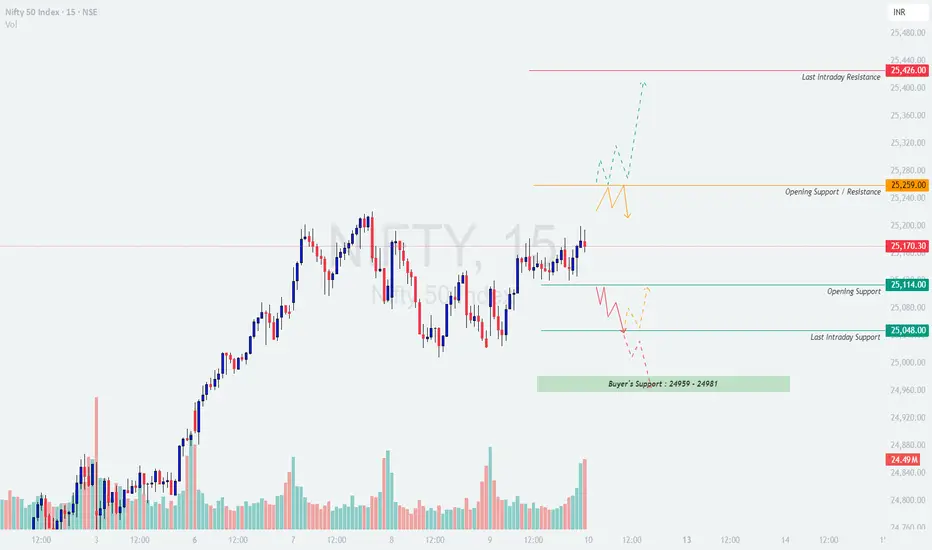
NIFTY : Trading levels and plan for 10-10-2025💼 NIFTY TRADING PLAN – 10-Oct-2025
📊 Chart Timeframe: 15-min
📍 Last Close: 25,170.30 | 🔻 Change: -7.40 pts (-0.03%)
📅 Analysis Based on Psychological & Technical Levels
🔍 Key Technical Zones
🟧 Opening Support / Resistance: 25,259
🟥 Last Intraday Resistance: 25,426
🟩 Opening Support: 25,114
🟢 Last Intraday Support: 25,048
💚 Buyer’s Support Zone: 24,959 – 24,981
🚀 Scenario 1 – Gap Up Opening (100+ pts above 25,270)
If Nifty opens near or above 25,270, it will directly approach the opening resistance zone.
A sustained move above 25,259 with strong green candles could trigger momentum buying toward 25,426, which is the last intraday resistance.
Avoid chasing the first 15 minutes — wait for a minor pullback to 25,259–25,280 and look for support confirmation before going long.
If Nifty fails to sustain above 25,259, expect short-term profit booking that can drag prices toward 25,170 or even 25,114.
Fresh shorts should be avoided until there’s a confirmed reversal candle near 25,400–25,426, as this area may trigger volatility and fake breakouts.]
🧠 Educational Insight:
Gap-up openings near resistance often create a “trap zone.” Patience is key — let the price test and confirm breakout strength before entering directional trades.
⚖️ Scenario 2 – Flat Opening (Around 25,150 ± 50 pts)
A flat start indicates market indecision and provides both long and short opportunities based on level reactions.
If the index sustains above 25,170–25,200, buyers may attempt to push prices toward 25,259 → 25,426. Watch for volume expansion to confirm momentum.
If Nifty rejects 25,259, expect a dip toward 25,114–25,048, which will act as short-term intraday supports.
Buyers can look for reversal confirmation from 25,048–25,114 zone for potential bounce trades.
A decisive hourly close below 25,048 may shift intraday trend bearish toward 24,981–24,959 (Buyer’s Support Zone).]
💡 Educational Note:
Flat openings favor disciplined traders who react to confirmation rather than prediction. Combining 15-min chart patterns with volume clues gives higher probability entries.
📉 Scenario 3 – Gap Down Opening (100+ pts below 25,060)
If Nifty opens around or below 25,060, it enters the support testing zone.
Monitor early reactions near 25,048–25,020. A quick recovery from this area can lead to a short-covering rally back toward 25,114–25,170.
If the index sustains below 25,020, expect a gradual slide toward the Buyer’s Support Zone (24,959–24,981) — a critical area where bulls might attempt to defend.
Failure to hold 24,959 could invite further downside toward 24,880–24,840, so avoid catching a falling knife without confirmation.
Intraday traders should prefer trading only on sustained 15-min candle closes below key levels to avoid whipsaws.]
🧠 Educational Insight:
Gap-down openings can trigger emotional decisions — let the first 30 minutes unfold before entering trades. Reversal setups are only valid with clear rejection wicks or bullish engulfing candles near key supports.
🛡️ Risk Management Tips for Options Traders
Limit trade exposure to 2–3% of total capital per trade.
Always use a stop loss based on 15-min candle close to avoid fake breakouts.
Prefer ATM or slightly ITM options for better delta and reduced time decay.
Avoid holding losing positions after 2:45 PM, as premium decay accelerates.
When volatility rises, use spreads (Bull Call / Bear Put) to manage theta and vega risk.
Never average losing trades — protect capital before chasing profit. 💎
📊 Summary & Conclusion
Nifty remains in a neutral-to-bullish structure, as long as it sustains above 25,048.
Upside momentum may resume only above 25,259, targeting 25,426.
A breakdown below 25,048 could shift control to sellers, pulling prices toward 24,981–24,959.
Traders should watch 15-min closing confirmations and volume expansion before taking directional positions.]
🎯 Focus Zone for 10-Oct-2025:
🟩 25,048 → 24,959 (Buyers’ Defensive Zone)
🟥 25,259 → 25,426 (Sellers’ Dominance Zone)
📢 Disclaimer:
I am not a SEBI-registered analyst . This analysis is purely for educational and informational purposes. Traders should perform their own due diligence or consult with a financial advisor before making trading decisions.
NIFTY 25950 coming soon Nifty in 1hour chart looking super bullish
Once abv 25190.. we can expect target of 25350/25550/25655/25950 coming before diwali

RETEST DONE!! Heading towards 25500 now! EXPLAINED!!NIFTY did showed strength exactly as analysed which was followed by a RETEST which can add fuel to the fire to the rally. We have also asked to BUY at important demand zones as we stood by our analysis. Now that it has also taken SUPPORT at important demand zone, we can expect NIFTY to continue its rally towards 25500 which is its next SUPPLY ZONE. So, keep watching and plan your trades accordingly.