NIFTY : Trading levels and Plan for 08-Oct-2025📊 NIFTY TRADING PLAN – 08-Oct-2025
💼 Levels to Watch:
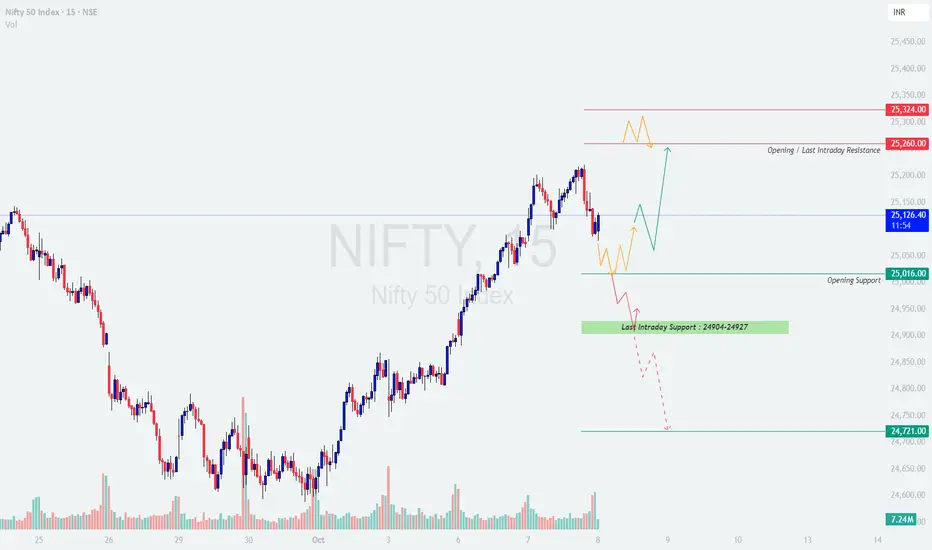
• Opening / Last Intraday Resistance: 25,260 – 25,324
• Opening Support: 25,016
• Last Intraday Support Zone: 24,904 – 24,927
• Next Major Support: 24,721
• Previous Close: 25,079
🟢 1️⃣ GAP-UP OPENING (Above 25,180 – around 100+ points from previous close)
If Nifty opens with a gap-up near the 25,180–25,220 zone, it will quickly approach the 25,260 resistance, which also acted as the last intraday ceiling. This area will decide whether the bullish momentum can continue or if early selling pressure comes in.
✅ Plan of Action:
Wait for the first 30-minute candle to confirm whether Nifty sustains above 25,260. If it holds, expect a move towards 25,324 and potentially 25,400.
If the price fails to hold above 25,260 and shows rejection, avoid chasing longs — a pullback toward 25,016–25,050 can occur as bulls try to regain strength.
Avoid aggressive buying immediately on the gap-up; instead, let the market confirm direction.
When the market opens with strength, it’s vital to wait for confirmation rather than reacting to the initial sentiment. This helps in avoiding false breakouts during the first 30 minutes of volatility.
🟧 2️⃣ FLAT OPENING (Around 25,050 ±100 points)
A flat opening near 25,050–25,100 creates an interesting zone between the Opening Support (25,016) and Resistance (25,260). This is where the market often consolidates before a directional move begins.
✅ Plan of Action:
A clear hourly candle close above 25,260 will confirm strength and likely push Nifty toward 25,324–25,400.
If Nifty fails to break 25,260 and slips below 25,016, then weakness could expand toward 24,927 and even 24,721.
Use this range to observe whether institutions are accumulating or distributing — strong volume spikes often confirm the next trend.
Flat openings require patience — let the structure develop and price show its hand. Following confirmation keeps you aligned with the actual market bias rather than the expectation.
🔻 3️⃣ GAP-DOWN OPENING (Below 24,980 – around 100+ points from previous close)
If Nifty opens below 24,980, it will immediately challenge the 24,904–24,927 support zone. This region is critical — a bounce can attract short-covering, but a breakdown can accelerate the downside momentum.
✅ Plan of Action:
If price shows reversal signals (like a hammer or bullish engulfing candle) near 24,904–24,927, a short-covering move toward 25,016 may occur.
If 24,904 fails to hold and price sustains below, expect further decline toward 24,721 — this can trigger panic selling or momentum shorts.
Avoid bottom-fishing on a large gap-down; instead, trade only after a proper price confirmation.
Gap-downs often come with emotional panic — being calm and waiting for a structured setup keeps you on the right side of the trade.
💡 RISK MANAGEMENT & OPTIONS TRADING TIPS
Avoid trading the first 15–30 minutes after a gap-up or gap-down — let volatility cool.
Always confirm trend with hourly candle closing before entering positional trades.
If the direction is uncertain, use spread strategies (Bull Call or Bear Put) to manage theta decay.
Avoid deep OTM options — pick strikes within the next 100–150 points for better delta and liquidity.
Stick to 1–2% capital risk per trade to maintain consistency and avoid emotional losses.
📘 SUMMARY & CONCLUSION
The level 25,016 remains the crucial line for directional confirmation. Sustaining above it favors bulls, with 25,260–25,324 acting as resistance zones. However, weakness below 24,927 can push Nifty into a bearish phase toward 24,721.
The market is showing signs of short-term correction after a strong recovery, so patience and discipline will be key. Let the market confirm before acting — don’t anticipate, react wisely.
⚠️ Disclaimer:
I am not a SEBI-registered analyst. This analysis is purely for educational and informational purposes only. Please conduct your own research or consult a financial advisor before taking any position.
Trade ideas
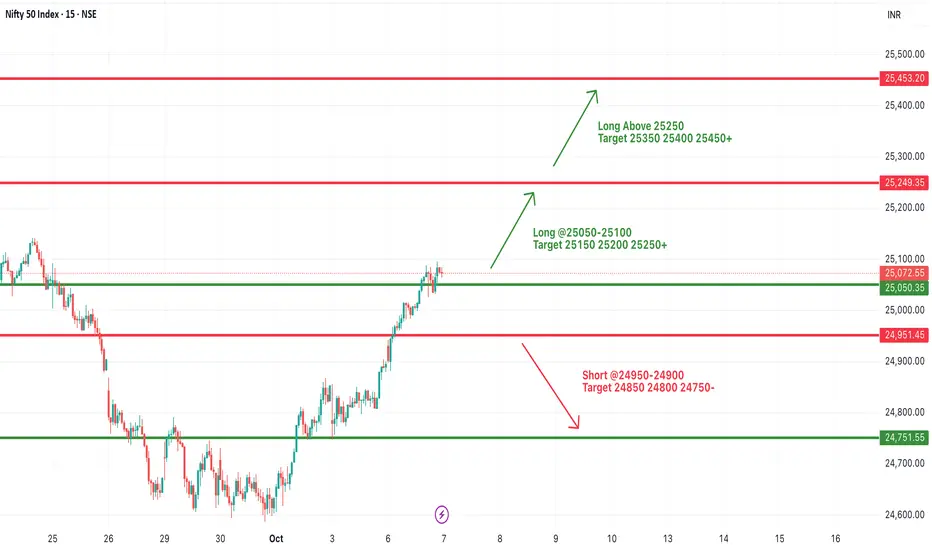
#NIFTY Intraday Support and Resistance Levels - 08/10/2025Nifty is expected to open with a gap-up around the 25,100 level, continuing its bullish momentum from the last few sessions. The index has been forming a strong uptrend pattern, consistently finding support at higher levels, which indicates sustained buying interest in the market.
If Nifty sustains above 25,050–25,100, it may extend the upmove toward 25,150, 25,200, and 25,250+. A breakout above 25,250 will likely trigger further upside momentum, taking the index toward 25,350–25,450+ levels.
On the downside, immediate support is placed near 25,000–24,950. A breakdown below this zone could invite mild profit booking, dragging the index toward 24,850 and 24,750-.
Overall, the sentiment remains positive with a gap-up opening. Traders should look for buying opportunities on dips while maintaining strict stop-losses below 24,950 for intraday trades.

NIFTY Levels for Today
Here are the NIFTY's Levels for intraday (in the image below) today. Based on market movement, these levels can act as support, resistance or both.
Please consider these levels only if there is movement in index and 15m candle sustains at the given levels. The SL (Stop loss) for each BUY trade should be the previous RED candle below the given level. Similarly, the SL (Stop loss) for each SELL trade should be the previous GREEN candle above the given level.
Note: This idea and these levels are only for learning and educational purpose.
Your likes and boosts gives us motivation for continued learning and support.
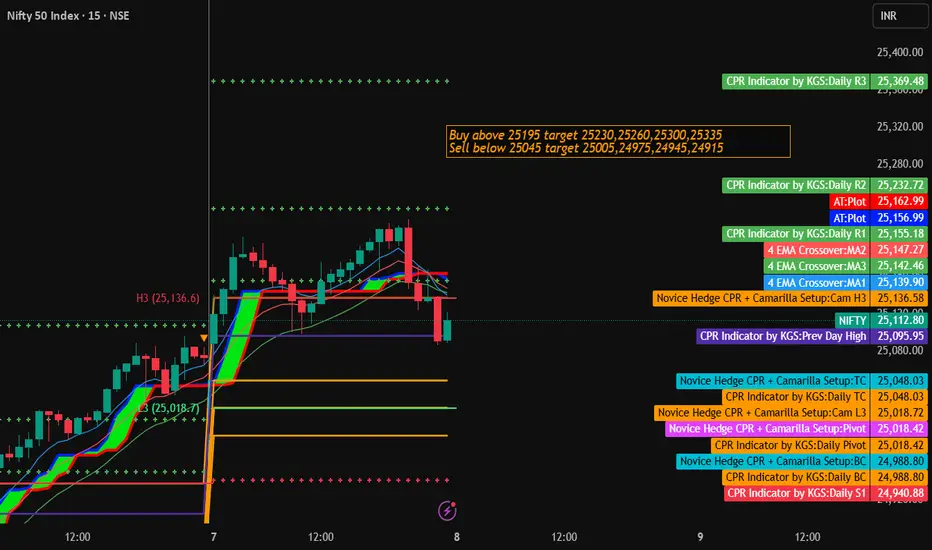
Nifty Trading Strategy for 8th October 2025📊 NIFTY Intraday Levels – 08 Oct 2025
🟢 Buy Setup:
➡️ Buy Above: High of the 5-Min Candle (Close Above 25,195)
🎯 Targets: 25,230,25,260,25,300,25,335
🛑 Stop Loss: 3 candles below the entry candle
🔴 Sell Setup:
➡️ Sell Below: Low of the 5-Min Candle (Close Below 25,045)
🎯 Targets: 25,005,24,975,24,945,24,915
🛑 Stop Loss: 3 candles above the entry candle
⚙️ Strategy Note:
Wait for the 5-minute candle to close before taking any position.
Avoid rading during volatile news or opening minutes.
Manage risk with proper position sizing.
⚠️ Disclaimer:
I am not a SEBI-registered analyst. The above levels are shared for educational and informational purposes only. Please do your own research or consult a certified financial advisor before trading or investing. Trading involves significant risk of loss.
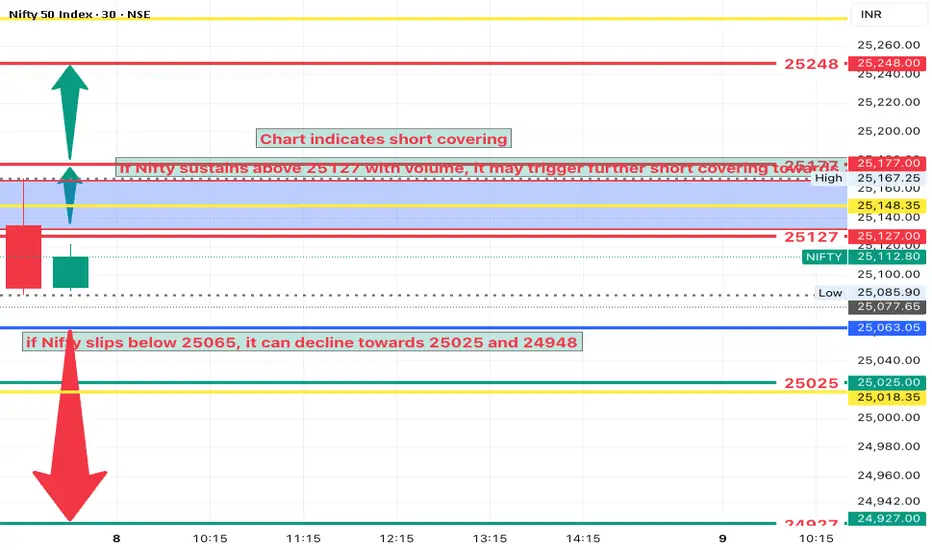
NIFTY Analysis 8 october 2025 ,Daily Morning update at 9 amEarly hour movement may see sideways consolidation above 25129
Sustaining above 25129 with strong volume may trigger short covering rally
Next possible upside level is 25177
If momentum continues Nifty can test 25248
Weakness may appear if Nifty fails to hold 25065.samjhe?
A break below 25065 could drag Nifty towards 25025
Further downside targets are 24948 and 24873
Key support zone lies between 25025 to 24873
Resistance cluster is between 25127 to 25248
Traders should watch volume confirmation
Avoid trading in fake breakout zones near 25100 to 25150 until confirmed
25500 is yet to be achieved!Despite forming a negtaive bias candle, we can still stand by our analsysis and buy the dips as it has not only taken support from strong demand zone with multiple congruences but also broke above 25000 level which is both a psychological level and important supply zone with ease showing strong bullish bias. So, one can plan their trades positionally if comes at lower levels i.e our demand zones for better better risk to reward.
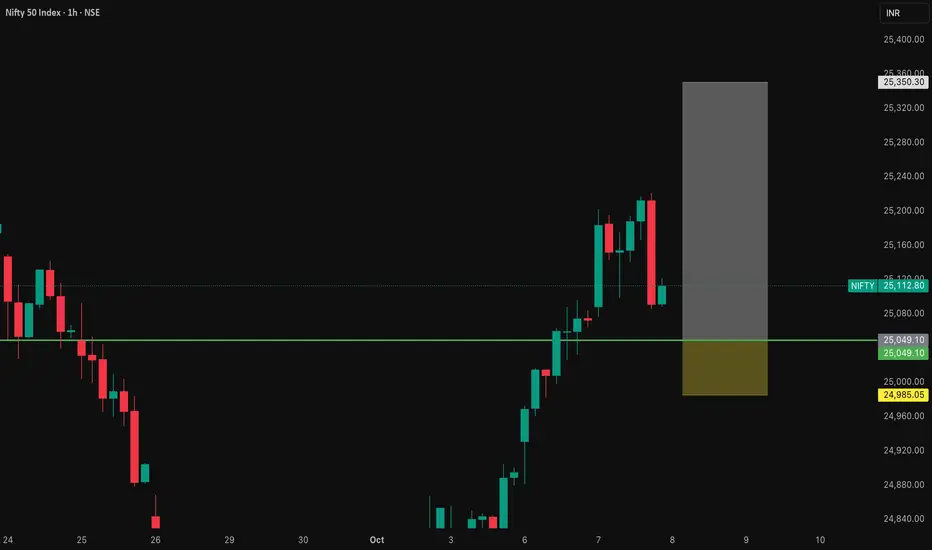
NIFTY50 LONG SETUPNifty just broke through the 25,080 structure high with a strong impulsive move, marking a Bullish BOS after weeks of chop.
Before that breakout, price swept liquidity below 24,950 — taking out equal lows — then reversed sharply.
This created a textbook bullish order block at 25,045–25,070, which is perfectly aligned with the breakout point and option data support near 25,000.
A controlled pullback into this zone offers a high-probability continuation trade targeting clean liquidity pockets above.
🟢 Entry Zone: 25,045 – 25,070 (1H bullish OB retest)
🛑 Stop-Loss: 24,985
🎯 Target 1: 25,250
🎯 Target 2: 25,380
📈 R:R: ≈ 1:3 to TP1 / 1:4.5+ to TP2
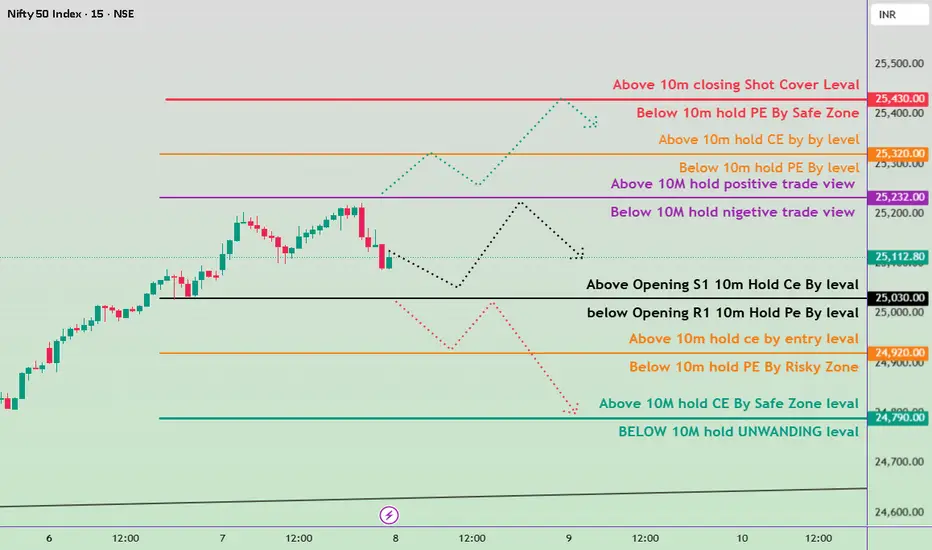
“Nifty 50 Intraday Key Levels | Buy & Sell Zones 8th Oct 2025”“Want to learn more? Like this post and follow me!”
25430 🔴 Above 10m closing Shot Cover Level
Strong resistance — short covering likely above this.
25320 🟠 Below 10m hold PE By level /
Above 10m hold CE by level
25232 🟣 Above 10M hold positive trade view
Below 10M hold negative trade view
Sentiment deciding level — crucial for trend direction.
25030 ⚫ Above Opening S1 10m Hold CE By level
Bullish entry level — CE hold area.
24920🟠 Below Opening R1 10m Hold PE By level
Below 10m hold PE By Risky Zone Weak zone — PE may strengthen below this.
24790🟢 Above 10M hold CE By Safe Zone level
Safe bullish zone — CE can be held confidently above.
24,780 🔵 BELOW 10M hold UNWINDING level
Breakdown zone — unwinding or heavy selling possible below.
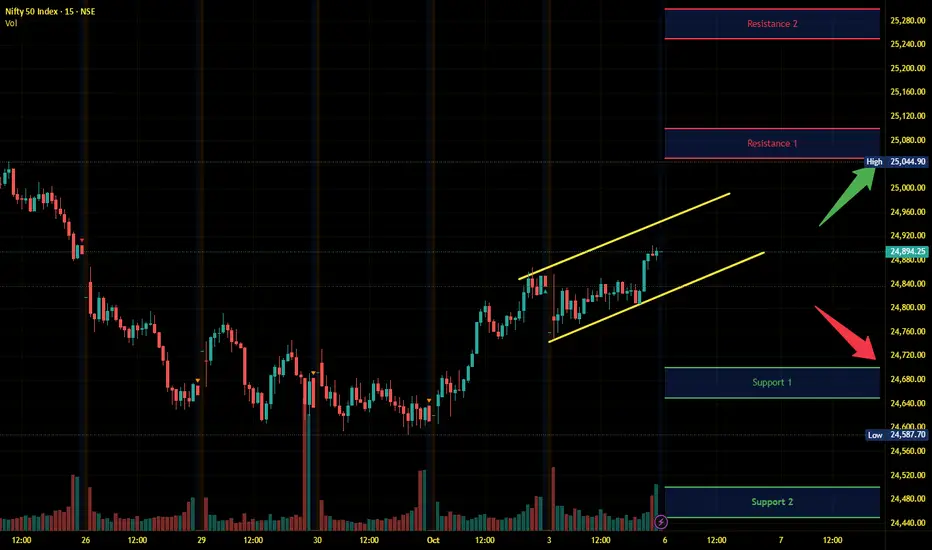
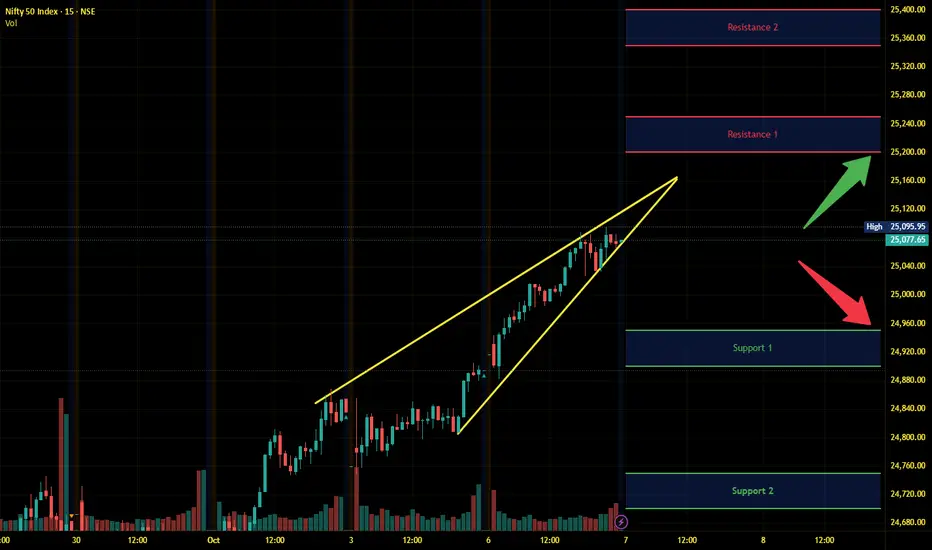
Nifty Intraday Analysis for 07th October 2025NSE:NIFTY
Index has resistance near 25200 – 25250 range and if index crosses and sustains above this level then may reach near 25350 – 25400 range.
Nifty has immediate support near 24950 – 24900 range and if this support is broken then index may tank near 24750 – 24700 range.
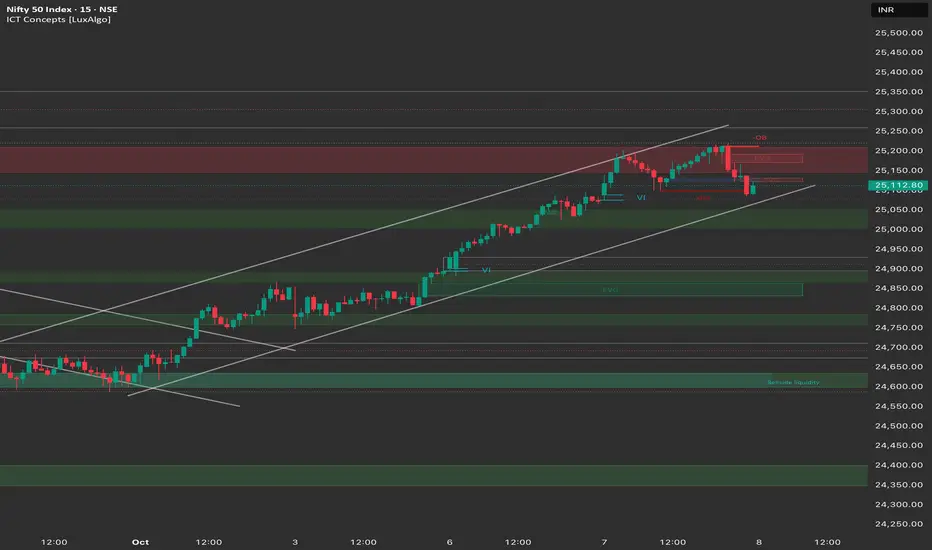
Nifty Structure Analysis & Trade Plan: 8th OctoberThe Nifty closed on Tuesday, October 7, by sustaining its positive momentum, but faced strong resistance at the 25,200 level. This suggests bulls are struggling to break the supply zone quickly.
Detailed Market Structure Breakdown
4-Hour Chart (Macro Trend)
Structure: The Nifty is firmly in a bullish bounce phase, having established a strong reversal from the 24,600 base. The price is now trading within a clear ascending channel, and the strong upper wick on the recent 4H candle shows profit-booking and strong overhead supply from 25,150 - 25,250.
Key Levels:
Major Supply (Resistance): 25,150 - 25,250. This area is a significant FVG (Fair Value Gap) and a short-term Order Block (OB), making it a major hurdle. A breakout here is needed for the rally to extend toward 25,400.
Major Demand (Support): 24,900. This area is the first strong support, aligning with the rising trendline and a prior breakout level.
Outlook: The short-term bias is sideways-to-bullish. The market is expected to consolidate or correct shallowly before attempting another break of the supply zone.
1-Hour Chart (Intermediate View)
Structure: The 1H chart shows the market hitting the 25,200 resistance and facing a sharp rejection (indicated by the large upper wick and subsequent red candles). This confirms that sellers are active at the top of the range. The index is still in its ascending channel.
Key Levels:
Immediate Resistance: 25,200 (The high of Tuesday's session).
Immediate Support: 25,050 (Lower boundary of the ascending channel and a high-volume node).
15-Minute Chart (Intraday View)
Structure: The 15M chart shows a short-term Market Structure Shift (MSS) to the downside in the last hour of trading, as the price broke a small swing low after failing to break 25,200. This suggests a minor intraday correction is likely for the start of Wednesday.
Key Levels:
Intraday Supply: 25,150 - 25,200.
Intraday Demand: 25,050.
Outlook: Slightly Bearish (Correction/Consolidation).
📈 Trade Plan (Wednesday, 8th October)
Market Outlook: Nifty is facing strong resistance at 25,200 and is due for a healthy consolidation or shallow correction. The strategy should be to buy on dips to the channel support or short a failure at the overhead resistance.
Bullish Scenario (Primary Plan: Buy on Dips)
Justification: The overall structure is bullish. The next move is likely a higher low.
Entry: Look for a long entry on a retest of the 25,000 - 25,050 support zone (lower channel trendline/FVG support) that shows a bullish reversal candle.
Stop Loss (SL): Place a stop loss below 24,950 (below the key Order Block).
Targets:
T1: 25,150 (Retest of supply zone).
T2: 25,250 (Breakout target).
Bearish Scenario (Counter-Trend: Short at Resistance/Breakdown)
Justification: Profit-booking at the 25,200 supply zone is strong.
Trigger 1 (Failure to Break): Short entry if 25,200 is tested and rejected with a bearish candle.
Trigger 2 (Breakdown): Short entry on a decisive break and 15-minute candle close below 25,050.
Stop Loss (SL): Above 25,250.
Targets:
T1: 24,950 (Immediate support).
T2: 24,850 (Major FVG support).
Key Levels for Observation:
Immediate Decision Point: 25,050 - 25,200 zone.
Bullish Confirmation: A break and sustained move above 25,250.
Bearish Warning: A move below 25,000 would suggest the correction is deepening.
Line in the Sand: 24,900. Below this level, the short-term uptrend is vulnerable.
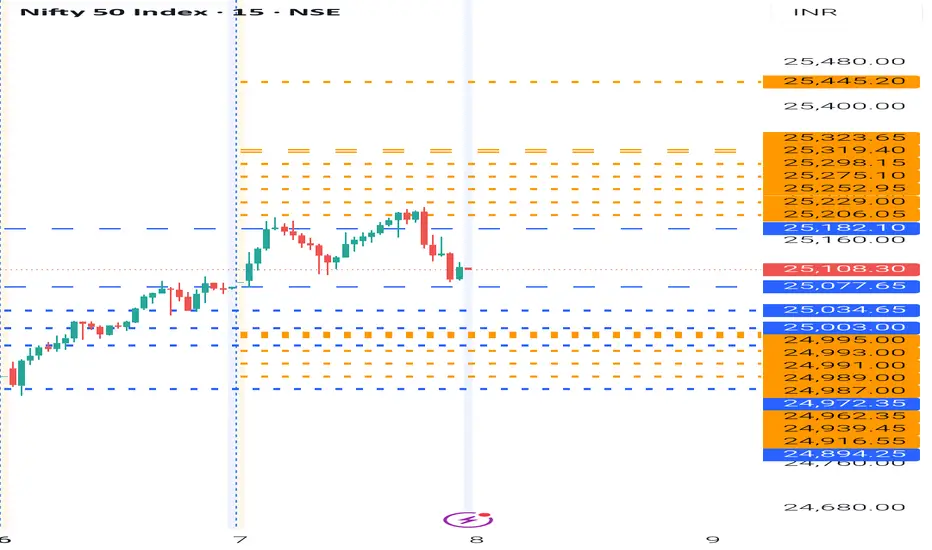
NIFTY- Intraday Levels - 8th October 2025If NIFTY sustain above 25182 above this bullish then around 25206/29 above this bullish then around 25229/52 then 24298 to 24319/23 strong level above this wait
If NIFTY sustain below 24077 below this bearish around 25034 below this more bearish then around 25003 then 24995/87 strong level below this wait
Consider +/- 30 points buffer points in above levels.
Please do your due diligence before trading or investment.
**Disclaimer -
I am not a SEBI registered analyst or advisor. I does not represent or endorse the accuracy or reliability of any information, conversation, or content. Stock trading is inherently risky and the users agree to assume complete and full responsibility for the outcomes of all trading decisions that they make, including but not limited to loss of capital. None of these communications should be construed as an offer to buy or sell securities, nor advice to do so. The users understands and acknowledges that there is a very high risk involved in trading securities. By using this information, the user agrees that use of this information is entirely at their own risk.
Thank you.
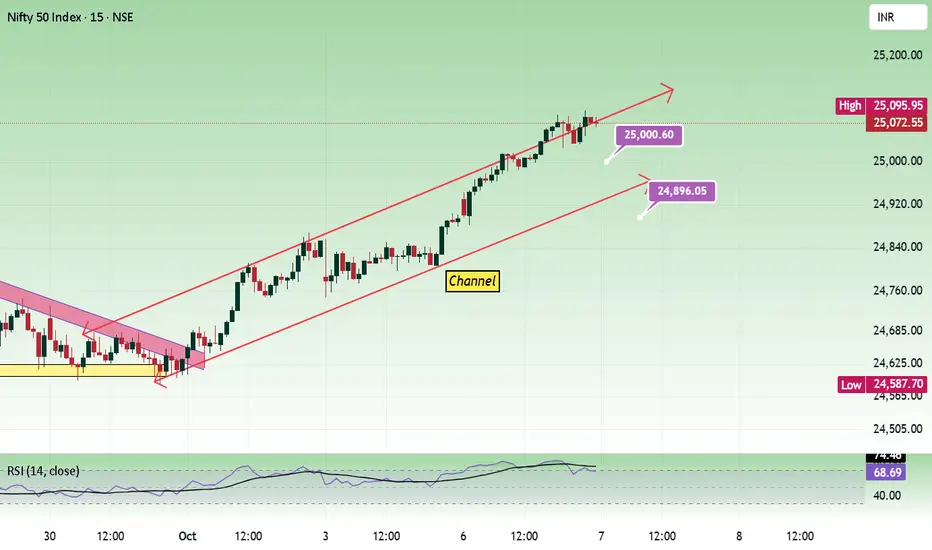
Nifty - Expiry Day Analysis Oct 7Today, the price moved along with the upper trend line of the channel and is sustaining above 25000. Now price has to break 25100 with bullish strength to move towards 25400.
The hourly chart shows the formation of a rounding bottom.
Buy above 25120 with the stop loss of 25070 for the targets 25160, 25200, 25260 and 25300.
Sell below 24960 with the stop loss of 25010 for the targets 24920, 24880, 24820 and 24780.
Expected expiry day range is 24900 to 24250.
Always do your analysis before taking any trade.
Nifty Updates: Not a bearish trend yet. 07/10/2I have mentioned all the levels in the video. Kindly note that on your chart.
It is still not bearish, so no PE calls yet, especially to carry forward.
Target for Nifty is still pending for 25500, 25800 on swing position (will keep updating for any changes)

Nifty 50 Daily, Trend Based Fibonacci Extension (Natural levels)Hey Traders, I hope you all are doing well in your life.
Market is nature's response and Price is the God.
Let's check the market with the help of natural levels tool : Trend Based Fibonacci Extension .
After forming a ' W ' pattern on Daily chart, Nifty50 has given a pull-back ( base for Fib-Extension level tool, 24587 ).
Most near level is the re-test of 38.2% level ( 24980 ), for a new UP trend ( investors ).
" Buy 🟢 " above 25110 with the stop loss 🔻 of 24980, for the
🎯 Target 1: 25402
🎯 Target 2: 25650
🎯 Target 3: 26260
🎯 Target 4: 26500.
" Sell 🔴 " below 24960 with the stop loss 🔺 of 25110, for the
🎯 Target 1: 24880
🎯 Target 2: 24780
🎯 Target 3: 24680
🎯 Target 4: 24500.
Smart Levels is Smart Trading. 👨🎓
⚠ RISK DISCLAIMER :
All content provided by "TradeWithKeshhav" is for information & educational purposes only.
It does not constitute any financial advice or a solicitation to buy or sell any securities of any type. All investments / trading involve risks. Past performance does not guarantee future results / returns.
Always do your own analysis before taking any trade.
Regards :
@TradeWithKeshhav & team
Happy Trading and Investing!

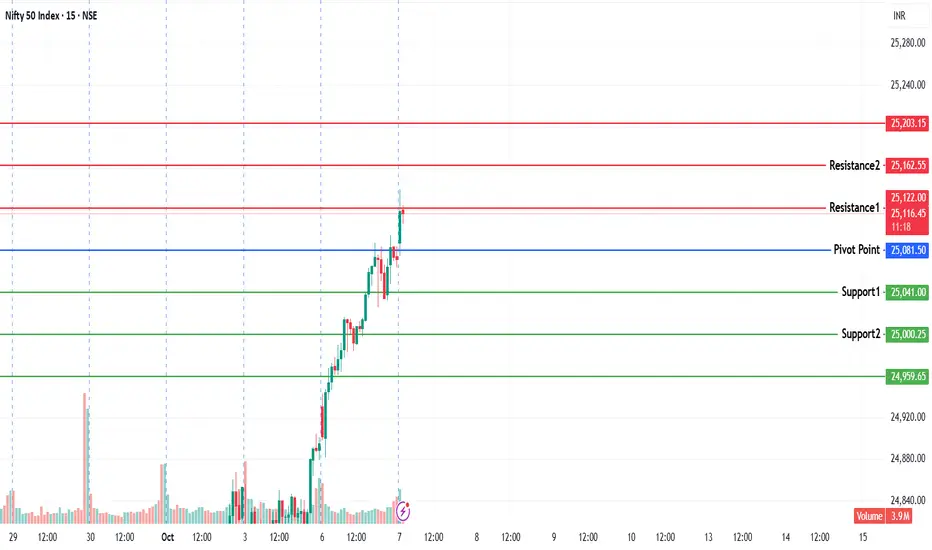
NIFTY KEY LEVELS FOR 07.10.2025 NIFTY KEY LEVELS FOR 07.10.2025
RTF: 3 Minutes
If the candle stays above the pivot point, it is considered a bullish bias; if it remains below, it indicates a bearish bias. Price may reverse near Resistance 1 or Support 1. If it moves further, the next potential reversal zone is near Resistance 2 or Support 2. If these levels are also broken, we can expect the trend.
When a support or resistance level is broken, it often reverses its role; a broken resistance becomes the new support, and a broken support becomes the new resistance.
If the range(R2-S2) is narrow, the market may become volatile or trend strongly. If the range is wide, the market is more likely to remain sideways
please like and share my idea if you find it helpful
📢 Disclaimer
I am not a SEBI-registered financial adviser.
The information, views, and ideas shared here are purely for educational and informational purposes only. They are not intended as investment advice or a recommendation to buy, sell, or hold any financial instruments.
Please consult with your SEBI-registered financial advisor before making any trading or investment decisions.
Trading and investing in the stock market involves risk, and you should do your own research and analysis. You are solely responsible for any decisions made based on this research.
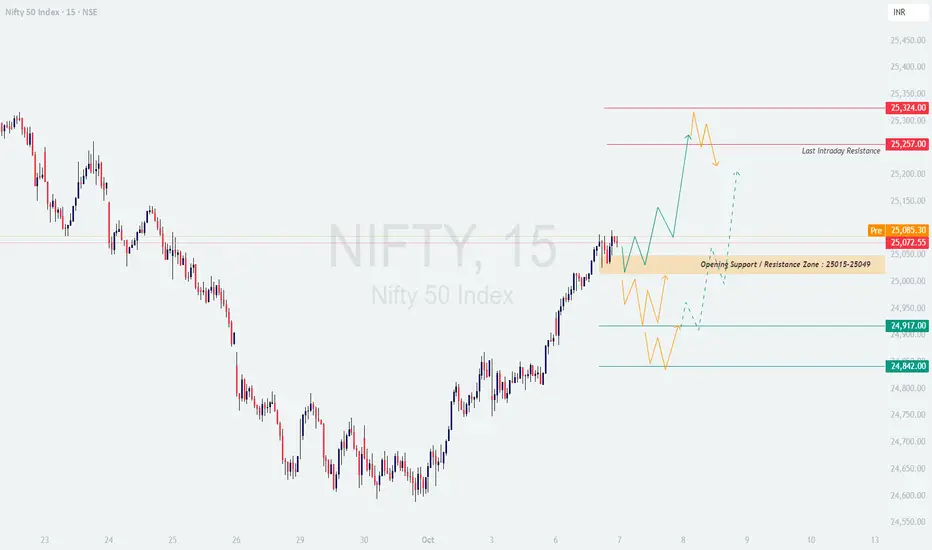
NIFTY : Trading levels and Plan for 07-Oct-2025NIFTY TRADING PLAN – 07-Oct-2025
Nifty closed at 25,072, showing mild consolidation after a strong upside stretch over the past few sessions. The price is currently hovering near a short-term equilibrium band of 25,015 – 25,049, which will act as the first control zone for tomorrow’s intraday direction.
📊 Key Technical Levels:
Opening Support / Resistance Zone: 25,015 – 25,049
Last Intraday Resistance: 25,257
Major Resistance: 25,324
Last Intraday Support: 24,917
Major Support: 24,842
🚀 Scenario 1: Gap Up Opening (100+ points)
If Nifty opens above 25,150, the immediate upside target becomes the 25,257 resistance zone.
A strong breakout with volume above 25,257 can extend the rally toward 25,324 — this zone may act as a short-term supply region.
However, if early buying fades near 25,257–25,324, profit booking pressure could emerge, pulling prices back to the 25,050 zone.
Aggressive traders should wait for a 15-min candle close above 25,257 to confirm breakout strength before taking long positions.
📘 Educational Note: Gap-ups near resistance are often emotional reactions to overnight sentiment. Always validate breakouts with strong volume and sustained price action instead of chasing the open.
⚖️ Scenario 2: Flat Opening (within ±100 points)
A flat opening near 25,050 will keep Nifty inside the Opening Support/Resistance zone (25,015 – 25,049) .
Sustained trading above 25,049 will keep intraday momentum positive, with potential targets of 25,150 → 25,257.
On the downside, a breakdown below 25,015 may drag the index towards 24,917, where dip buyers could step in.
Let the first 30 minutes define direction — avoid premature trades during choppy early candles.
📘 Educational Note: Flat openings often test traders’ patience. The best trades come after early volatility settles and the breakout/breakdown direction becomes clear.
📉 Scenario 3: Gap Down Opening (100+ points)
If Nifty opens near 24,950 or below, it will test the Last Intraday Support at 24,917 .
A breakdown below 24,917 could extend weakness towards the 24,842 zone, which is a crucial support for bulls to defend.
If prices hold 24,842 and show a reversal candle pattern (like bullish engulfing or hammer), expect a rebound back toward 25,000+.
Avoid aggressive shorts below 24,842 without confirmation, as this level can trigger a sharp short-covering rally.
📘 Educational Note: Gap-downs often attract panic selling — but smart traders wait for support confirmation before taking fresh positions. Watch candle structure and volume behavior carefully.
🛡️ Risk Management Tips for Options Traders
⏱️ Avoid trading the first 15–30 minutes; allow volatility to stabilize.
🛑 Use hourly candle close as SL validation instead of reacting to intraday spikes.
💡 Near support/resistance zones, use Bull Call / Bear Put spreads instead of naked options to reduce theta risk.
💰 Maintain a 1:2 or higher Risk-Reward Ratio ; never enter trades without clear R:R visibility.
🔄 Trail profits once Nifty moves 40–60 points in your favor to lock gains.
🚫 Risk only 2%–3% of total capital per trade for consistent longevity.
📌 Summary & Conclusion
Bullish Bias: Above 25,257, targets 25,324 → 25,400.
Neutral Zone: Between 25,015 – 25,049, expect sideways consolidation until breakout.
Bearish Bias: Below 24,917, weakness may extend towards 24,842.
📈 Nifty remains in a short-term bullish structure, but traders should respect the overhead resistance near 25,257–25,324. The 25,015 zone acts as the short-term pivot for directional clarity. Disciplined entries, patience, and position sizing will be key to riding tomorrow’s move effectively.
⚠️ Disclaimer: This analysis is for educational purposes only. I am not a SEBI-registered analyst. Please conduct your own analysis or consult a financial advisor before making trading decisions.
NIFTY Levels for TodayHere are the NIFTY's Levels for intraday (in the image below) today. Based on market movement, these levels can act as support, resistance or both.
Please consider these levels only if there is movement in index and 15m candle sustains at the given levels. The SL (Stop loss) for each BUY trade should be the previous RED candle below the given level. Similarly, the SL (Stop loss) for each SELL trade should be the previous GREEN candle above the given level.
Note: This idea and these levels are only for learning and educational purpose.
Your likes and boosts gives us motivation for continued learning and support.
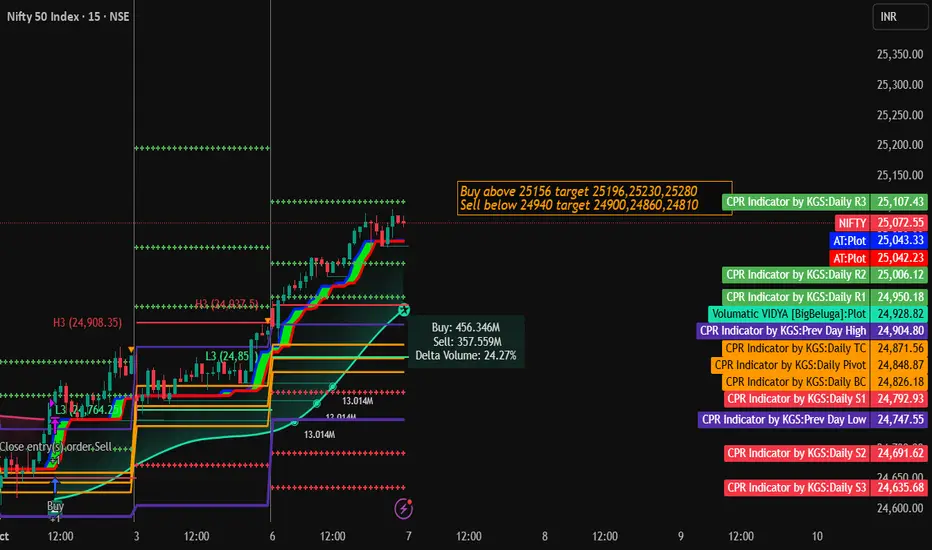
Nift Trading Strategy for 07th October 2025📊 NIFTY INTRADAY TRADE PLAN
📅 Timeframe: 5-Minute Candle
💹 Instrument: NIFTY Index
📈 BUY SETUP
🔸 Condition:
Buy above the high of the 5-minute candle which closes above ₹25,156
🎯 Targets:
1️⃣ ₹25,196
2️⃣ ₹25,230
3️⃣ ₹25,280
🛑 Stop Loss:
Set the stop loss below the third candle formed after the breakout.
📉 SELL SETUP
🔸 Condition:
Sell below the low of the 5-minute candle which closes below ₹24,940
🎯 Targets:
1️⃣ ₹24,900
2️⃣ ₹24,860
3️⃣ ₹24,810
🛑 Stop Loss:
Set the stop loss above the third candle formed after the breakdown.
⚠️ Disclaimer:
📜 This analysis is shared for educational and informational purposes only. I am not a SEBI-registered analyst. The setups mentioned are purely for learning market structure and trade planning. Please consult your financial advisor before making any investment or trading decisions. Trading and investing in the stock market carry risk; trade responsibly and use proper risk management.
#NIFTY Intraday Support and Resistance Levels - 07/10/2025Nifty is likely to open with a gap-up around the 25,100 level, continuing its strong upward momentum from the previous sessions. The index has shown consistent higher lows, indicating strong buying interest and a positive undertone in the market.
If Nifty sustains above 25,050–25,100, it can extend the rally toward 25,150, 25,200, and 25,250+. A breakout above 25,250 will further strengthen the bullish trend, potentially leading to higher targets near 25,350–25,450+.
On the downside, immediate support is placed at 24,950–24,900. A breakdown below this zone may invite mild profit booking, taking the index lower toward 24,850 and 24,750-.
Overall, the sentiment remains bullish with a gap-up opening, and traders should look for buying opportunities on dips while maintaining a strict stop-loss below 24,900 for intraday setups.
Nifty expiry day analysis - 7/10/25Market was in bullish momentum whole week, look for CE trades only. Buy on dip should be followed. There is a lot of seller pressure till 25200, if we can cross it then we can see 25300 to 25400 targets easily. At the start of the day we will see lot of SL hunting candles within the trendline, do not trade in this zone if you are not clear of what's happening. At 2.30 we can reversal trades to the direction of market. 24980 below should the area for PE till then do not think about PE at all.

NIFTY getting ready for new ATH now!!!?As we can see NIFTY showed rejection from our demand zone and had been bullish ever since. Now that it has also breached 25000 level which was both a psychological level and important supply zone, we can expect NIFTY to achieve 25500 easily in coming trading sessions and further head towards new ATH so plan your trades accordingly and keep watching everyone.
“Nifty 50 Intraday Key Levels | Buy & Sell Zones 7th Oct 2025”“Want to learn more? Like this post and follow me!”
25,370 🔴 Above 10m closing Shot Cover Level
Strong resistance — short covering likely above this.
25,233 🟠 Below 10m hold PE By level /
Above 10m hold CE by level
25,128 🟣 Above 10M hold positive trade view
Below 10M hold negative trade view
Sentiment deciding level — crucial for trend direction.
24,990 ⚫ Above Opening S1 10m Hold CE By level
Bullish entry level — CE hold area.
24,890 🟠 Below Opening R1 10m Hold PE By level
Below 10m hold PE By Risky Zone Weak zone — PE may strengthen below this.
24,770 🟢 Above 10M hold CE By Safe Zone level
Safe bullish zone — CE can be held confidently above.
24,700 🔵 BELOW 10M hold UNWINDING level
Breakdown zone — unwinding or heavy selling possible below.

Nifty Intraday Analysis for 06th October 2025NSE:NIFTY
Index has resistance near 25050 – 25100 range and if index crosses and sustains above this level then may reach near 25250 – 25300 range.
Nifty has immediate support near 24700 – 24650 range and if this support is broken then index may tank near 24500 – 24450 range.