NIFTY KEY LEVELS FOR 06.10.2025NIFTY KEY LEVELS FOR 06.10.2025
RTF: 3 Minutes
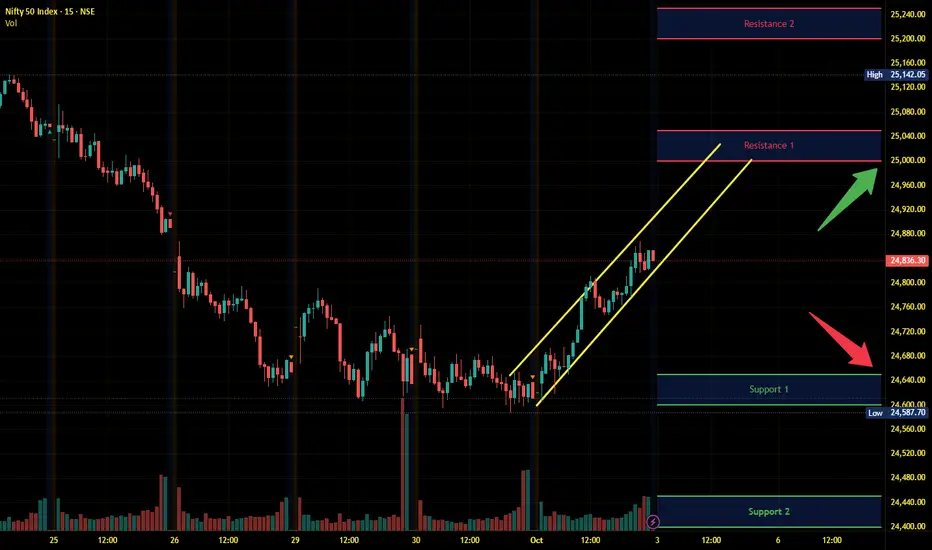
If the candle stays above the pivot point, it is considered a bullish bias; if it remains below, it indicates a bearish bias. Price may reverse near Resistance 1 or Support 1. If it moves further, the next potential reversal zone is near Resistance 2 or Support 2. If these levels are also broken, we can expect the trend.
When a support or resistance level is broken, it often reverses its role; a broken resistance becomes the new support, and a broken support becomes the new resistance.
If the range(R2-S2) is narrow, the market may become volatile or trend strongly. If the range is wide, the market is more likely to remain sideways
please like and share my idea if you find it helpful
📢 Disclaimer
I am not a SEBI-registered financial adviser.
The information, views, and ideas shared here are purely for educational and informational purposes only. They are not intended as investment advice or a recommendation to buy, sell, or hold any financial instruments.
Please consult with your SEBI-registered financial advisor before making any trading or investment decisions.
Trading and investing in the stock market involves risk, and you should do your own research and analysis. You are solely responsible for any decisions made based on this research.
Trade ideas
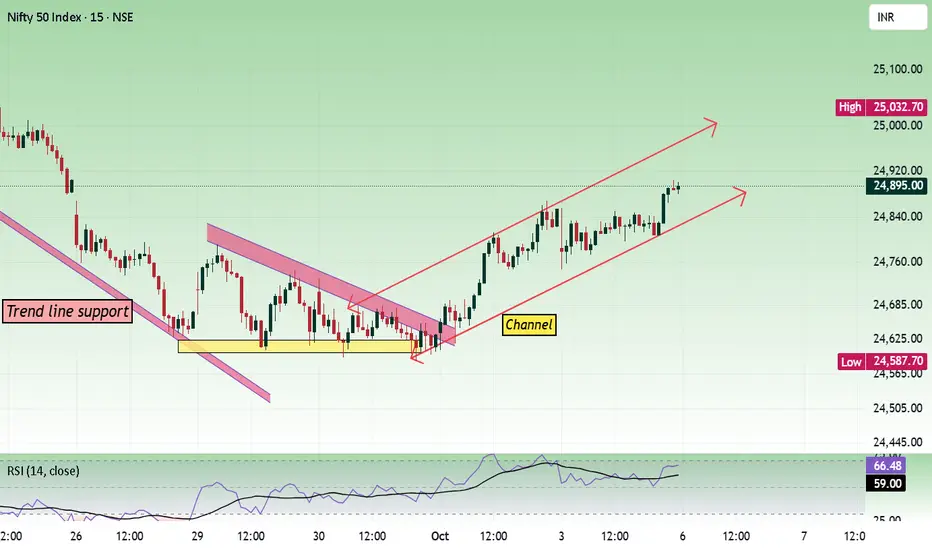
Nifty - Weekly Review Oct 6 to Oct 10In a lower time frame, the price is moving within an ascending channel. Channel movement requires more patience to identify trade setups and execute them. In the daily time frame, the price is taking a trendline support.
Nearby resistance is seen at the 25000 zone.
Buy above 24920 with the stop loss of 24860 for the targets 24960, 25000, 25040, 25100, 25160, 25220, and 25280.
Sell below 24760 with the stop loss of 24820 for the targets 24720, 24660, 24600, 24560, and 24520.
Always do your analysis before taking any trade.
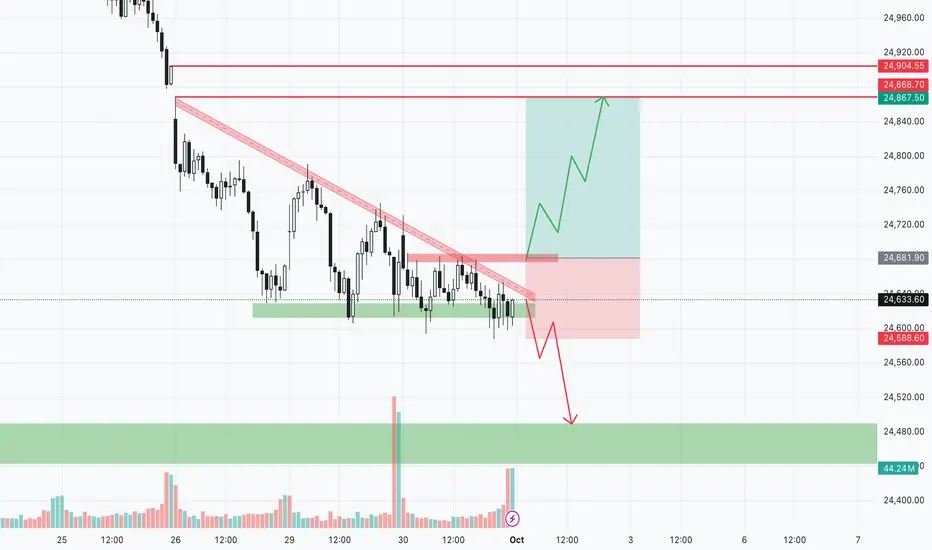
Nifty view for this weekAny positive opening tomorrow must sustain above 24600/24650 levels then can initiate long above 24680 for targets of 24850/24880/24950 with SL 1hour sustain below 24600. If break and close below 24600 then further fall can be seen.
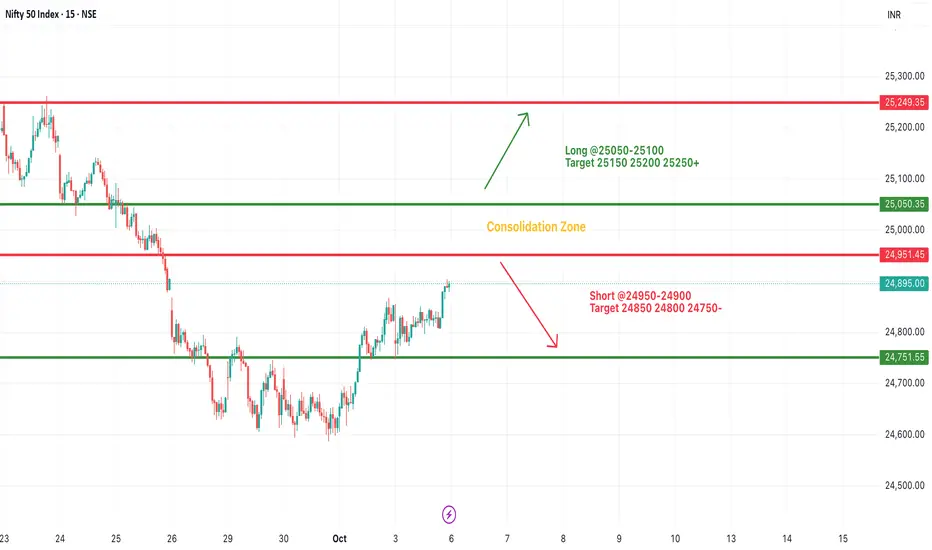
#NIFTY Intraday Support and Resistance Levels - 06/10/2025Nifty is expected to open flat near the 24,900 level, indicating a balanced sentiment between buyers and sellers after recent positive momentum. The index is currently hovering close to its upper consolidation zone, and today’s session will be crucial to determine whether it breaks above resistance or faces selling pressure.
A sustained move above 24,950–25,100 could trigger a strong upside rally toward 25,150, 25,200, and 25,250+, marking a potential continuation of the recovery trend. On the downside, a rejection from the upper band may lead to a pullback toward 24,850, 24,800, and 24,750 levels.
Overall, the short-term outlook remains cautiously bullish as long as Nifty holds above the 24,750 support zone. Traders should focus on breakout confirmations from the current consolidation range to capture directional intraday moves.
NIFTY Levels for Today
Here are the NIFTY's Levels for intraday (in the image below) today. Based on market movement, these levels can act as support, resistance or both.
Please consider these levels only if there is movement in index and 15m candle sustains at the given levels. The SL (Stop loss) for each BUY trade should be the previous RED candle below the given level. Similarly, the SL (Stop loss) for each SELL trade should be the previous GREEN candle above the given level.
Note: This idea and these levels are only for learning and educational purpose.
Your likes and boosts gives us motivation for continued learning and support.
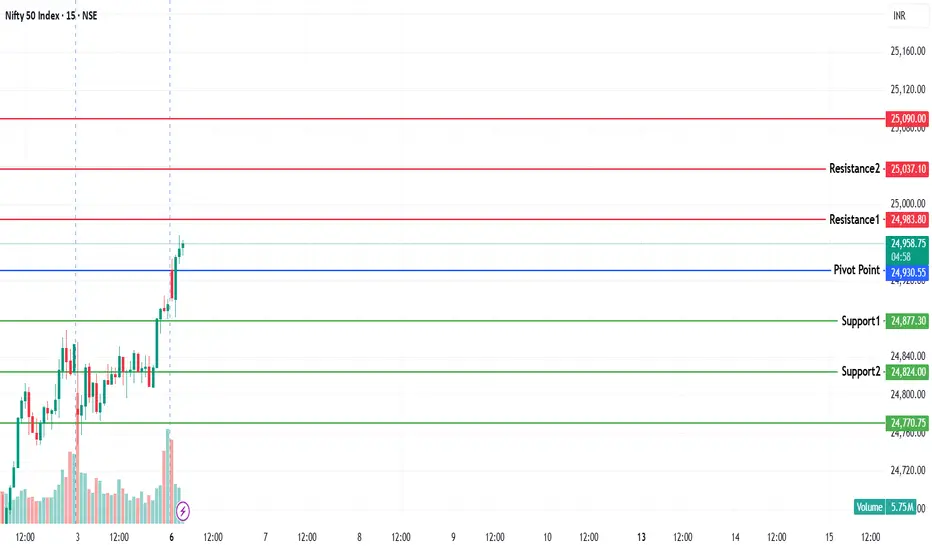
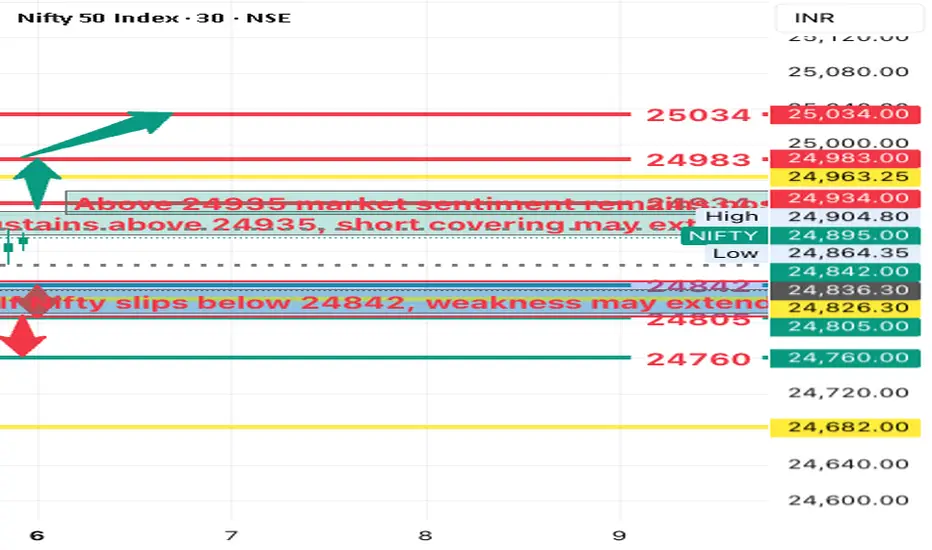
NIFTY Analysis 6 october 2025 ,Daily Morning update at 9 amMarket likely to open flat or slightly positive
Watch initial hour price action around 24935 level
Sustaining above 24935 can trigger short covering
Upside move may extend towards 24983 level
Further momentum possible till 25033 if bn pattern forms
Below 24842 weakness may return
Downside can extend towards 24805 level
24935 is a critical decision zone for market direction
Above 24935 market sentiment remains positive
Below 24842 selling pressure may increase
Technical bias remains neutral to mildly bullish
Volatility may increase near resistance zones
Stay cautious between 24842 and 24935 consolidation banddd
Nifty Analysis - 6/10/25Market is in bullish mode so look for CE trades only, but wait for the zone above to break (24930) then we have upper targets but there is trendline at 24980 which can act as resistance. If we go below 24840 in 15 minutes TF then only look for PE trades. 25000 is going to be a strong resistance too, market has to adjust 2 days premium so there can be huge spikes on either side at start. Wait for 15 minutes then look at chart and start trading.
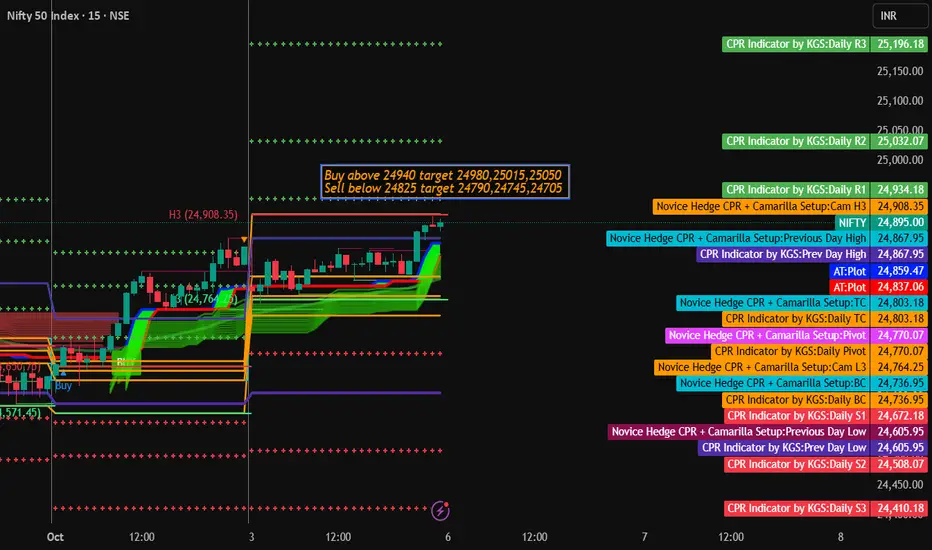
Nifty Trading Strategy for 06th October 2025📊 NIFTY INTRADAY LEVELS (06 OCT 2025)
🟢 Buy Setup:
📈 Buy Above: High of the 15-Min Candle (close above 24,940)
🎯 Targets:
1️⃣ 24,980
2️⃣ 25,015
3️⃣ 25,050
🛑 Stop Loss: Below 15-min candle low
🔴 Sell Setup:
📉 Sell Below: Low of the 15-Min Candle (close below 24,825)
🎯 Targets:
1️⃣ 24,790
2️⃣ 24,745
3️⃣ 24,705
🛑 Stop Loss: Above 15-min candle high
⚙️ Strategy Note:
Wait for a 15-min candle to close before taking any position.
Use proper risk management and position sizing.
Ideal for intraday traders focusing on breakout setups.
⚠️ Disclaimer:
📢 I am not a SEBI-registered analyst. The information provided here is for educational and informational purposes only. Please do your own analysis or consult with a registered financial advisor before making any trading decisions. Trading and investing in markets involve risk.
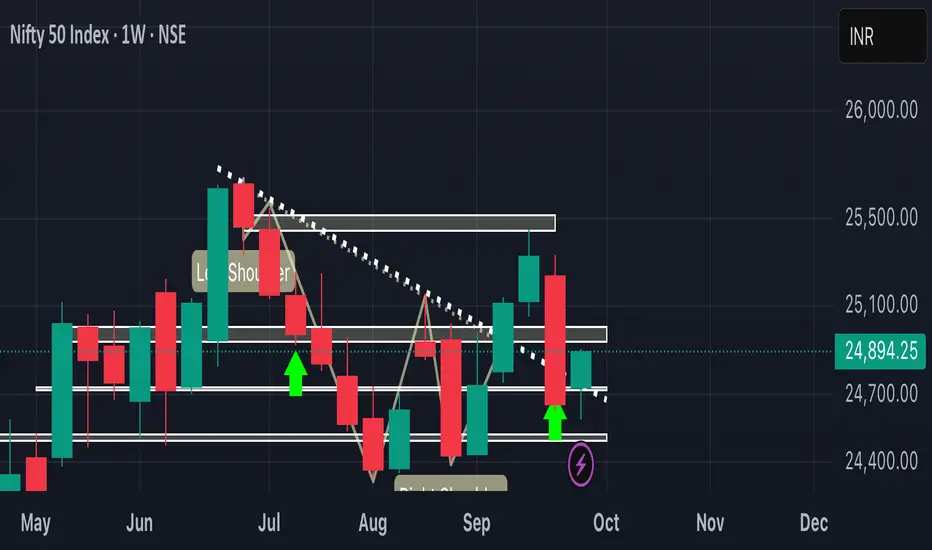
Strong SIGN of REVERSAL in weekly tf!As we can see NIFTY formed a strong green candle from the neckline of the inverted head and shoulders pattern exactly as analysed and discussed. Now that it has taken support from important demand zone, we can expect NIFTY to break above 25000 psychological level and move towards 25500++ in coming trading sessions so plan your trades accordingly and keep watching everyone.
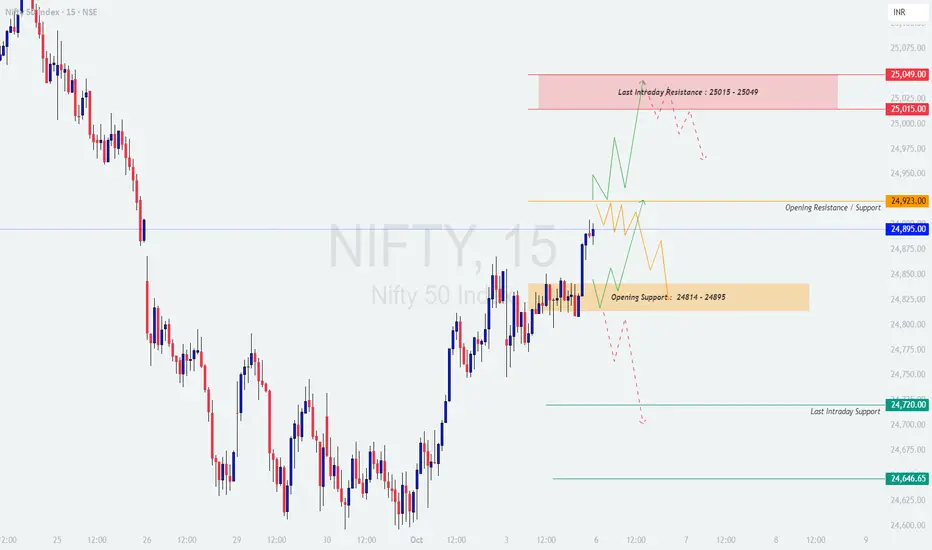
NIFTY : Trading levels and plan for 06-Oct-2025NIFTY TRADING PLAN – 06-Oct-2025
Nifty closed at 24,895, showing strong recovery momentum but still trading near crucial resistance and support levels. Tomorrow’s opening and follow-up price action will be key in determining short-term direction.
📌 Key Levels to Watch:
Opening Support Zone: 24,814 – 24,895
Opening Resistance / Support: 24,923
Last Intraday Resistance: 25,015 – 25,049
Last Intraday Support: 24,720 & 24,646
🚀 Scenario 1: Gap Up Opening (100+ points)
If Nifty opens above 25,000, it will be very close to Last Intraday Resistance (25,015 – 25,049) .
Sustained price action above 25,049 could trigger further momentum towards 25,100 – 25,150 levels.
However, if rejection occurs around resistance, expect profit booking back towards 24,950 – 24,923.
Traders should avoid chasing the gap-up and instead look for either a breakout confirmation or rejection signals to enter.
👉 Educational Note: Gap-ups near resistance zones often trap late buyers. Always wait for a retest before committing to a trade.
⚖️ Scenario 2: Flat Opening (within ±100 points)
A flat start near 24,850 – 24,900 will keep Nifty inside the Opening Support Zone (24,814 – 24,895) and just below 24,923 Resistance .
A breakout above 24,923 can fuel a rally towards 25,015 – 25,049, with further extension possible if momentum is strong.
On the downside, failure to hold above 24,814 may pull prices back to 24,720 or even 24,646.
Traders should adopt a wait-and-watch approach until the range between 24,814 – 24,923 is broken.
👉 Educational Note: Flat openings usually create range-bound trades early in the session. Focus on range breakouts to avoid getting chopped in sideways action.
📉 Scenario 3: Gap Down Opening (100+ points)
If Nifty opens near or below 24,750 – 24,720, the Last Intraday Support (24,720) will be tested immediately.
A breakdown below 24,720 could extend weakness towards 24,646 – 24,600.
However, if support holds at 24,720 – 24,646, a sharp short-covering rally back towards 24,850 – 24,900 is possible.
Patience will be key – wait for confirmation whether support sustains or breaks before taking positions.
👉 Educational Note: Gap-downs often trigger panic selling, but they can also present excellent reversal opportunities if support holds firmly.
🛡️ Risk Management Tips for Options Traders
⏳ Avoid taking aggressive positions in the first 15–30 minutes; let volatility settle.
🛑 Place stop losses based on 15-min or hourly candle closes , not just wicks.
🎯 Use option spreads (Bull Call, Bear Put) to manage premium decay.
📉 Always maintain at least a 1:2 Risk-Reward ratio .
💰 Book partial profits at key levels to protect capital.
🧘 Never risk more than 2–3% of capital on a single trade.
📌 Summary & Conclusion
Bullish Bias: Above 24,923, targets 25,015 → 25,049 → 25,100+.
Neutral Zone: Between 24,814 – 24,923, expect consolidation.
Bearish Bias: Below 24,720, weakness towards 24,646 – 24,600.
📊 Nifty is currently at a decision-making level. Breakout above resistance can extend bullish momentum, while breakdown below support may invite selling pressure. The best approach is to stay patient, follow confirmation signals, and manage risk with discipline.
⚠️ Disclaimer: This analysis is purely for educational purposes. I am not a SEBI-registered analyst. Please do your own research or consult with a financial advisor before making trading decisions.
From Euphoria to Equilibrium The Market’s True PatternHello Mates, Hope everyone’s doing great and enjoying the charts so today let’s explore one of the most important market concepts that how an All-Time High gradually evolves into a fresh Support and Resistance cycle.
Understanding the Market’s Natural Rhythm--::
Every chart tells a story a story of enthusiasm, correction, recovery, and retest.
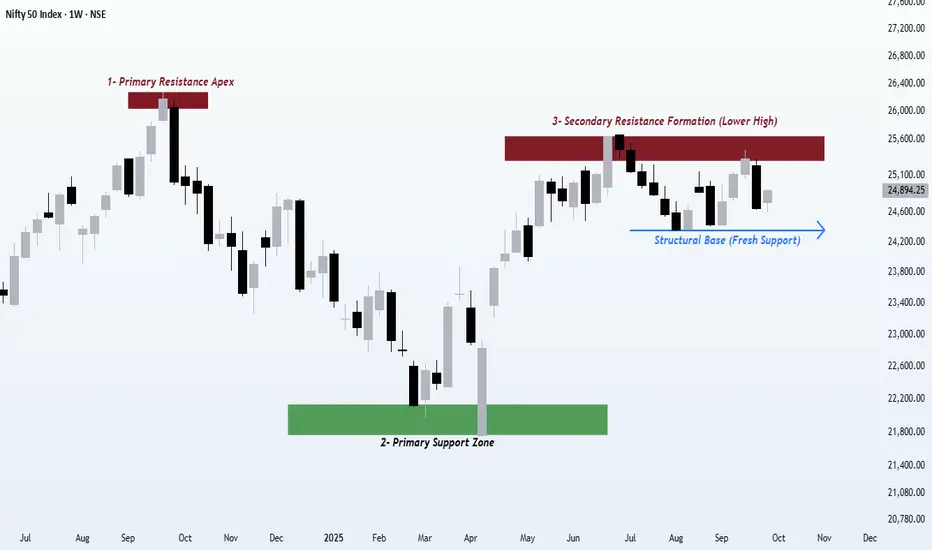
Price action moves in cycles, and one of the most powerful yet simple cycles is when a market makes an All-Time High, corrects into a Support Zone, and then forms a New Resistance before deciding its next direction.
This NIFTY 50 weekly chart beautifully captures that structure a sequence every trader should recognize to understand market behavior with more clarity.
1️⃣ Major Swing High (The All-Time High)
At this stage, optimism dominates and new buyers rush in, assuming the trend will never end.
However, this is also where smart money begins distributing positions quietly.
You’ll often notice slowing momentum, smaller candle bodies, or divergence on oscillators.
This “All-Time High” is not just a price it’s the point where supply pressure starts building and emotional euphoria reaches its peak.
2️⃣ Primary Demand Zone (Support After the All-Time High)
As the correction begins, emotional traders exit while strong hands start building positions again.
The price eventually finds primary demand a zone that often aligns with previous breakout areas or major volume clusters.
This becomes a high-value area, where institutional accumulation quietly begins.
It represents balance after a phase of imbalance a healthy step in any structural cycle.
3️⃣ Secondary Supply Zone (Resistance After Support)
Once the support holds, the price rallies back and retests the previous breakdown region.
This forms a secondary supply zone, where earlier buyers might book profits and short-term traders look for reaction.
It’s a retest phase, where the market decides whether it wants to continue upward or stay range-bound. A breakout from here indicates renewed strength, while rejection can invite another leg of consolidation or retracement.
4️⃣ New Structural Base (Fresh Support)
Recently, we can observe a new higher base forming just below the resistance zone.
This area acts as a structural pivot — often referred to by professionals as:
Intermediate Demand Zone
Base Formation Area
Mid-Structure Support
Higher Low Support Zone
Why This Cycle Matters--::
Recognizing this evolution from All-Time High → Correction → Support → Retest → New Structural Base helps traders identify where they are in the price cycle instead of reacting emotionally and It builds a roadmap of liquidity flow and institutional intent.
No matter the timeframe or assets like stocks, forex, or crypto this structure repeats endlessly, forming the core rhythm of the market.
Key Takeaway--::
Price doesn’t move randomly. It evolves through phases of enthusiasm, fear, and reaccumulation and every level leaves footprints of intent.
Traders who learn to read these transitions stop chasing moves and start understanding the underlying structure of opportunity.
Regards- Amit Rajan
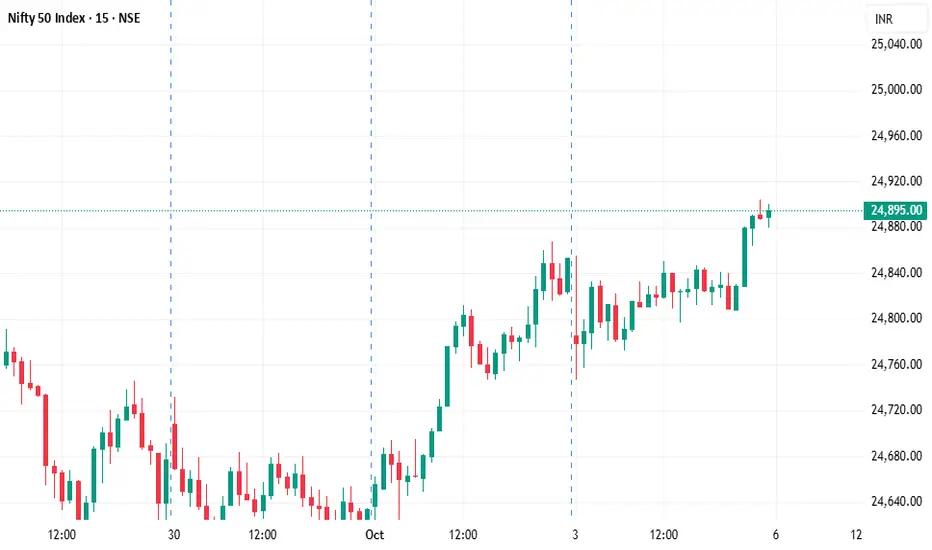
Short term trend opens up in Nifty So on Thursday we studied that NSE:NIFTY would remain sideways with a bullish tone.
And that’s exactly what happened on Friday.
Nifty traded within a range in the first half and then moved up sharply in the second half, closing +57 points higher.
Closing above the previous day’s high is definitely a good price action sign.
But ideally, buyers’ volume should have matched that momentum too.
On Friday, buyers’ volume was up — but not strong enough to suggest a sharp move ahead. In fact, on the last 15-minute candle, sellers’ volume was higher by 10 million.
However, on short-term charts, net volume has turned green, which means any dip till 24800 will likely be bought quickly.
Now, Nifty’s Pivot stands at 24848. A drop below this could lead to another range-bound session tomorrow, with support at 24800.
Resistance for the day would be 24925, and any meaningful move will only come if this level is broken and sustained for at least one hour.
Since PP is tight, if a breakout happens with strong buyers’ volume, we could see a sharp rally upward.
For FnO stocks, we’ll continue tracking NSE:BSE and NSE:BHARATFORG .
Sector-wise, #Shipbuilding, #NBFC, and #AutoParts are looking good.
That’s all for the day. Take care and have a profitable tomorrow.
---
📊 Levels at a glance:
Pivot: 24848
Support: 24800
Resistance: 24925 (sustain > 1H = breakout)
Pivot Percentile: Tight (sharp rally possible on volume breakout)
Bias: Sideways to bullish, buy dips above pivot
Sectors to watch: Shipbuilding, NBFC, Auto Parts
FnO Focus: #BSE, #BHARATFORG

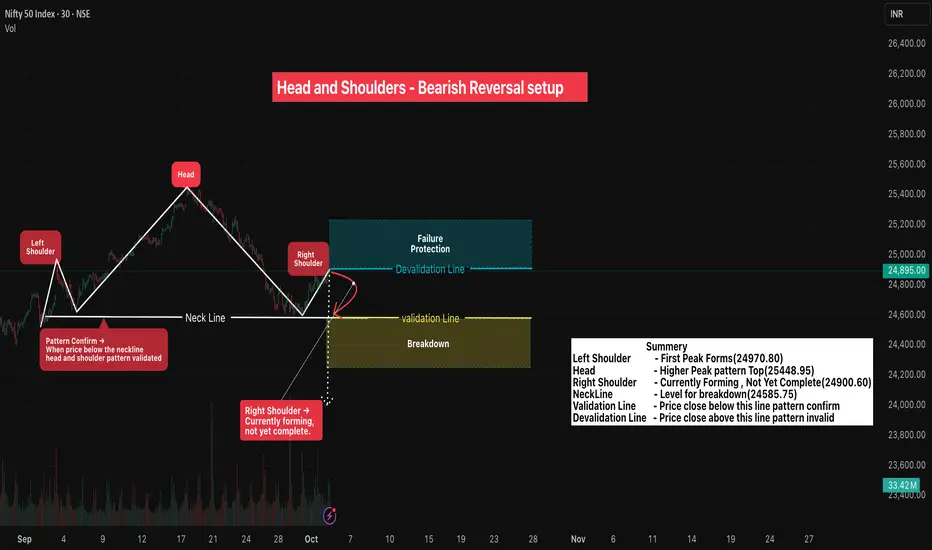
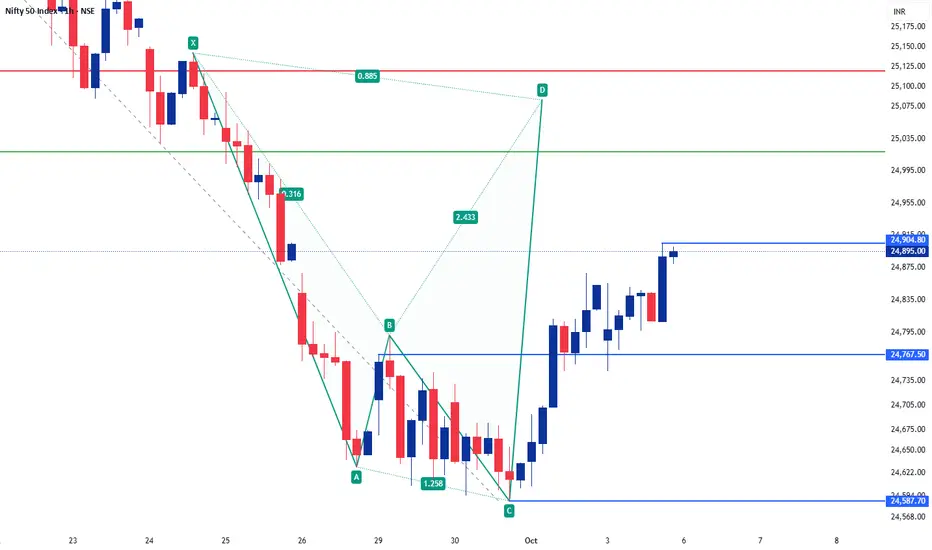
Head and Shoulders - Bearish Reversal Setup🔎Overview
The Head and Shoulders Pattern is a classic bearish reversal formation that signals a potential change in trend from uptrend to downtrend .
It is formed by three peaks:
- Left Shoulder → Price rises, forms a peak, then retraces.
- Head → Price moves higher than the left shoulder, creating the tallest peak, then falls back.
- Right Shoulder → Price rises again but fails to surpass the head, showing loss of momentum.
- Neckline → A line drawn through the two troughs between the shoulders and the head. A breakdown below the neckline confirms bearish sentiment.
This pattern reflects weakening buying pressure and strengthening selling interest, often appearing at the end of strong rallies.
____________________________________________________________
📌 How to Use
• ✅ Pattern Confirmed → When candle closes below the Validation Line
• ❌ Pattern Invalid → If candle closes above the Devalidation Line (Failure Protection).
• Protects against false signals & ensures structured risk management.
____________________________________________________________
📊 Chart Explanation
• Symbol → NSE:NIFTY
• Timeframe → 30m
• Left Shoulder Peak - 24970.30
• Head (Highest Peak) - 25448.95
• Right Shoulder Peak - 24900.80
• Neckline → Drawn by connecting the two troughs between shoulders and head.
• Validation Level → 24,585.75 → Close below = Pattern Confirmed .
• Devalidation Level → 24,910.65 → Close above = Pattern Invalid.
____________________________________________________________
👀 Observations
- The right shoulder often appears weaker, highlighting reduced buyer confidence.
- Once the neckline is tested multiple times, probability of a breakdown increases.
- Volume generally decreases during formation and expands during breakdown, strengthening confirmation.
- This setup helps traders anticipate major reversals rather than chasing late entries.
- Head and Shoulders is widely followed, making it self-fulfilling as many traders act on the same signal.
____________________________________________________________
💡 Why It Matters
Head & Shoulders is one of the most reliable reversal patterns, giving clear validation/devalidation levels for structured risk management. It helps avoid false breakouts and provides traders with predefined stop-loss and target zones.
____________________________________________________________
✅ Conclusion
Breakdown below the Validation Line confirms bearish reversal bias. Combine this with broader market context, volume confirmation, and disciplined position sizing for effective trading decisions.
____________________________________________________________
⚠️ Disclaimer
📘 For educational purposes only.
🙅 Not SEBI registered.
❌ Not a buy/sell recommendation.
🧠 Purely a learning resource.
📊 Not Financial Advice.
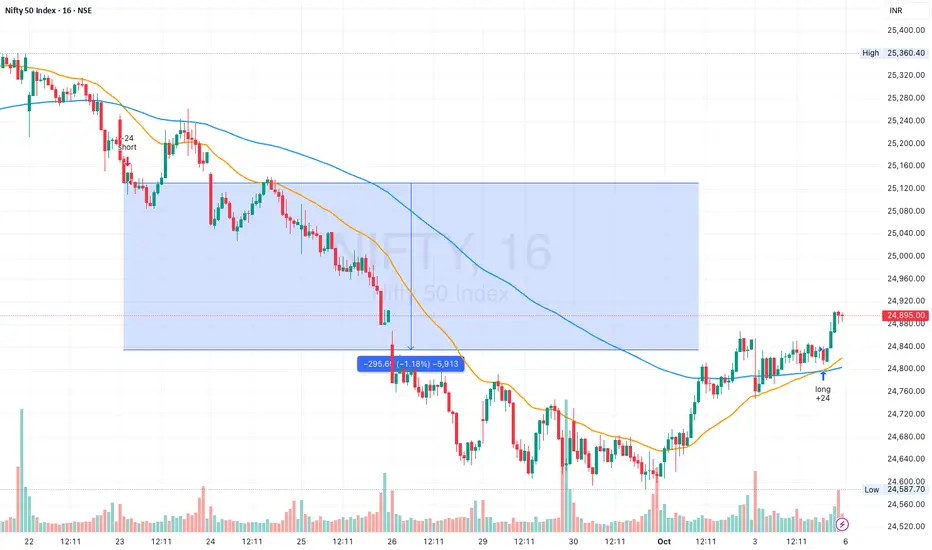
03 Oct 205 - Nifty is now Long, hope we get a new swing highNifty Stance Bullish 🐂
The last EMA crossover signal occurred on 23rd September, at which point we had gone short on the Nifty. The long signal was triggered today, on October 3rd, at 13:47, resulting in a profit of 295 points.
I did not think that we would get a long signal that soon, hoping that we could fall a bit more, especially to the 24400 levels, but the markets had other plans.
From here, Nifty needs to break the resistances at 24931 and 25003 to reach the 25219 levels, which also means it will surpass the last short signal in the 25132 zone. The recent swing high of 25448, if broken, could lead to a superb short-covering rally that could even help us take out the ATH, but let us hope that we go there as slowly as possible so that we don't fall back sharply as we did in the last 10 sessions.
Valuations are improving for select stocks, and this also means it's a favorable buying opportunity. Let us also not forget that FIIs will only invest in Indian stocks if the comparable value improves relative to global peers.
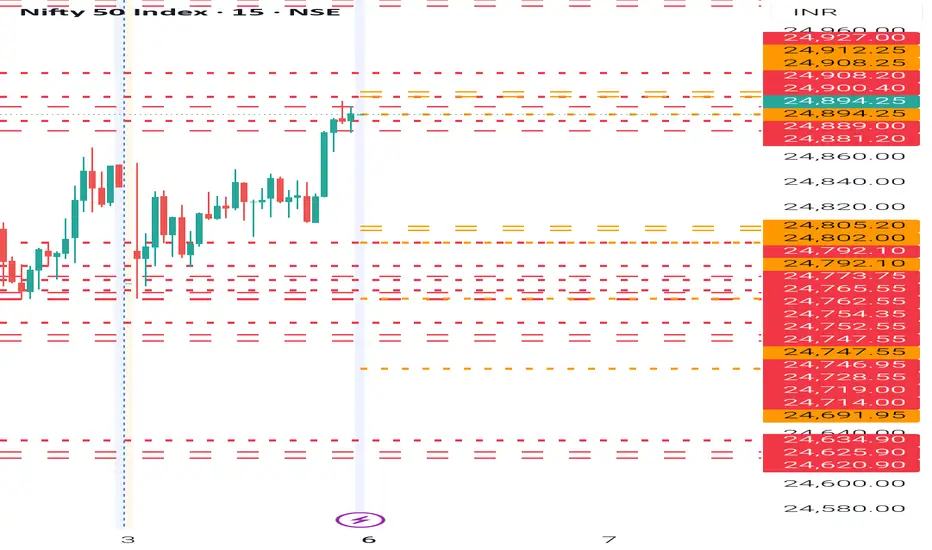
NIFTY- Intraday Levels - 6th October 2025If NIFTY sustain above 24909/12 ONLY if sustains above this bullish then around 24927 above this bullish then around 24965 then 24980/85/94 strong level above this wait
If NIFTY sustain below 24894/89/81 below this bearish around 24805 to 24792 then around 24773/54/46 strong level below this wait
My view :-
My analysis is for your study and analysis only, also consider my analysis could be wrong and to safeguard the trade risk management is must,
Market may open positive or for first 15-45 min it may show some bullish movement however, I'm expecting both side movements with high probability of sell on rise. Looks like this may be temporary profit booking/position adjust for bullish expiry with 24900 as strong resistance for expiry but, it all will depend on were the market closes. And also keep an eye on news that may impact movement of market.
Consider some buffer points in above levels.
Please do your due diligence before trading or investment.
**Disclaimer -
I am not a SEBI registered analyst or advisor. I does not represent or endorse the accuracy or reliability of any information, conversation, or content. Stock trading is inherently risky and the users agree to assume complete and full responsibility for the outcomes of all trading decisions that they make, including but not limited to loss of capital. None of these communications should be construed as an offer to buy or sell securities, nor advice to do so. The users understands and acknowledges that there is a very high risk involved in trading securities. By using this information, the user agrees that use of this information is entirely at their own risk.
Thank you.
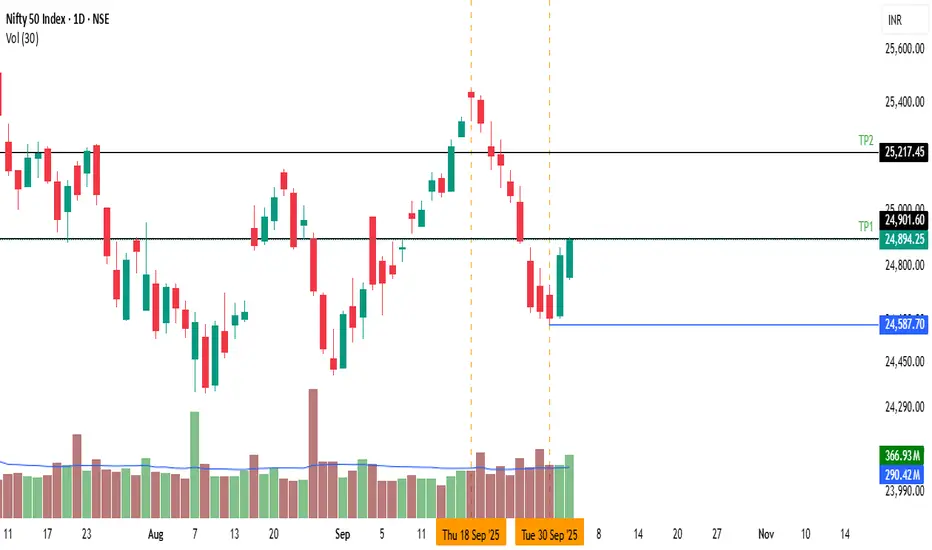
Play with the Square Root Strategy in Nifty.Hello friends, welcome to all of you. We have discussed many things about WD Gyan's theory and square before. Today also we will reveal a little about it.
We told you that the market could reverse from Ashtami Tithi, and it did.
Look at Nifty to see where the market turned this time.(Nifty Low 24,587.70) = SQRT 156.80
whose square root was 156.80.Now add one with 156.80+ 1= 157.80 and find its square is 24,901.60 that's it.
We also learned that due to momentum, the price would cross or touch our square price in the next 3- 4 days. we reach within 2 days.( Nifty spot last day high 24,904.80 & closing price 24,894.25)So Nifty still has 2 extra days in hand.
So you can see the market is standing near our square price.This is how we learned to capture market momentum. So Nifty still has 2 extra days in hand.
If the market moves above the price of this square root, let's find out what the next square root is. 157.80+1= 158.80 & square value is 25217.44
What could be the trading strategy? If the price is above 24901 then it will move to the next square root.
I hope you all liked it very much and you can write for any square root related information, we will try to tell you, thank you all.
#Nifty Weekly Analysis 06-10-25 to 10-10-25#Nifty Weekly Analysis 06-10-25 to 10-10-25
24750-25080 is the sideways range for nifty next week.
Long above 24920 for the targets of 25000/25080.
24750 is the support for this week and also
ideal pull back level for long for the targets of 24900/25080.
Short level is only below 24700 for the targets of 24600/24500.
View: Sideways to Upside.
“Nifty 50 Intraday Key Levels | Buy & Sell Zones” 6th Oct 2025Key Levels for Tomorrow:
25,120 → Above 10m closing Short Cover Level (CE Safe Zone)
Below 10m hold PE (Risky Zone)
25,023 → Above 10m hold CE (Entry Level)
Below 10m hold PE (Risky Zone)
24930 → Above 10m hold → Positive Trade View
Below 10m hold → Negative Trade View
24,820 → Above Opening S1 hold CE (Buy Level)
Below Opening R1 hold PE (Sell Level)
24,690 → Above 10m hold CE (Buy Level)
Below 10m hold PE (Sell Level)
24,590 → Above 10m hold CE (Safe Zone)
Below 10m hold UNWINDING Level

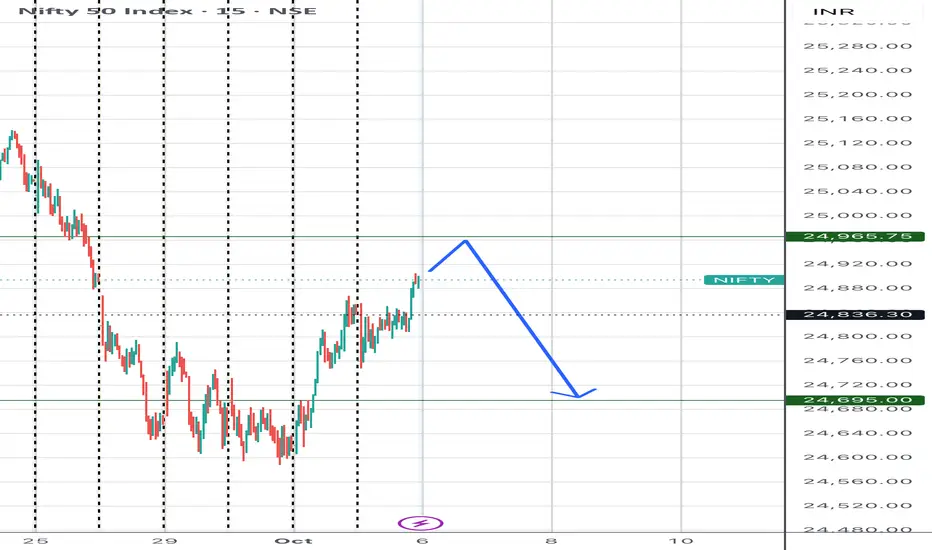
Nifty next week move Nifty next week move from 5 Oct 2025 .
Nifty might open higher then touch 24965 level then we can plan for short trade if we gets any entry bassed on 15min 9Ema cross over or Mss.
To target 24695.
Let see what happens next in nifty
Trading with AI: Revolutionizing Financial Markets1. Understanding AI in Trading
AI in trading refers to the use of machine learning algorithms, deep learning, natural language processing, and other advanced computational methods to analyze market data and make trading decisions. Unlike traditional trading, which relies heavily on human intuition and manual analysis, AI trading systems can process massive datasets, detect patterns, and execute trades with minimal human intervention.
Key aspects include:
Machine Learning Models: Used to forecast price movements, volatility, and trading volume.
Algorithmic Trading: AI systems can automate order placement, optimizing timing and pricing.
Predictive Analytics: Historical market data is analyzed to predict future trends.
AI-powered trading aims to reduce human biases, improve decision speed, and increase profitability by leveraging data-driven insights.
2. Types of AI Trading Strategies
AI trading encompasses multiple strategies depending on market objectives and risk tolerance. Some of the most common strategies include:
Algorithmic Trading: AI algorithms execute high-frequency trades based on predefined rules and patterns.
Sentiment Analysis Trading: AI systems analyze news, social media, and financial reports to gauge market sentiment and predict price movements.
Predictive Modeling: Machine learning models predict asset prices using historical and real-time data.
Reinforcement Learning: AI agents learn optimal trading strategies through trial and error in simulated environments.
Each strategy has its own strengths and challenges. For instance, high-frequency trading (HFT) requires extremely low-latency systems, whereas sentiment analysis relies on natural language processing and advanced data scraping.
3. AI in Market Data Analysis
The financial market generates enormous volumes of structured and unstructured data daily, including stock prices, order books, news articles, social media posts, and economic indicators. Human traders cannot efficiently process this volume in real-time. AI excels in:
Pattern Recognition: Identifying recurring price patterns and anomalies.
Correlation Analysis: Detecting relationships between assets or markets that humans may overlook.
Event Impact Analysis: Evaluating how geopolitical events, policy changes, or corporate announcements affect markets.
By leveraging AI, traders gain actionable insights from complex datasets that improve the accuracy of predictions and reduce reaction time.
4. Risk Management and AI
Effective risk management is crucial in trading, and AI can significantly enhance it by:
Real-Time Monitoring: AI models track portfolio risks continuously and alert traders to potential exposure.
Dynamic Position Sizing: Algorithms can adjust trade sizes based on volatility and market conditions.
Predictive Risk Assessment: Machine learning models forecast potential losses and drawdowns using historical data.
AI reduces human error in risk assessment and allows traders to maintain discipline even during highly volatile market conditions.
5. Benefits of AI Trading
AI-driven trading offers several advantages over traditional methods:
Speed and Efficiency: AI systems can process data and execute trades in milliseconds, outperforming human reaction times.
Data-Driven Decisions: Trading decisions are based on analytics and predictive modeling rather than emotions or intuition.
Consistency: AI executes strategies consistently without being influenced by fear or greed.
Adaptive Learning: Machine learning models evolve and improve over time with more data.
Cost Reduction: Automated AI trading reduces the need for large trading teams and manual intervention.
These benefits make AI an indispensable tool for hedge funds, institutional traders, and increasingly, retail investors.
6. Challenges in AI Trading
Despite its advantages, AI trading comes with challenges:
Model Overfitting: AI models may perform well on historical data but fail in real market conditions.
Data Quality Issues: Inaccurate or incomplete data can lead to wrong predictions.
Market Impact: High-frequency AI trades can contribute to market volatility.
Regulatory Risks: Financial regulators are increasingly scrutinizing AI trading to prevent market manipulation and ensure transparency.
Technical Complexity: Developing, testing, and maintaining AI trading systems requires expertise in data science, finance, and computing infrastructure.
Traders must balance AI capabilities with careful oversight and risk management to mitigate these challenges.
7. AI in Retail Trading
Traditionally, AI trading was limited to institutional players due to high infrastructure costs. However, advances in cloud computing, APIs, and AI platforms have democratized access:
Robo-Advisors: AI-driven advisory platforms provide portfolio management, asset allocation, and personalized investment advice for retail investors.
AI Trading Bots: Retail traders can leverage automated bots to execute trades based on algorithms.
Sentiment-Based Trading Apps: Apps analyze social media sentiment and news to provide trading signals.
Retail adoption of AI trading has grown exponentially, allowing smaller investors to compete more effectively in financial markets.
8. The Future of AI in Trading
The future of trading is intertwined with AI. Key trends likely to shape AI trading include:
Integration of Quantum Computing: Accelerating AI model training and improving prediction accuracy.
Hybrid Models: Combining human judgment with AI analytics for optimal decision-making.
Ethical AI and Transparency: Regulators will demand explainable AI models to prevent unfair advantages and ensure market integrity.
Cross-Market AI Systems: AI will simultaneously analyze equities, commodities, forex, and crypto markets to identify arbitrage and hedging opportunities.
AI in ESG Investing: AI can assess environmental, social, and governance factors to guide sustainable investment decisions.
As AI continues to evolve, it will not only enhance trading efficiency but also reshape how markets operate globally.
Conclusion
AI trading represents a paradigm shift in financial markets, transforming how data is analyzed, trades are executed, and risks are managed. By combining speed, precision, and predictive power, AI allows traders—both institutional and retail—to make smarter, more informed decisions. However, successful AI trading requires robust infrastructure, high-quality data, careful risk management, and continuous monitoring to navigate challenges effectively.
The ongoing convergence of AI, big data, and financial markets promises a future where trading is faster, smarter, and increasingly automated, while still requiring human oversight to ensure ethical and strategic decision-making.

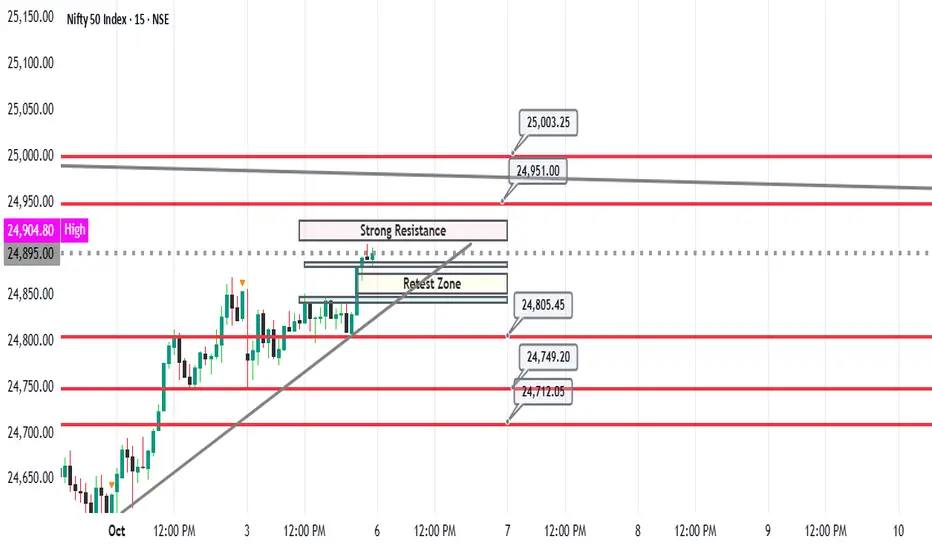
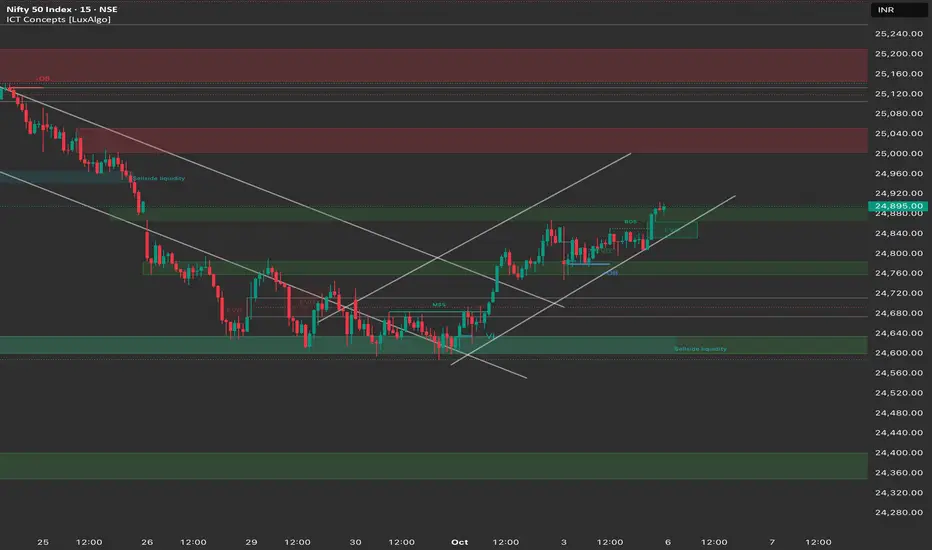
Nifty Structure Analysis & Trade Plan: 6th October
Detailed Market Structure Breakdown
4-Hour Chart (Macro Trend)
Structure: The Nifty is now in a confirmed bullish bounce phase. The decisive move on Wednesday (Oct 1st) and the follow-through on Friday (Oct 3rd) have broken the steep descending channel shown in your charts. The market is now trading within a clear ascending channel, and the recent low at 24,600 looks like a significant bottom for the correction.
Key Levels:
Major Supply (Resistance): 25,000 - 25,150. This area is the next significant hurdle, aligning with the psychological 25,000 mark and prior consolidation/supply zones.
Major Demand (Support): 24,750 - 24,800. This area, which includes a FVG (Fair Value Gap) and the lower trendline of the new ascending channel, is the key support.
Outlook: The medium-term bias has shifted to cautiously bullish. The strategy is firmly "Buy on Dips" as long as the price holds above 24,700.
1-Hour Chart (Intermediate View)
Structure: The 1H chart shows an unmistakable Break of Structure (BOS) on the upside. The price has established a pattern of higher highs and higher lows and is confidently moving within the new ascending channel.
Key Levels:
Immediate Resistance: 24,950 (The high of Friday's consolidation).
Immediate Support: 24,800 (Lower boundary of the new ascending channel).
15-Minute Chart (Intraday View)
Structure: The 15M chart shows a clean continuation of the bullish momentum. After breaking out of the descending channel, the index consolidated beautifully in a tight flag pattern and moved higher. The market closed near its high, indicating strong control by the bulls.
Key Levels:
Intraday Supply: 24,950.
Intraday Demand: 24,850 - 24,800.
Outlook: Strongly Bullish.
📈 Trade Plan (Monday, 6th October)
Market Outlook: The Nifty is in a strong bounce phase with a clear bullish structure. The primary strategy will be to buy on dips or buy on continuation.
Bullish Scenario (Primary Plan)
Justification: The market structure is bullish on all timeframes, supported by the RBI catalyst and follow-through buying. The momentum favors a break of 25,000.
Entry: Long entry on a decisive break and 15-minute candle close above 24,950. Alternatively, look for a dip entry near 24,800 (the channel and FVG support zone).
Stop Loss (SL): Place a stop loss below 24,750 (below the key support and rising trendline).
Targets:
T1: 25,050 (Psychological resistance).
T2: 25,150 (Major supply zone).
T3: 25,250 (Extension target).
Bearish Scenario (Counter-Trend Plan)
Justification: This high-risk, counter-trend plan only becomes valid if the rally fails dramatically.
Trigger: A decisive break and 1-hour candle close below 24,700.
Entry: Short entry below 24,700.
Stop Loss (SL): Above 24,850 (above the rising trendline).
Targets:
T1: 24,600 (Recent swing low).
T2: 24,400 (Deeper demand zone).
Key Levels for Observation:
Immediate Decision Point: 24,900 - 25,000 zone.
Bullish Confirmation: A break and sustained move above 25,000.
Bearish Warning: A break below 24,750 suggests a failure of the bounce.
Line in the Sand: 24,700. Below this level, the short-term bias shifts back to neutral-to-bearish.
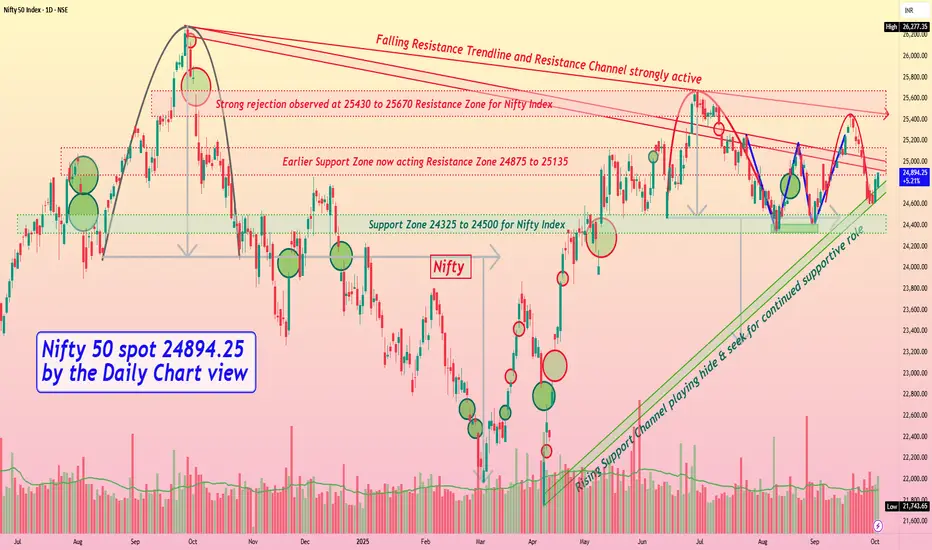
Nifty 50 spot 24894.25 by Daily Chart view - Weekly updateNifty 50 spot 24894.25 by Daily Chart view - Weekly update
- Support Zone 24325 to 24500 for Nifty Index remains active
- Rising Support Channel playing hide and seek for continued supportive role
- Strong rejection observed at 25430 to 25670 Resistance Zone for Nifty Index
- Current Resistance Zone 24875 to 25135 of Nifty Index remains an active hurdle
- Falling Resistance Trendline and Resistance Channel are still playing out pretty strongly
- Bearish Rounding Top scenario effect seems been negated by upswing over the past 2 days
Nifty Intraday Analysis for 03rd October 2025NSE:NIFTY
Index has resistance near 25000 – 25050 range and if index crosses and sustains above this level then may reach near 25200 – 25250 range.
Nifty has immediate support near 24650 – 24600 range and if this support is broken then index may tank near 24450 – 24400 range.