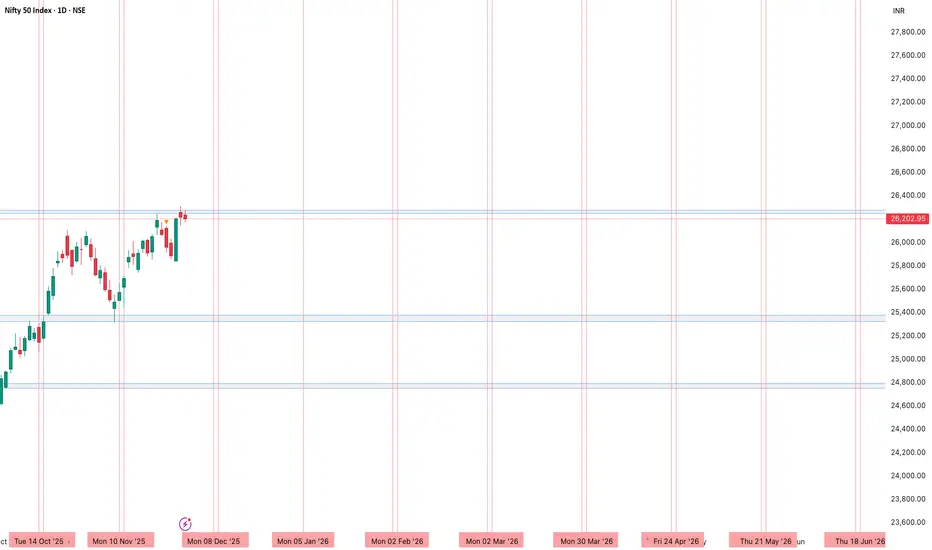
Nifty Time-Cycle Trend Reversal – Pushya Nakshatra Vertical LineIn this analysis, I have marked vertical lines on the Nifty chart based on the 2026 Pushya Nakshatra dates.
Pushya Nakshatra is considered an important time cycle in financial astrology and often aligns with key market turning points.
The vertical red lines highlight potential time-based trend reversal zones. When these time cycles overlap with major supply-demand levels, Nifty commonly reacts with a reversal or strong directional move.
What this Idea Shows
All major Pushya Nakshatra dates for 2026
Possible time-based reversal areas
Confluence with price structure and support–resistance zones
High-probability reversal points when the price meets the cycle date
Trading Approach
Observe price behavior near marked time cycles
Look for reversal candlestick patterns
Combine with supply–demand zones for higher accuracy
Not a buy/sell signal — only time-cycle based market behaviour observation
Conclusion
Pushya Nakshatra often acts as a natural cycle window where Nifty shows momentum shifts.
By combining these dates with technical zones, traders get early indications of potential trend reversals.
Trade ideas
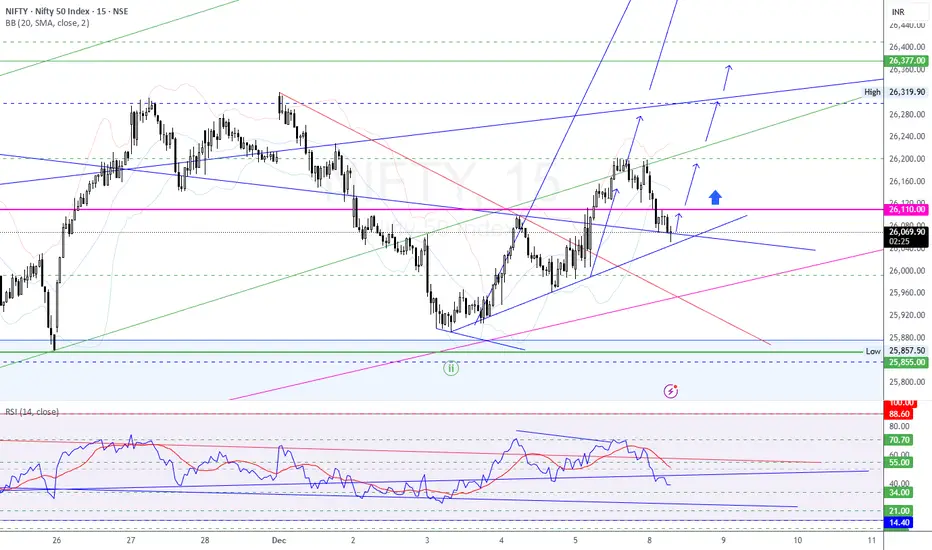
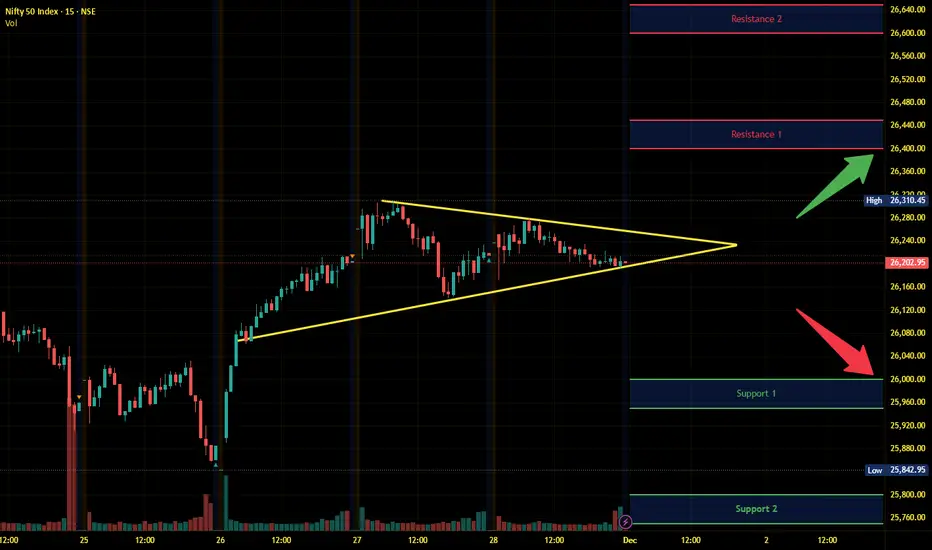
NIFTY 50 – Short Term Analysis (15M Chart)Date: 8 Dec 2025 | Timeframe: 15 min | Index near 26,076
Price Action Summary
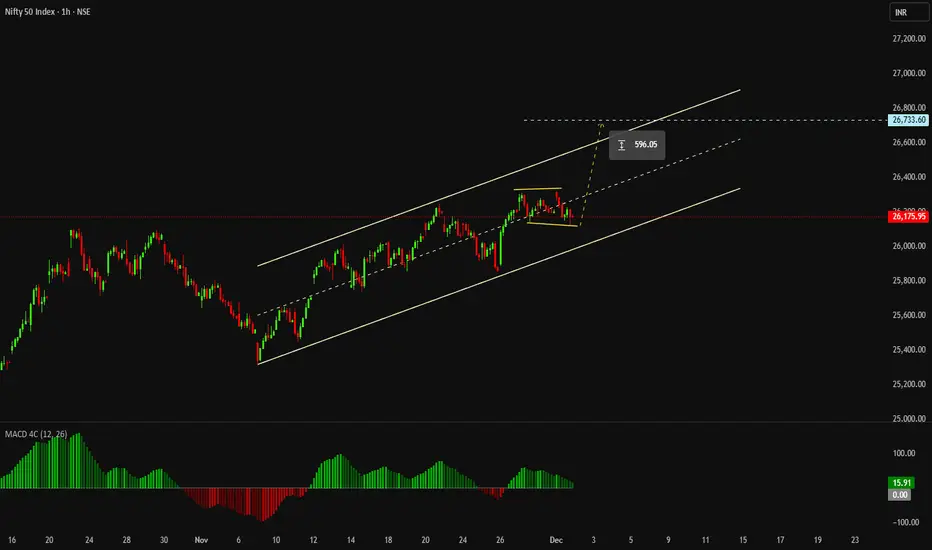
Nifty recently bounced from the lower trendline support created by the rising channel structure.
Price is currently trading above the blue ascending support line, indicating uptrend continuation potential.
26,110–26,120 zone (marked in pink line) is a short-term decision level.
Sustaining above this region can lead to bullish continuation toward upper resistance zones.
🚀 Bullish Scenario
If price sustains above 26,110, then upside levels to watch:
26,160–26,180 (first resistance zone)
26,240–26,260 (trend channel resistance)
26,320–26,380 (major target zone – aligns with upper channel & previous supply zone)
📌 Blue arrows on chart suggest the projected upward moves if breakout holds.
🔻 Bearish / Risk Scenario
Failure to hold above ascending trendline could drag toward:
26,000
25,880–25,855 strong support (demand zone)
If this breaks, deeper correction may follow.
📍 RSI Analysis
RSI formed a bullish divergence earlier and recovered.
Currently sitting near mid-range (40–50 zone), which allows room for upside.
A breakout above 55–60 RSI will confirm bullish momentum.
🎯 Trading Plan (Non-Advice – for analysis only)
Bias Above 26,110 bullish Below 26,000 weak
Intraday opportunity Buy-the-dip setup on trendline support Short only below 26k
Key Levels
Level Role
26,110 Decision zone
26,160 / 26,240 Resistance
26,320 / 26,380 Target zone
26,000 Support
25,880–25,855 Major support
🔮 Conclusion
Nifty is currently in a pullback within an uptrend, respecting structure.
As long as 26,000 support remains intact, probability favors bullish continuation toward 26,240–26,320.
Nifty 26300 and 25900 range next week if break then good move Parameter Data
Asset Name Nifty 50 Cash (NSEI): 26,186.45 (LTP: Dec 5, 2025 Close)
Price Movement Strong uptrend continuation targeting and . Downside possible if is breached, targeting and .
Current Trade 🟩 BUY Active / T1: 26,350, T2: 26,500, T3: 26,800 / SL: 25,890
Risk Reward (R:R) 🟩 1 : 1.5
Confidence 🟩 28/30 (93.33%) (High conviction, supported by DII flows and technical breakout.)
Probability 🟩 90% (High probability of continuation towards 26,500.)
Market Phase 🟩 Expansion/Impulse Wave (Price aggressively moving higher, sustaining the multi-month rally.)
DEMA Levels 🟩 Extreme Bullish (Price is trading well above all key moving averages, reinforcing the uptrend.)
Supports 🟩 S1: 26,000 (Psychological & Breakout Zone), 🟩 S2: 25,900 (20-DEMA/Immediate Pivot), 🟩 S3: 25,700 (Major Structural Support/Lower Channel).
Resistances 🟥 R1: 26,350 (Channel Extension/Short-term High), 🟥 R2: 26,500 (Major Psychological & Technical Target), 🟥 R3: 26,800 (Next Fibonacci Target).
SMC Structure 🟩 Aggressive Bullish Order Flow. Price is respecting the higher timeframe demand zones (H4/Daily). BOS confirmed above 26,000.
Trap/Liquidity Zones 🟥 Liquidity Target: Above 26,500. Potential Trap: Shorting the high without a structural breakdown below 25,900.
Max Pain (Dec Expiry) 🟨 26,200 (Nearest weekly expiry Max Pain is 26,200; monthly expiry target expected to move higher.)
ADX/RSI/DMI 🟩 RSI (14): 65.5 (Strong Bullish), ADX (14): 32 (Strong trend strength.)
Market Depth 🟩 N/A (Weekend data; Depth N/A.)
Volatility 🟩 Low India VIX (10.32) (Tumbling VIX supports the clear, sustained uptrend/Expansion.)
Source Ledger 🟩 Verified (Weekend Rule): Official NSE Cash Closing Data from Friday, Dec 5, 2025.
OI (Futures) 🟩 High Premium (Dec Futures closed at 26,335, a massive premium, signaling strong bullish carry-over.)
PCR (OI) 🟩 1.15 (High Put writing, indicating strong support base; bullish bias.)
VWAP 🟨 N/A (VWAP data not available.)
Turnover 🟩 High (Strong participation, confirming the validity of the upward move.)
Harmonic Pattern 🟨 N/A (Strong impulse wave; momentum focus.)
IV/RV 🟩 Low IV (Implied Volatility is subdued, typical of a slow and steady rally.)
Options Skew 🟩 Positive Skew (Call options are attracting premium, reflecting upside expectation.)
FII/DII Data 🟩 DII Net Buy: ₹4,189.20 Cr / FII Net Sell: ₹438.90 Cr (DII power continues to absorb FII selling.)
Block Trades 🟩 Major institutional buying observed in key Banking/Financial sector heavyweights.
Sentiment Index 🟩 85 (Extreme Greed). Sentiment is highly confident, often preceding a small correction but confirming the overall trend strength.
OFI 🟩 Overwhelming Buy-side pressure (Order Flow confirms buyers were in control into the close.)
Delta 🟩 Cumulative Delta: Strongly Positive (Buyers maintained control.)
Sectoral Leadership 🟩 Banks, Financials, Metals (Strong leadership from heavyweights.)
Broader Market 🟨 Mixed (Midcap Index up, Smallcap Index down, signaling selective participation.)
Data Triangulation 🟩 Verified (Technical structure, F&O data, and Institutional flows all point to a continued Bullish trend.)

NIFTY 50 – Near All-Time High | Breakout or Pullback? Chart Analysis 📈 (Weekly + Daily Analysis)
Nifty50 is trading close to its All-Time High zone around 26,350–26,400, showing strong bullish structure visible clearly on the Weekly timeframe with consistent Higher Highs & Higher Lows. Trend remains intact with no signs of major reversal yet.
Weekly Key Levels
Major Resistance: 26,350 – 26,500
Immediate Support: 25,950 – 26,000
Key Swing Support: 25,600
Major Trend Support: 24,900 – 25,100
Daily Observation
Price is consolidating near the resistance zone.
Volume is slightly decreasing → indicating a possible momentum slowdown
If price breaks above 26,400 with volume, a fresh breakout can lead to a strong continuation rally.
Breakout & Downside Scenarios
🟢 Bullish Breakout Above 26,400
Target Levels: 27,200 / 27,500
🔻 Pullback Scenario
First support: 26,000
Deeper support: 25,600
Market View
Long-term trend remains bullish
Short-term consolidation or mild pullback possible
Watch price reaction around 26,350–26,400 zone for next move confirmation
Summary
Nifty is at a decision point. A breakout above 26,400 can trigger a strong upside continuation, while a rejection can bring a healthy correction towards 26,000–25,600. Trend remains positive as long as the index holds the weekly support of 25,600.

NIFTY : Trading levels and Plan for 11-Dec-2025📊 NIFTY TRADING PLAN — 11 DEC 2025
Nifty closed around 25,742, sitting just below the Opening Resistance / Support (25,813) and well below the Opening Resistance (25,894).
Price has shown weakness but is still near strong intraday supports from where reversals are possible.
Key Levels from Chart:
• Opening Resistance / Support: 25,813
• Opening Resistance: 25,894
• Last Intraday Resistance Zone: 25,973 – 26,007
• Opening + Last Intraday Support: 25,654 – 25,672
• Major Downside Support: 25,532
Directional bias will depend on whether price opens above or below 25,813.
🚀 1. GAP-UP OPENING (100+ points)
A gap-up above 25,840–25,880 pushes price near crucial resistance levels and may trigger bullish continuation if validated.
1. If price opens above 25,813 and retests successfully
• Do NOT chase the opening candle.
• Wait for a retest of 25,813 to confirm buyers are defending the zone.
• Long entries become valid on bullish wick rejection/CHoCH.
• Upside targets: 25,894 → 25,973 → 26,007.
• Partial booking advised near 25,894 due to historical rejection.
2. If price opens directly near 25,894 (Opening Resistance)
• Avoid immediate longs — this is a supply zone.
• If rejection occurs → Short entries valid only when price loses 25,813 again.
• Downside targets: 25,760 → 25,700.
3. If breakout sustains above 26,007
• Trend-day likely.
• Next resistance: 26,080–26,120 zone.
• Trail stop-loss aggressively to lock gains.
📌 Educational Note:
Gap-ups near resistance must be handled carefully — institutions often fade early strength. Retest entries protect from false breakouts.
⚖ 2. FLAT OPENING (around 25,730–25,770)
Flat opens indicate the market wants to test nearby levels before choosing direction.
1. If price reclaims 25,813 and sustains
• Strength returns to buyers.
• Break + retest of 25,813 = valid long setup.
• Targets: 25,894 → 25,973 → 26,007.
2. If price rejects 25,813
• Lower-highs indicate weakness.
• Short entries valid toward 25,700 → 25,654.
• Breakdown below 25,654 leads to further downside.
3. If price stays between 25,742–25,813 initially
• Expect sideways movements.
• Avoid trading inside this chop zone.
• Directional clarity only after a clean breakout.
📌 Educational Note:
Flat opens reveal early structure — let the market form its first higher-low or lower-high before taking trades.
📉 3. GAP-DOWN OPENING (100+ points)
A gap-down toward 25,650–25,700 brings price directly into strong intraday support.
1. If price opens inside 25,654–25,672 (Opening + Intraday Support)
• This is a high-probability reversal zone.
• Do NOT short immediately.
• Look for reversal signals — hammer, bullish engulfing, CHoCH.
• If confirmed → Long entries:
→ Targets: 25,742 → 25,813.
2. If price opens near 25,532 (Major Downside Support)
• Strong reaction expected here.
• Ideal place for long reversal setups.
• Targets: 25,654 → 25,700.
3. If price breaks below 25,532 decisively
• Avoid catching falling knives.
• Wait for a retest of 25,532.
• If retest rejects → Short continuation toward 25,460–25,420.
📌 Educational Note:
Gap-downs sweep liquidity; traders must wait for confirmation to avoid getting trapped in panic selling.
🛡 RISK MANAGEMENT TIPS FOR OPTIONS TRADERS
1. Avoid first 5 minutes of trading — premiums are unstable during gap openings.
2. Never buy far OTM options after gaps — IV crush can wipe out capital.
3. Always use price-level-based stop-loss, not premium SL.
4. Maintain strict risk per trade: 1–2% only.
5. High IV → Prefer option selling; Low IV → Option buying works better.
6. Book partial profits at key levels:
25,813 / 25,894 / 25,973 / 26,007
7. Avoid revenge trading — protect capital before chasing profits.
📌 SUMMARY & CONCLUSION
• Bullish bias begins only above 25,813, with targets toward 25,894 → 25,973 → 26,007.
• Neutral/Choppy zone: 25,742–25,813 — avoid taking trades inside until breakout.
• Strong downside reversal zones:
– 25,654–25,672
– 25,532
• Structure + confirmation = highest-probability trades.
• Respect risk — volatility increases near support zones.
⚠ DISCLAIMER
I am not a SEBI-registered analyst.
This trading plan is created solely for educational purposes and must not be treated as investment advice.
Always use personal judgment, risk management, and adapt to real-time market conditions.

Nifty Poised for Down MoveLooks like Diagonal formation in the Nifty 50 for an big downside of Target = 24400

What coming for Nifty weekly Expiry??Today nifty clearly was supported by the 20 EMA on the daily charts while it tested its 60 minutes 200 EMA.
Though both the moving averages has given support to the index on intraday basis. Still a fall is being seen in the market as the index closed 225 points lower.
Head & Shoulder pattern formation on the charts is there which seem to take support from the neckline. If the market remains beaarish and tend to breach the lower levels a clear support is around 25700-50 levels.
While a rising wedge pattern in also there as per the technicals. RSI is showing bearish divergence and a Death cross over (20 & 50 EMA) is there on the hourly charts.
If the market tries to recover a good resistance zone in around 26040-60 levels.
A swing/positional trader can initiate an entry once the neckline is breached and retest the support levels.
Major Trend is sideways and same is the Minor trend of the index.
Bullish entry can be created around the levels, once a positive setup is there on the charts for a target up to the resistance levels.(For intraday play)
Wait for the price action near the levels before entering the trade.
No bearish trade can be initiated as there was a good for on the hourly charts and profit booking can be seen in the upcoming session.
Major Support Zone :- 25850-900
Resistance levels :- 26060, 26200
Patience is the key for a good trading setup to function. Plan as per the plan.

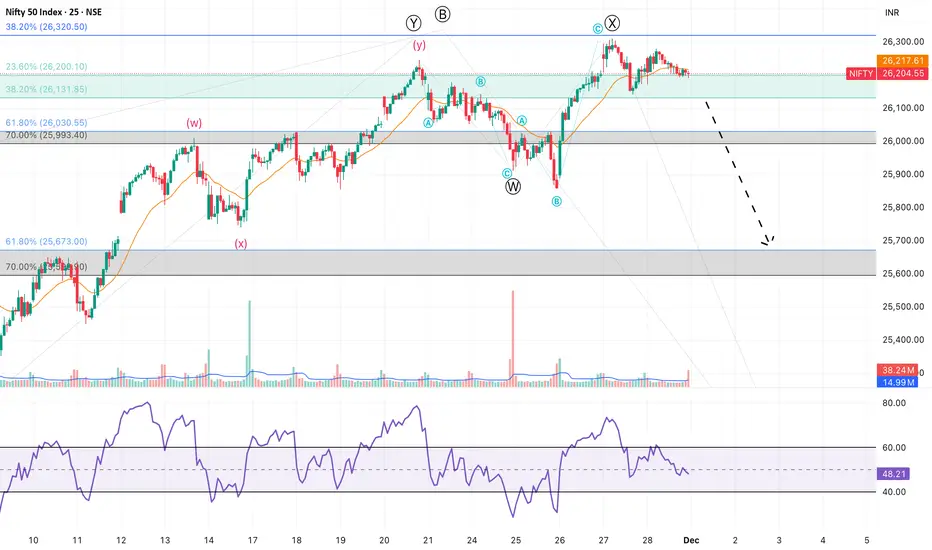
Nifty Analysis for Dec 01, 2025Wrap-up:
Nifty is forming a wxy pattern in wave C of major wave 2 has completed wave x @26310 and heading towards internal wave y.
What I’m Watching for Dec 01, 2025 🔍
Short nifty if it breaks 26131 SL 26310 for a target of 26030-25993 and 25673-22596 (SL on 15 min. candle close).
Disclaimer: Sharing my personal market view — only for educational purpose not financial advice.
NIFTY heading towards 25500!As we can see NIFTY continued its bearish sentiment and had been bearish throughout the day. Now, following the structure , we can expect NIFTY to continue its bearishness until a strong demand zone comes up which can be seen around 25500 so we can target that level so one can plan their trades accordingly.

NIFTY heading towards new ATH now!as we can see NIFTY finally broken above the indecision phase and also brok the high the doji. Based on our analysis after showing false breakdown, it can finally carry on its uptrend towards new ATH now. So, plan your trades accordingly and keep watching everyone.

Nifty in wedge structure after that next impulse for long side Nifty forms an impulse wave from 25318 to 2610, after that a wedge pattern is forming in which the last wave 'e' is in progress. Here wave 'e' is likely to end around 24700 or a new impulse wave should emerge from it which will make a new high.
Disclaimer
Here is my analysis, which I am posting for educational purposes only.
Thanks
MKT Learner

Leading diogonal in niftyleading diogonal in nifty.though the structure indicates much higher leevels in future,but prone to correction in near future.Diogonal corrections do take place rapidly.
0.236 level as shown in the chart is minimum possibility where as it can go deeper also.In the
follow ups I will show the recent case of etherium which I had followed up nicely.
do like this podt if helps you.follow me to get updates.

Nifty this week target is 26350 Nifty to achieve this target till friday as expected.
Lets see if this goes well as planned.
There is no much resistance in between.
If nifty open much down then no plan.
If It open flat or above then planning bullish trade to target 26350.

Doubtful Environment Ahead — Trade Only What the Market ConfirmsToday I followed what we planned in yesterday's commentary and sold NSE:NIFTY on the rise.
While many “gurus” on social media say there are no opportunities in the market, the truth is simple — opportunities always exist if you look in the right direction.
Now let’s talk about today’s market behaviour, which was quite unusual.
- Nifty fell on the chart, but buyers’ volume increased at the end of the day.
- The Macro Index also dropped.
- Market health shifted from Green to Orange.
- Collective volume decreased.
- And price is currently neither at support nor at resistance.
Together, these points indicate that the market is in a doubtful and unclear environment.
For me, trading means protecting what I earned today and not losing it tomorrow.
So whenever I am in doubt, I stay out. It is that simple for me.
Tomorrow looks like one of those days.
Since Nifty is stuck between support and resistance, I will plan my trades live during market hours. I’m prepared for both directions.
My primary idea is still Sell-on-Rise.
However, because buyers’ volume was strong today, I will not hesitate to go long if the index bounces from support.
I think tomorrow would be the day where I catch both side swing.
Support for me is around 25970.
Resistance is at 26110, where I will look for rejection to sell.
Pivot is now 26061 and the Pivot Percentile is tight, which means liquidity will be good tomorrow.
That's what I have as of now.
Take care.
Have a profitable tomorrow.

How to Identify Multibagger Stocks Using Fundamentals?Hello Traders!
Many people look for multibagger stocks, but only a few understand how to find them. A real multibagger comes from a strong business, not luck. Here are simple fundamentals that help you identify a stock with long-term growth potential.
1. Look for Steady Revenue Growth
A multibagger company grows its sales every year.
Check at least 5 years of consistent growth.
If sales keep increasing, the business is moving in the right direction.
2. Look for Rising Profits and Better Margins
Profit should grow faster than sales.
Higher margins show the company is becoming stronger.
A profitable company can grow without stress.
3. Choose Low-Debt Companies
High debt is a danger sign.
A company with low or zero debt is more stable.
Low debt means less risk during tough times.
4. Check If the Company Has a Strong Advantage
A multibagger usually has something special compared to others.
This can be brand power, technology, low cost, or unique products.
A strong advantage helps the company stay ahead.
5. Study the Management
Good leaders build strong companies.
Look at their track record and decisions.
Honest and stable management is a positive sign.
6. Make Sure the Industry Has Growth
Even a good company cannot grow in a dead industry.
Choose businesses in fast-growing sectors.
Industry growth supports stock growth.
7. Enter at a Fair Price
Even the best company is risky if bought too high.
Compare the valuation with industry averages.
A good business at a fair price becomes a powerful long-term winner.
8. Check Promoter Holding
High promoter holding shows confidence.
Avoid companies where promoters have pledged shares.
When promoters believe in the company, it’s a strong signal.
9. Watch Return Ratios (ROE, ROCE)
A good multibagger maintains ROE and ROCE above 15 percent.
High return ratios mean the company uses money wisely.
These ratios should be steady or rising.
10. Think Long Term
Multibaggers take time to grow.
Focus on the business, not daily price moves.
Long-term thinking builds real wealth.
Rahul’s Tip:
Multibaggers are found through simple research, not hype. Look for strong fundamentals, good management, and fair value. Then hold with patience.
Conclusion:
Finding a multibagger is all about understanding the business. Choose companies that grow steadily, stay financially strong, and have a clear future. With patience and discipline, wealth will follow.
Markets are RIGGED?Most traders begin their journey believing that the market will test their strategies, their indicators, and their ability to forecast price movements.
But the truth is far more uncomfortable:
The market tests you.
Your beliefs.
Your fears.
Your discipline.
Your identity.
You don’t trade the markets —
you trade your psychology.
The chart is merely the mirror.
Every hesitation, every impulse entry, every oversized position, every revenge trade…
These are not market behaviors.
They are your behaviors showing up on the screen.
You get exposed as a person the moment you start trading.
Not publicly — but inwardly.
You see the parts of yourself you could ignore in normal life:
• Your impatience
• Your fear of missing out
• Your need to be right
• Your avoidance of uncertainty
• Your emotional triggers
• Your lack of preparation
• Your fantasies and biases
The market makes them visible. It forces you to confront them.
And that’s why mastering yourself is the real edge.
Not a new indicator.
Not a new setup.
Not a new piece of news flow.
The internal work — discipline, emotional clarity, self-control, and self-awareness — creates the conditions for consistent execution. Without this inner alignment, even the best strategy collapses under emotional pressure.
When you hold your breath during a trade, the chart isn’t the problem.
When you hesitate to press the buy button, the trend isn’t the problem.
When you panic-exit a position early, volatility isn’t the problem.
Your inner state is what shapes your trading decisions.
That’s why your outside life is inseparable from your trading life.
How you:
• manage stress
• respond to conflict
• handle uncertainty
• maintain discipline
• structure your daily routine
• treat yourself during setbacks
• set boundaries
— all of this shows up in your trading results.
If your life lacks structure, your trades will lack structure.
If you avoid discomfort, you’ll avoid executing good trades.
If you’re emotionally reactive outside the markets, you’ll be reactive inside them.
If you’re scattered mentally, your entries will be scattered too.
Your personal patterns become your trading patterns.
Trading doesn’t change you — it reveals you.
And that’s why traders who commit to self-mastery eventually rise above the noise.
They aren’t fighting the market anymore.
They’ve learned to stop fighting themselves.
The graphs become quieter.
The impulses weaken.
The noise fades.
Decisions become clearer, calmer, cleaner.
Because the trader has changed —
and the trading reflects that change.

An interpretation This trend likely to contiune
its interpretation of broder trend unfolding in lower time frame
This is education content
Good luck
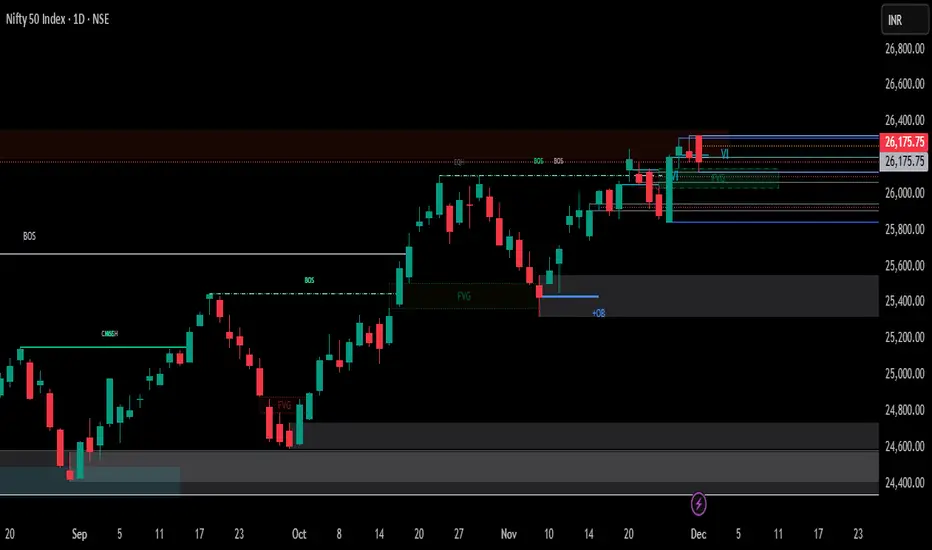
Nifty 50 Analysis (Based on Your 4H+1D Chart ) Key Observations from Your Markups (ICT Style):
1. Price is sitting inside a 4H FVG (26,110–26,170 zone)
This is acting as intraday demand / discount region.
Price bounced here previously and is testing it again.
2. Multiple PDH levels above + Weak High at ~26,320–26,350
This cluster suggests **liquidity resting above.
If price reclaims PDH → expect a sweep toward the weak high.
3. PDL is protected (~26,070–26,090)
Clean liquidity pool below.
A sweep into PDL + FVG confluence gives high-probability long setup.
4. Daily chart shows rejection from the supply zone (26,300–26,380)
But the structure is still **bullish BOS → continuation** unless 25,950 breaks.
---
📌Tomorrow’s Probable Scenarios
🟢 Bullish Setup (Higher Probability)
Entry Zone:
➡️ 26,080–26,120 (PDL + 4H FVG + discount)
Entry Trigger:
W-pattern
BOS on 5m/15m
Stop-run below today’s low
Targets:
1. 26,240
2. 26,310 (PDH)
3. 26,350–26,380 (Weak High / liquidity sweep)
Stoploss:
➡️ Below 25,980 (structure invalidation + 4H FVG break)
---
🔴 Bearish Setup (If 26,300 is rejected again)
Entry Zone:
➡️ 26,300–26,350 (weak high + PDH cluster)
Targets:
1. 26,180
2. 26,110 (FVG midpoint)
3. 25,980 (PDL & liquidity)
Stoploss:
➡️ Above 26,380 (clean invalidation)
Nifty - Expiry day analysis Dec 2The price faced resistance at 26320 and fall down towards support. Now the price is testing the double bottom support at 26120.
If the price opens gap down and shows a bullish sign around the 26040 zone, buy above 26060 with the stop loss of 26010 for the targets 26100, 26140, 26180 and 26220. Channel resistance will be there at the 26200 zone.
If the price opens flat, check how it is reacting around 26200 and if it shows bullish strength, buy above 26240 with the stop loss of 26190 for the targets 26280, 26320, 26360 and 26400.
Sell below 25980 with the stop loss of 26030 for the targets 25940, 25900, 25860 and 25820.
Please note if the price opens at the 25300 zone or 25200 zone and shows bearish strength, then it is a sell.
Expected expiry day range is 25900 to 26300.
Always do your analysis before taking any trade.

Nifty Intraday Analysis for 01st December 2025NSE:NIFTY
Index has resistance near 26400 – 26450 range and if index crosses and sustains above this level then may reach near 26600 – 26650 range.
Nifty has immediate support near 26000 – 25950 range and if this support is broken then index may tank near 25800 – 25750 range.
The uptrend is intact on expectation of rate cup by RBI in the scheduled MPC meet during 03-05 December 2025.
Nifty - Buy the Dip near Support. Don't chase short term gains. NSE:NIFTY is moving exactly the way we planned.
On Thursday we combined the Macro + Technicals and expected an Inside Bar — and that’s exactly what happened.
But we also noted the PP was tight, and still there was no breakout.
That’s called compression — when price doesn’t catch up even though macros are aligned.
This is the phase where retailers lose confidence, dump their BTST and swing positions, and the index dips back to the previous-resistance-turned-support.
Once their inventory is flushed out, institutions quietly accumulate from that support zone.
For us, that support is now 25070–25050.
So the plan is simple:
Buy the dip near this support.
Second plan:
Buy the breakout above 26312.
If this plays out, the target will be around 26700.
However, the plan becomes invalid if Nifty begins trading below 26000.
Also keep in mind — this upcoming move may not be sustainable for long.
Many stocks will blast next week, but they won’t sustain those gains.
So book profits. Don’t hold blindly.
Sector-wise, selective setups in Auto Parts, Finance, and Banks look good.
In many stocks you will see sharp moves, but investing now and hoping for “quick gains” would not be smart — because context is not strong.
And context is more important than sectors, setups, groups, or even fundamentals.
That’s all for today.
Take care. Have a profitable tomorrow.

Why Nifty’s Ending Diagonal Turns the Bias BearishAfter my previous bullish take on Nifty (see linked related publications), the view has now flipped.
And no — it’s not because the US indices are cracking.
And no — it’s not because Bitcoin is collapsing and draining liquidity.
Those may add pressure, sure.
But the core reason I’m turning bearish is right on the chart — in the structure itself.
Daily Chart – Why the Tone Has Changed
The key shift came from the overlap at 25,448.95 , which strongly hints that the rally from 24,404.70 unfolded as an ending diagonal , with all five legs subdividing into 3-wave structures (a-b-c).
This overlap is what invalidates the impulsive interpretation and turns the structure corrective.
That means the entire rise into wave (B) likely finishes a B-wave top , and Nifty may now be moving into wave (C) down.
At this point, Nifty could be forming either:
An ABC Expanded Flat , or
A Running Flat
Both are bearish in the short-term and typically resolve with a deeper C-wave.
And honestly, there is zero point chasing this market unless we get a decisive close above the ATH — whether on the daily , the weekly , or especially the monthly , which is about to complete and should give a clean directional clue.
Until that happens, the risk–reward on fresh longs is questionable.
This entire bearish view gets invalidated only if Nifty posts a strong , sustained close above the ATH on higher timeframes.
Weekly Chart – Resistance Stack Remains Heavy
The weekly structure adds more weight to the bearish bias:
Nifty is testing the ATH zone , a major psychological resistance.
Price is also hitting the rising trendline , which has already rejected earlier attempts.
Both these zones converge right at current levels — not the best place to be aggressive on longs.
This is a classic “let the market prove itself” zone.
Summary
The structure has shifted to corrective due to the ending diagonal overlap.
Daily chart suggests an Expanded or Running Flat scenario.
Weekly chart shows dual resistance — ATH + rising trendline.
No fresh longs unless there’s a clean breakout above ATH on higher timeframes.
Monthly candle close will be crucial.
Patience > prediction. Let the structure confirm before acting.
Disclaimer: This analysis is for educational purposes only and does not constitute investment advice. Please do your own research (DYOR) before making any trading decisions.

Nifty Short term view (Till December)Wrap up:-
Nifty has completed its wave B of major wave 2 @26306 and heading towards wave C of major wave 2.
I’ll be watching for the market to sustain above 26104 atleast 25 min. for a target of 24365-22949 with a SL of 26247 (SL daily candle close).
Disclaimer: Sharing my personal market view — only for educational purpose not financial advice.
