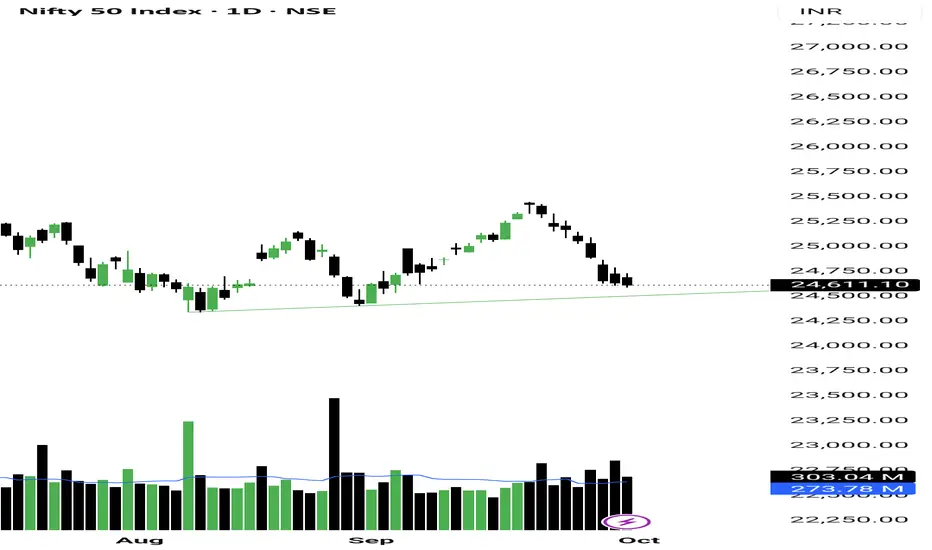
Nifty to be bearish this next days or notNifty was bullish on the last trading day.
But i am looking for a bearish days to target liquidity below 24530.
Till this liquidity below 24530 is not taken
I will not plan a long trade or wait for confirmation again if nifty wants to go up or not.
Trade ideas

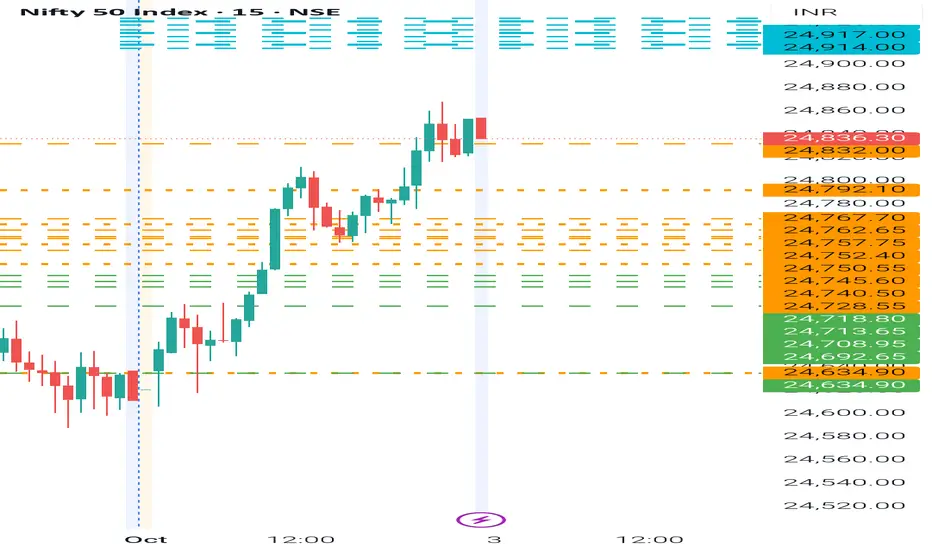
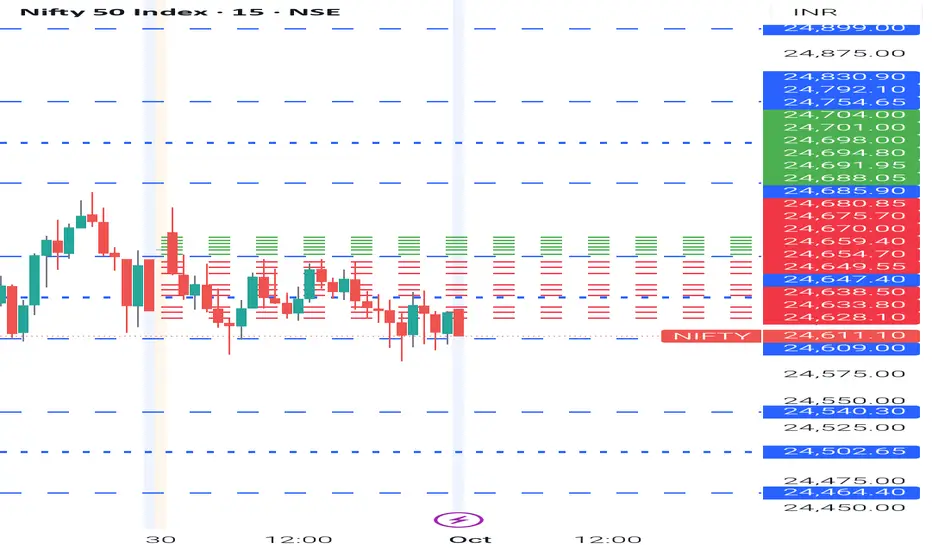
NIFTY- Intraday Levels - 3rd October 2025If NIFTY sustain above 24832 above this bullish then 24917/40 not much of an important level unless it opens below this it can serve as a mild resistance then 24984 to 25004 then 25022/42 then 25056/80 strong level above this wait
If NIFTY sustain below 24792 below this bearish then it may come down to 24718 to 24692 below this wait
Consider some buffer points in above levels.
Please do your due diligence before trading or investment.
**Disclaimer -
I am not a SEBI registered analyst or advisor. I does not represent or endorse the accuracy or reliability of any information, conversation, or content. Stock trading is inherently risky and the users agree to assume complete and full responsibility for the outcomes of all trading decisions that they make, including but not limited to loss of capital. None of these communications should be construed as an offer to buy or sell securities, nor advice to do so. The users understands and acknowledges that there is a very high risk involved in trading securities. By using this information, the user agrees that use of this information is entirely at their own risk.
Thank you.
Nifty 50 – Wave 2 Correction and the Confluence ZoneDisclaimer: This analysis is for educational purposes only and does not constitute investment advice. Please do your own research (DYOR) before making any trading decisions.
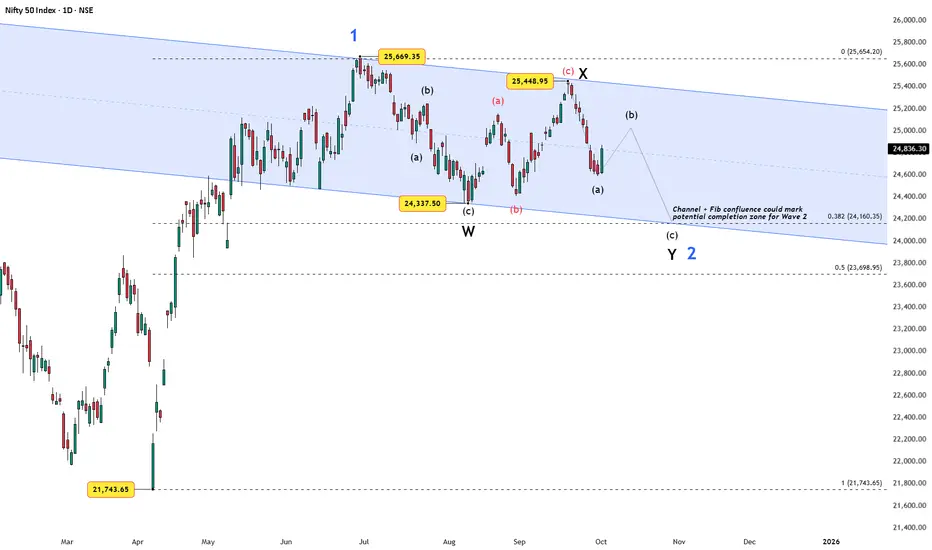
After bottoming at 21,743.65 in March 2025, Nifty launched a strong impulsive rally that topped at 25,669.35, marking Wave 1 of a new higher-degree advance.
Since then, price has been moving inside a downward-sloping channel , forming what appears to be a Wave 2 correction.
The subdivisions so far suggest a W–X–Y structure :
Wave W ended at 24,337.50.
Wave X topped at 25,448.95.
Wave Y is now unfolding, with (a) in place, (b) potentially in progress, and (c) likely still pending.
To assess possible completion zones, Fibonacci retracements of Wave 1 offer key checkpoints:
0.382 retracement at ~24,160, aligning with the channel base.
0.5 retracement at ~23,699, a deeper but still acceptable Wave 2 target.
This channel + fib confluence provides a meaningful area where Wave 2 could terminate, setting the stage for the next bullish leg — Wave 3.
Key Levels:
Resistance : 25,450 – 25,670 (breakout here invalidates the immediate Wave 2 scenario).
Support : 24,160 (0.382 fib and channel base).
Deeper support : 23,700 (0.5 fib).
Alternate scenario: If price continues sideways without decisive weakness, the correction may evolve into a triangle for Wave 2 instead of a W–X–Y.
Takeaway: As long as price respects the channel and fib zones, Wave 2 remains corrective in nature. A sustained break higher would open the path for Wave 3 — the next impulsive advance.
Bonds and Fixed-Income Trading Strategies1. Introduction to Bonds and Fixed Income
1.1 What Are Bonds?
A bond is a debt security, essentially a loan made by an investor to a borrower (typically a government, corporation, or financial institution). The borrower promises to pay periodic interest (coupon payments) and to return the principal (face value) at maturity. Bonds are considered fixed-income securities because they generally provide predictable returns over time.
Key components of a bond:
Face Value (Par Value): Amount repaid at maturity.
Coupon Rate: Annual interest percentage based on face value.
Maturity Date: When the principal is repaid.
Issuer: Entity borrowing the funds.
1.2 Importance of Bonds
Bonds serve several key functions:
Income Generation: Provide stable cash flows through coupons.
Portfolio Diversification: Lower correlation with equities reduces portfolio volatility.
Capital Preservation: Generally lower risk than stocks, especially government bonds.
Market Signaling: Bond yields reflect interest rate expectations and economic conditions.
2. Types of Bonds
Understanding the types of bonds is foundational for trading strategies:
2.1 Government Bonds
Issued by national governments; considered low risk.
Examples: U.S. Treasuries, Indian Government Securities (G-Secs).
Typically used for safe-haven investing.
2.2 Corporate Bonds
Issued by companies to raise capital.
Higher yields than government bonds due to default risk.
Categories:
Investment Grade: Lower default risk, moderate yields.
High Yield (Junk Bonds): Higher default risk, high yields.
2.3 Municipal Bonds
Issued by local governments or municipalities.
Often tax-exempt in certain jurisdictions.
Attractive for investors seeking tax-efficient income.
2.4 Convertible Bonds
Can be converted into equity shares of the issuing company.
Hybrid instrument combining bond-like stability and equity upside.
2.5 Zero-Coupon Bonds
Pay no periodic interest; sold at a discount.
Investor gains from capital appreciation at maturity.
2.6 Inflation-Linked Bonds
Principal and/or interest payments adjust with inflation.
Examples: U.S. TIPS, India’s Inflation Indexed Bonds.
Useful for hedging against inflation risk.
3. Bond Trading Strategies
Trading bonds requires understanding market cycles, interest rate movements, and credit risks. Strategies can be broadly categorized as:
3.1 Buy and Hold Strategy
Objective: Earn coupon income and principal at maturity.
Best For: Conservative investors and retirees.
Pros: Stability, predictable returns.
Cons: Limited capital gains; sensitive to inflation.
3.2 Active Trading Strategies
3.2.1 Interest Rate Anticipation
Goal: Profit from expected changes in interest rates.
Method: Buy long-duration bonds if rates are expected to fall; sell if rates are expected to rise.
Example: U.S. Treasury futures or Indian G-Secs.
3.2.2 Bond Laddering
Goal: Reduce reinvestment risk and smooth cash flows.
Method: Invest in bonds with staggered maturities.
Benefits: Steady income, flexibility to reinvest at different rates.
3.2.3 Barbell Strategy
Goal: Balance risk and return by investing in short- and long-term bonds.
Method: Avoid intermediate-term bonds.
Pros: High liquidity from short-term bonds, high yields from long-term bonds.
Use Case: Uncertain interest rate environment.
3.2.4 Bullet Strategy
Goal: Concentrate maturities around a specific date to fund known obligations.
Method: Buy bonds maturing around the same period.
Best For: Funding a major expense (e.g., pension payouts, debt obligations).
3.2.5 Credit Spread Trading
Goal: Exploit differences in yields between bonds of varying credit quality.
Method: Buy undervalued bonds or short overvalued bonds.
Caution: Requires strong credit analysis skills.
3.2.6 Yield Curve Strategies
Steepener: Buy long-term bonds, sell short-term bonds if yield curve is expected to steepen.
Flattener: Sell long-term bonds, buy short-term bonds if yield curve is expected to flatten.
Objective: Profit from changes in shape of yield curve, not absolute rates.
3.3 Arbitrage Strategies
Convertible Bond Arbitrage: Exploit mispricing between a convertible bond and its underlying equity.
Treasury Arbitrage: Use derivatives or bond futures to profit from small yield differences across maturities or markets.
4. Fixed-Income Derivatives in Bond Trading
Derivatives enhance bond trading flexibility:
4.1 Futures
Standardized contracts to buy/sell bonds at a future date.
Useful for hedging or speculating on interest rates.
4.2 Options
Call Options: Right to buy a bond at a strike price.
Put Options: Right to sell a bond.
Can hedge against price volatility or take directional bets.
4.3 Swaps
Interest Rate Swap: Exchange fixed for floating interest payments.
Credit Default Swap (CDS): Insurance against default risk.
Widely used by institutional traders to manage risk and leverage positions.
5. Risk Management in Fixed-Income Trading
Trading bonds is not risk-free. Key risks include:
5.1 Interest Rate Risk
Bond prices fall when interest rates rise.
Mitigation: Duration management, interest rate derivatives.
5.2 Credit Risk
Risk of issuer default.
Mitigation: Diversification, credit analysis, CDS.
5.3 Reinvestment Risk
Coupons may be reinvested at lower rates.
Mitigation: Laddering strategy.
5.4 Liquidity Risk
Some bonds, especially corporate and municipal, may be illiquid.
Mitigation: Focus on high-volume instruments or use ETFs.
6.5 Inflation Risk
Erodes real returns of fixed-income instruments.
Mitigation: Inflation-linked bonds, shorter maturities.
6. Technical and Fundamental Analysis for Bond Trading
6.1 Fundamental Analysis
Economic indicators: Inflation, GDP growth, employment, central bank policies.
Credit fundamentals: Debt-to-equity ratios, cash flows, corporate earnings.
Central bank actions and fiscal policy directly impact interest rates and yields.
6.2 Technical Analysis
Price patterns, volume trends, and yield charts.
Common tools: Moving averages, trendlines, RSI, support/resistance for bond ETFs and futures.
7. Global and Indian Bond Market Dynamics
7.1 Global Factors
U.S. Treasury yields set benchmark for global rates.
Geopolitical risk, monetary policies, and inflation expectations drive bond flows.
7.2 Indian Bond Market
Key instruments: Government securities (G-Secs), State Development Loans (SDLs), corporate bonds.
RBI’s monetary policy, inflation trends, and credit growth impact yields.
Indian bond market liquidity is improving, but corporate bonds can be thinly traded.
8. Advanced Trading Considerations
8.1 Algorithmic and Quantitative Trading
High-frequency trading in government bonds.
Arbitrage strategies using yield curve mispricings.
8.2 Portfolio Optimization
Combining bonds of different durations and credit qualities.
Risk-adjusted returns measured using metrics like Sharpe ratio.
8.3 Regulatory and Tax Considerations
Compliance with SEBI, RBI, and international regulations.
Tax efficiency plays a role in bond selection (e.g., municipal bonds in the U.S., tax-free bonds in India).
Conclusion
Bond and fixed-income trading requires a balance of knowledge, patience, and strategy. While bonds are traditionally seen as conservative instruments, sophisticated trading strategies—from interest rate anticipation and yield curve trades to credit spread plays—allow traders to capitalize on market inefficiencies. Understanding bond fundamentals, market dynamics, derivatives, and risk management principles is essential to crafting a successful fixed-income portfolio.
Bonds remain an indispensable tool for both income generation and portfolio diversification, bridging the gap between safety and opportunity in the financial markets.
WELL anticipated REVERSAL! Heading towards 25000 now!!As we can see as analysed we saw a strong REVERSAL before hitting our demand zone and is now expected to continue its short covering for 25000 level forming a reversal kinda pattern in weekly time frame. So for short term basis we can make positions for 25000 and if manages to sustain itself above 25000, we can target towards ATH so plan your trades accordingly and keep watching everyone.

NIFTY 50 Analysis & Trade Plan: 3rd OctoberMarket Context: The Nifty snapped its eight-day losing streak on Wednesday (October 1st), following the RBI MPC decision to hold the repo rate. This confirms a strong reversal from the critical 24,600 support zone.
Detailed Market Structure Breakdown
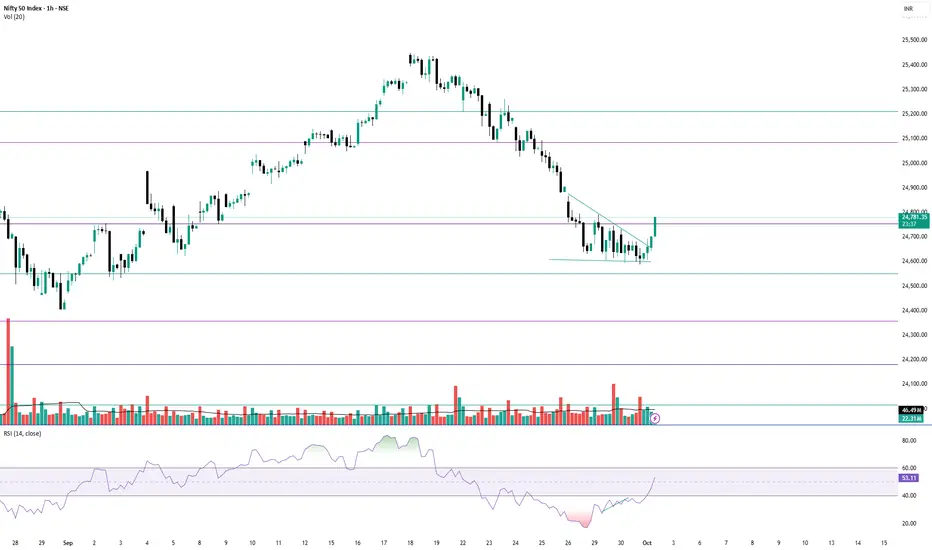
4-Hour Chart (Macro Trend)
Structure: The Nifty has decisively broken out of the steep descending corrective channel. The strong bullish candle on Wednesday (October 1st) has closed well above the channel's upper trendline, signaling a high-probability short-term reversal. The market has now recovered more than 50% of the last major leg down.
Key Levels:
Major Supply (Resistance): 25,050 - 25,150. This area is the next significant hurdle, aligning with the prior consolidation zone.
Major Demand (Support): 24,600 - 24,700. This is the key reversal zone. As long as the Nifty trades above 24,700, the bullish bounce is in control.
Outlook: The short-term bias has shifted from bearish to cautiously bullish. The trend will be "Buy on Dips" until the index retests the 25,150 zone.
1-Hour Chart (Intermediate View)
Structure: The 1H chart shows a clear Break of Structure (BOS) on the upside, as the price broke the descending channel and closed strongly. The market is now back in a short-term upward trajectory.
Key Levels:
Immediate Resistance: 24,880. This is the high of the current bounce and a minor psychological resistance.
Immediate Support: 24,750 (The top of the recent consolidation and FVG support).
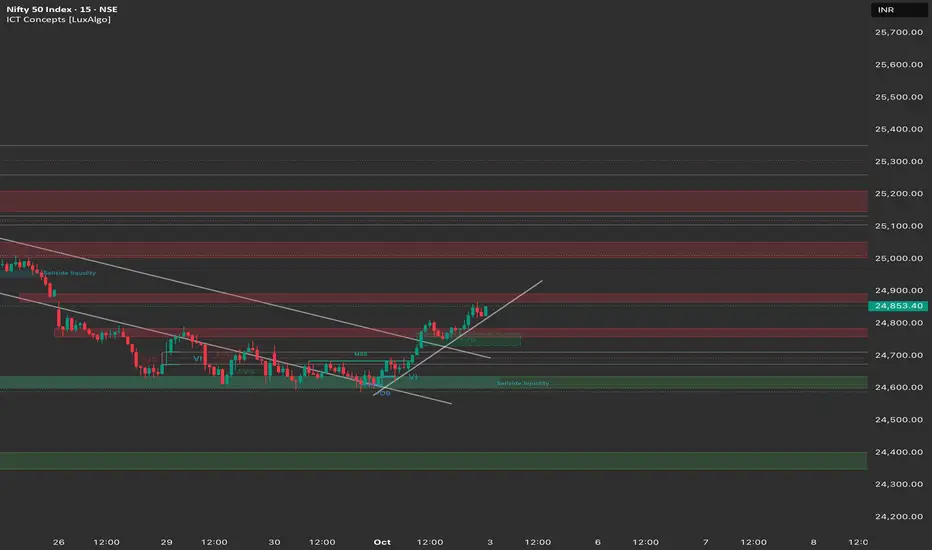
15-Minute Chart (Intraday View)
Structure: The 15M chart shows strong bullish momentum. The index successfully took out Sell-side Liquidity below 24,600 and then reversed sharply. It closed strongly above the EMA and is forming a continuation pattern (flag) right below 24,900.
Key Levels:
Intraday Supply: 24,900.
Intraday Demand: 24,800.
Outlook: Strongly Bullish for the session open.
📈 Trade Plan (Friday, 3rd October)
Market Outlook: The Nifty is in a strong bounce phase after the RBI policy catalyst. The primary strategy will be to buy on dips or buy on continuation.
Bullish Scenario (Primary Plan)
Justification: The strong close and confirmed reversal pattern across timeframes favor continuation towards the next major supply zone.
Entry: Long entry on a decisive break and 15-minute candle close above 24,900. Alternatively, look for a dip entry near 24,750 if the market retraces.
Stop Loss (SL): Place a stop loss below 24,700 (below the immediate FVG support).
Targets:
T1: 25,050 (Psychological level).
T2: 25,150 (Major supply zone).
T3: 25,250 (Upper resistance).
Bearish Scenario (Counter-Trend Plan)
Justification: This high-risk, counter-trend plan only becomes valid if the bounce is completely rejected.
Trigger: A decisive break and 1-hour candle close below 24,700.
Entry: Short entry below 24,700.
Stop Loss (SL): Above 24,850 (above the recent swing high).
Targets:
T1: 24,600 (Key reversal support).
T2: 24,400 (Deeper demand zone).
[ b]Key Levels for Observation:
Immediate Decision Point: 24,800 - 24,900 zone.
Bullish Confirmation: A break and sustained move above 24,900.
Bearish Warning: A move below 24,700 suggests a reversal failure and consolidation.
Line in the Sand: 24,600. A break below this level nullifies the reversal bounce.
Follow-Up : Nifty Long Idea from 30th September -Dot targets hitThis is continuation of my idea posted yesterday.
Nifty upside 25050-25150 will come in few days avoid sell tradeNifty upside 25050 to 25150 willl come infew days then market will wait for results and quarterly updates
How My Harmonic pattern projection Indicator work is explained below :
Recent High or Low :
D-0% is our recent low or high
Profit booking zone ( Early / Risky entry) : D 12.3% -D 16.1 % is
range if break them profit booking start on uptrend or downtrend but only profit booking, trend not changed
SL reversal zone (Safe entry ) : SL 23.1% and SL 25.5% is reversal zone if break then trend reverse and we can take reverse trade
Target : T1, T2, T3, T4 and .
Are our Target zone
Any Upside or downside level will activate only if break 1st level then 2nd will be active if break 2nd then 3rd will be active.
Total we have 7 important level which are support and resistance area
Until , 16% not break uptrend will continue if break then profit booking will start.
If break 25% then fresh downtrend will start then T1, T2,T3 will activate
1,3,5,10,15,20 minutes are short term levels.
30 minutes 60 minutes , 2 hours,3 hours, ... 1 day and 1 week chart positional and long term levels

Nifty 50: Genuine Rally or Selloff Setup?The Nifty 50 Index went up, but this upward move was likely just a temporary correction, not the start of a new, long-term rise.
Bottom (Wave W): The index first hit a low around 24,377
Bounce (Wave X): It then went up to a high near 25,448 . This rise was a clear, three-part corrective move (like an ABC pattern) that stayed inside a rising channel .
Clue: Because the move from the bottom (W) to the peak (X) was corrective, it suggests the overall trend is still bearish (downward).
Points to look at:
1. Reversal: The index is currently around 24,836 and is starting to turn down from the top of that rising channel. This suggests the temporary rise is over.
2. Projected Drop (Wave Y): The main prediction is a significant drop (Wave Y) that will likely break the previous low of 24,377 .
3. Target: This decline is expected to head toward the lower blue trendline on the chart, completing a larger WXY corrective pattern.
4. Projection: Ending point of wave (Y) can act as the ride for the new impulse cycle.
5. Bearish Stance: Traders should be cautiously bearish (expecting the price to fall).
6. Price action perspective: Previous swing is bearish, better to look at short positions for safe entry.
7. Selling Opportunities: Any small upward movements (retracements) are seen as good selling opportunities (betting on the price going down), as long as the price doesn't break above the recent highs or the channel ceiling.24,300 is indeed a strong demand zone.
Stay tuned!
Money Dictators :)

Nifty Intraday Analysis for 01st October 2025NSE:NIFTY
Index has resistance near 24775 – 24825 range and if index crosses and sustains above this level then may reach near 24975 – 25025 range.
Nifty has immediate support near 24475 – 24425 range and if this support is broken then index may tank near 24275 – 24225 range.
Market will react to the RBI MPC outcome, specially on FY 2025-26 economic outlook, inflation etc data.
Neowave Forecast| Gold|Bitcoin|Nifty|Bank Nifty|01/10/2025If you have any doubts related to your stocks and portfolio, ask in the comments we will provide you Neowave Chart for that.
Discussed Instruments
#Gold
#Bitcoin
#Nifty
#Bank Nifty
Previous Video Analysis 30/09/2025

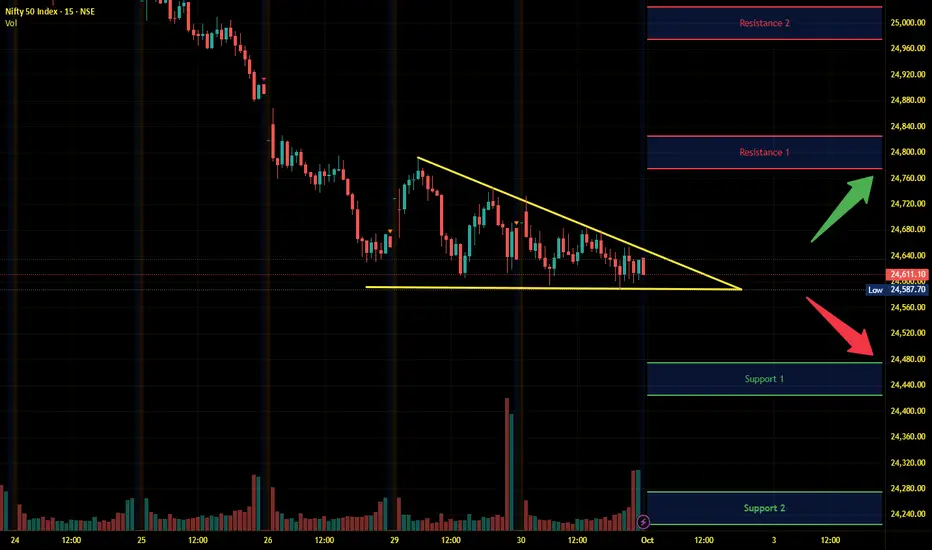
Traingle pattern broken in niftyNifty 50 has broken the triangle pattern. The MPC news has pushed the index give the breakout with good volume.
NIFTY BIGGER PICTURE ANALYSIS 01-OCT-2025LTP: 24655
Supports: 22000/18734
Resistances: 25670/26277
As long as 22K holds support, we can see 26277 again and further 28891
Other targets:
30500
33130-34750-37370 (Ultimate target)
41030
44220-45834-48455 (extension 1)
55300-57000-62170 (extension 2)

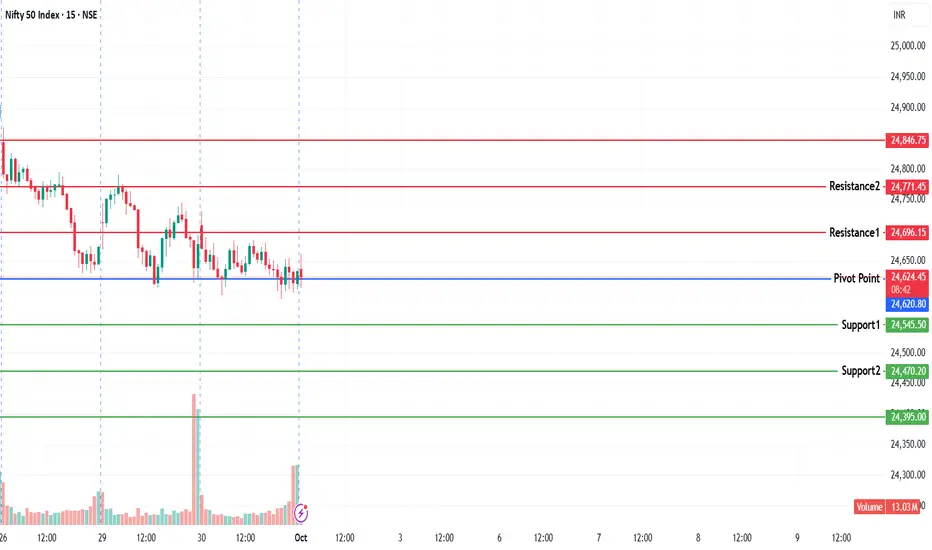
NIFTY KEY LEVELS FOR 01.10.2025NIFTY KEY LEVELS FOR 01.10.2025
RTF: 3 Minutes
If the candle stays above the pivot point, it is considered a bullish bias; if it remains below, it indicates a bearish bias. Price may reverse near Resistance 1 or Support 1. If it moves further, the next potential reversal zone is near Resistance 2 or Support 2. If these levels are also broken, we can expect the trend.
When a support or resistance level is broken, it often reverses its role; a broken resistance becomes the new support, and a broken support becomes the new resistance.
If the range(R2-S2) is narrow, the market may become volatile or trend strongly. If the range is wide, the market is more likely to remain sideways
please like and share my idea if you find it helpful
📢 Disclaimer
I am not a SEBI-registered financial adviser.
The information, views, and ideas shared here are purely for educational and informational purposes only. They are not intended as investment advice or a recommendation to buy, sell, or hold any financial instruments.
Please consult with your SEBI-registered financial advisor before making any trading or investment decisions.
Trading and investing in the stock market involves risk, and you should do your own research and analysis. You are solely responsible for any decisions made based on this research.
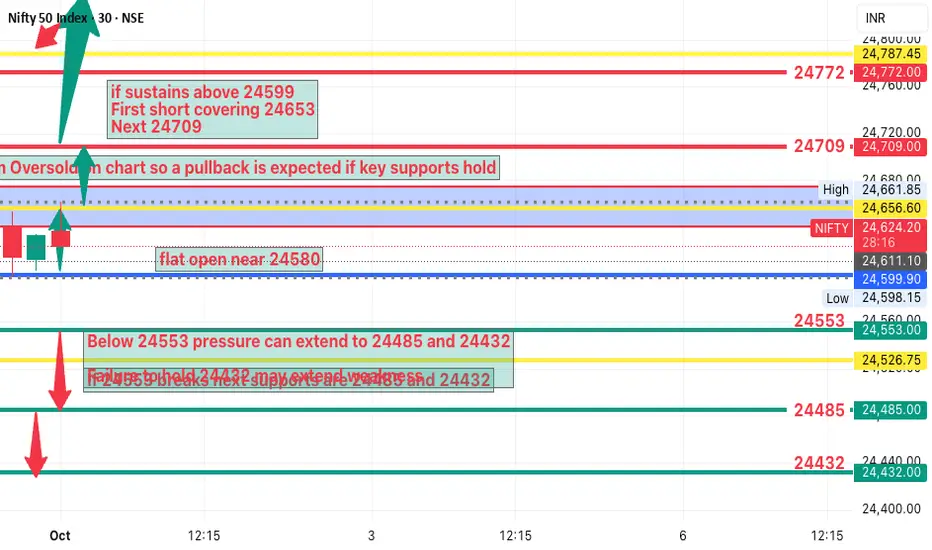
NIFTY Analysis 1 october 2025 ,Daily Morning update at 9 amMarket closed at a critical breakdown level
pattern Sideways for last 3 sessions
Momentum Oversold,so a pullback is expected if key supports hold
First half may see dip 24553 zone is crucial support
If holds and bounces above 24599 expect short covering rally towards 24709 and 24840
If breaks below 24553 weakness may extend to 24432
NIFTY Levels for TodayHere are the NIFTY's Levels for intraday (in the image below) today. Based on market movement, these levels can act as support, resistance or both.
Please consider these levels only if there is movement in index and 15m candle sustains at the given levels. The SL (Stop loss) for each BUY trade should be the previous RED candle below the given level. Similarly, the SL (Stop loss) for each SELL trade should be the previous GREEN candle above the given level.
Note: This idea and these levels are only for learning and educational purpose.
Your likes and boosts gives us motivation for continued learning and support.
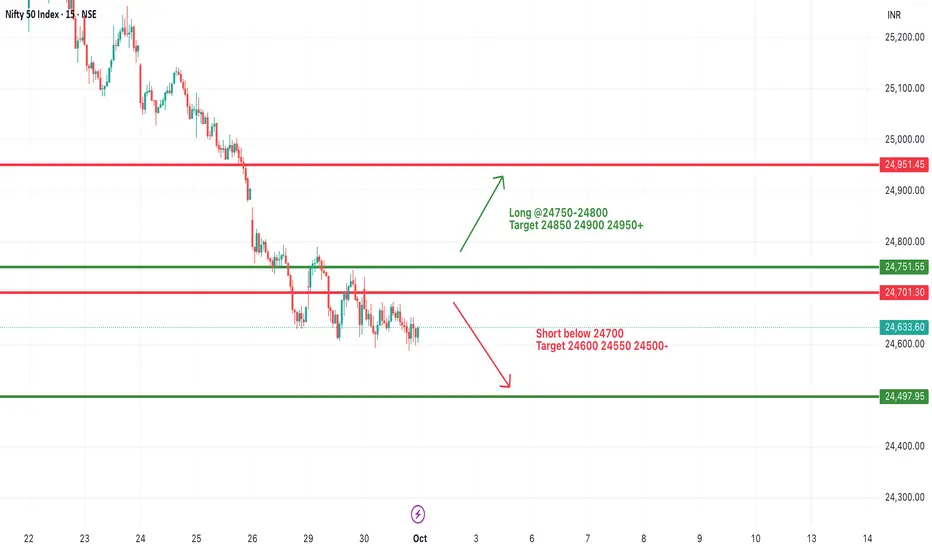
#NIFTY Intraday Support and Resistance Levels - 01/10/2025Nifty is expected to witness a slightly gap-up opening near the 24,700 level, which will be crucial to watch as it aligns with an immediate resistance zone. Sustaining above 24,750–24,800 may trigger upward momentum, pushing the index toward 24,850, 24,900, and 24,950+. A breakout above these levels will strengthen the bullish sentiment and may open the way for higher levels.
On the downside, if Nifty fails to hold above 24,700 and slips below 24,650–24,600, it could invite selling pressure. In such a case, the index may drift lower toward 24,550 and further to 24,500-. A deeper breakdown below 24,500 can extend the weakness and confirm continuation of the broader downtrend.
Overall, Nifty remains in a cautious zone, and the movement around 24,700 will decide whether the day favors a recovery bounce or continuation of weakness. Traders should stay alert around these levels with strict stop-losses.
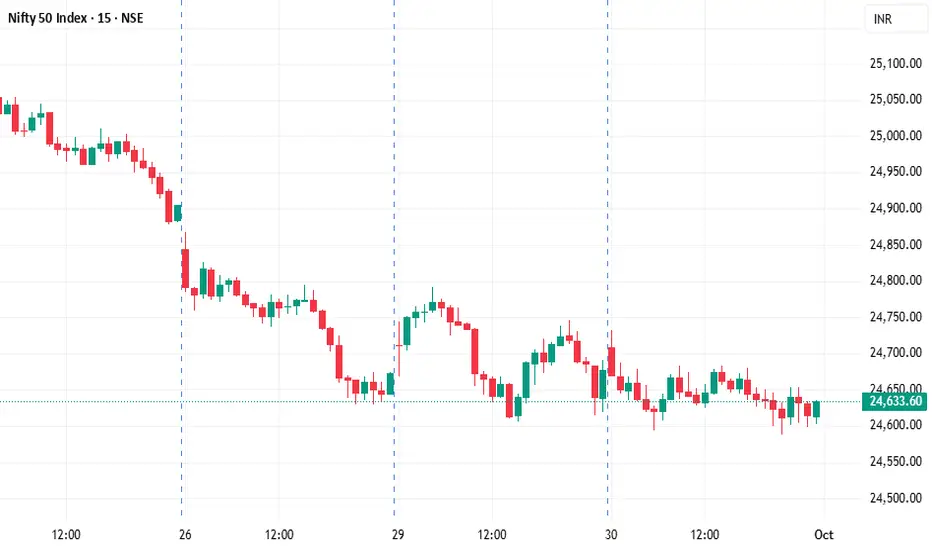
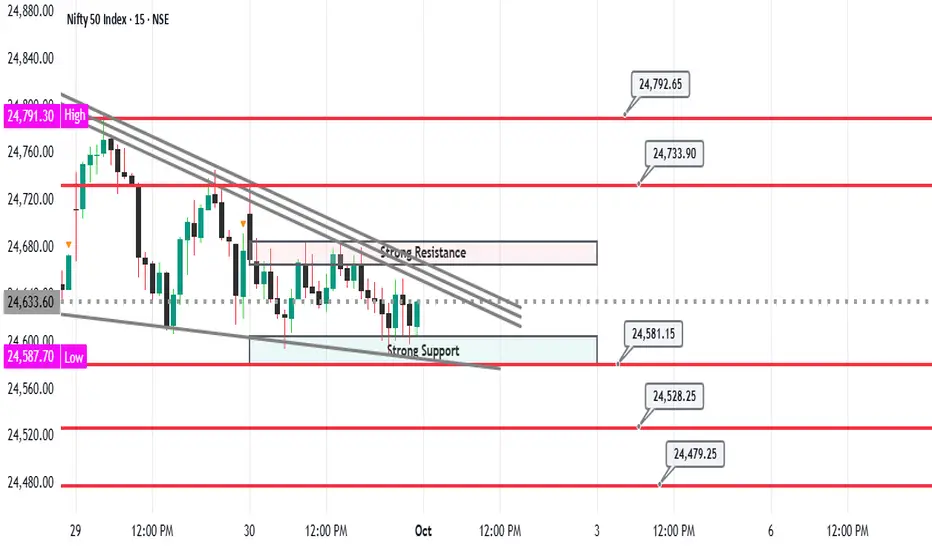
Nifty trades and targets - 1/10/2524700 and 24580 are acting as strong resistance and support until these zones are broken we will see market in sideways zone. Market is following the trendlines to the point. This is start of weekly expiry so we can expect both sides moves today. Let the resistance or support break with a 5 minutes candles then look for trades.
Nifty levels for 01/10/25Buy price : 24530
Stop loss: 24400
Target : 24750
Sell price : 24730
Stop loss : 24900
Target : 24400
Disclimer : I AM NOT A SEBI RESEARCH ANALYST OR FINANCIAL ADVISOR, these recommendations are only for education purpose, not for trading and investment purpose please take an advise from your financial advisor before investing on my recommendations.
🙏 : If you liked my content please suggest to your friends follow my trading channel. Your likes and comments provide boosting to me to update more financial information.
Thanking you for supporting me
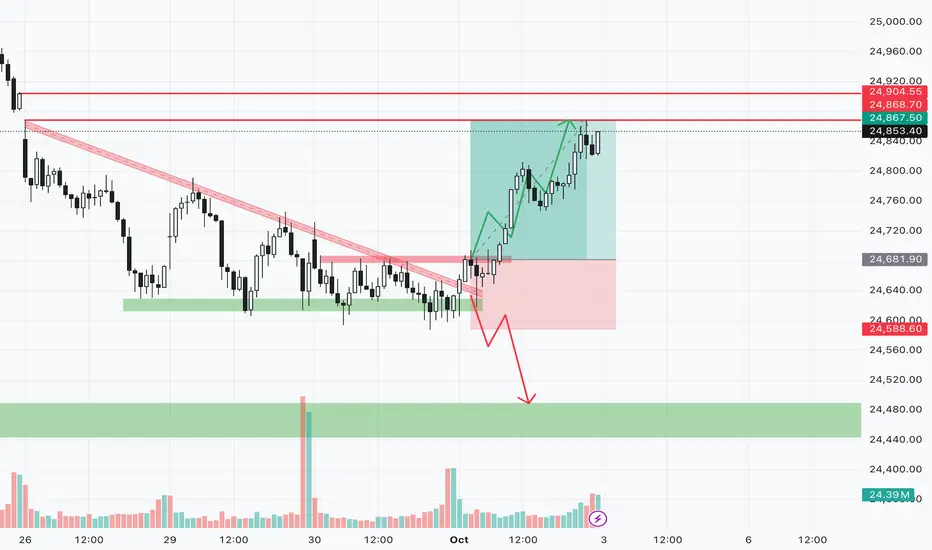
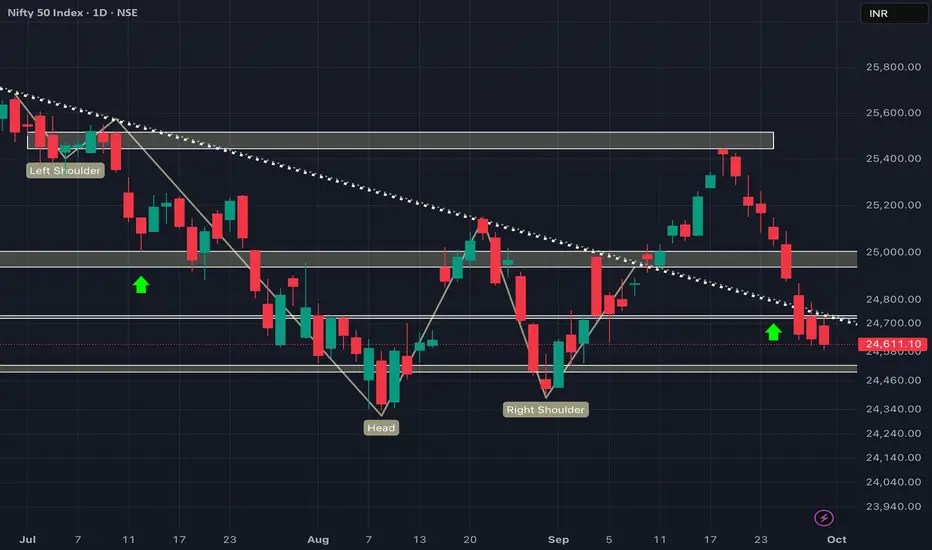
EXPECTING REVERSAL ANYTIME SOONER!!As we can see despite the weakness, NIFTY is unable to sustain itself below the last swings and getting constantly rejected around our demand zones which brings us to a conclusion considering various factors including strong psychological level and demand zone, we can expect a strong green candle anytime sooner and there is a high probability of forming a green weekly candle so plan your trades accordingly and wait for signs of reversal for buying.
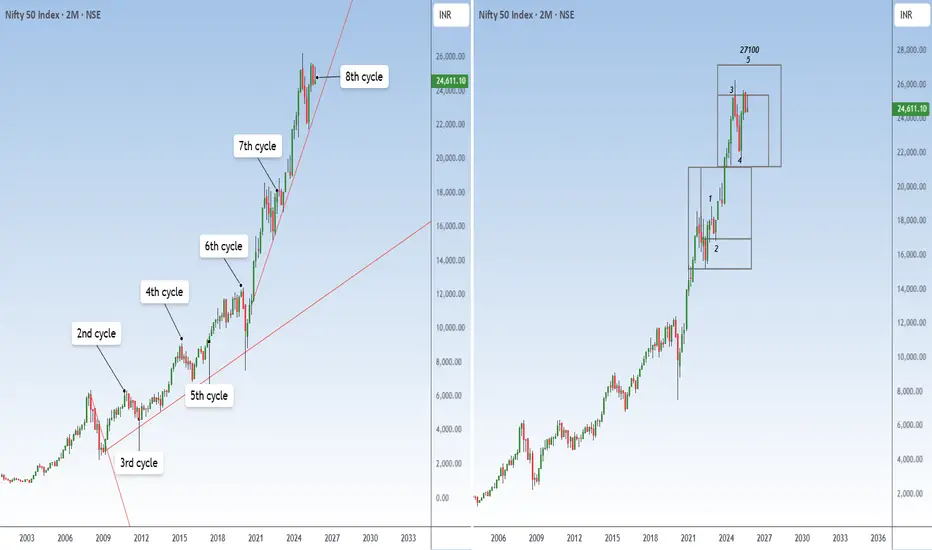
Why should u buy the dips??Nifty CMP 24611
Gann Square - from the 2008 lows the time cycle has pointed at imp pivots on the chart. The 8th cycle is the next bar, which is Nov-25. Hence the breakout will mostly happen in Nov-25.
Elliott - this is the last wave of this swing, which is the 5th wave. The tgt for the same is at 27100. From the current levels thats 10% move on the Index.
Conclusion - Hence buying the dip continues to be a good strategy.
NIFTY- Intraday Levels - 1st October 2025
New FNO series for October also the RBI policy day
If NIFTY sustain above 24647/59 above this bullish then 24670/85 strong level then 24692 to 24701 (+/-15 points) again a strong level then around 24754 then 24792 to 24830 strong level above this wait
If NIFTY sustain below 24609 below this bearish then 24540/02 or 24464 then 24395/58/19 last hope below this wait
**Disclaimer -
I am not a SEBI registered analyst or advisor. I does not represent or endorse the accuracy or reliability of any information, conversation, or content. Stock trading is inherently risky and the users agree to assume complete and full responsibility for the outcomes of all trading decisions that they make, including but not limited to loss of capital. None of these communications should be construed as an offer to buy or sell securities, nor advice to do so. The users understands and acknowledges that there is a very high risk involved in trading securities. By using this information, the user agrees that use of this information is entirely at their own risk.
Thank you.
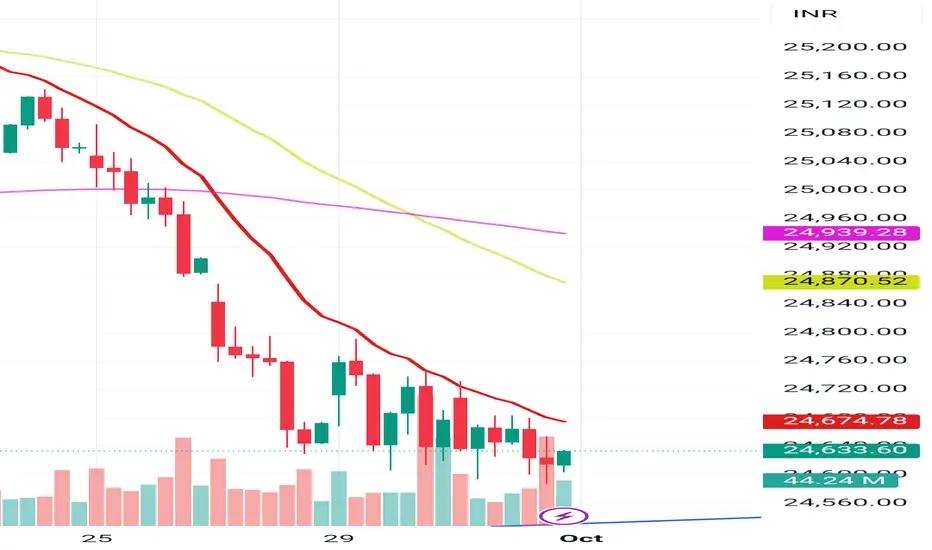
Accumulation in Nifty seen again! This is the 2nd straight session where NSE:NIFTY price closed below the day low but buyers’ volume was higher.
Red candle + green volume = a clear institutional accumulation footprint.
On top of that, the retailers index is going down, which confirms the view even more.
Normally, after yesterday’s strong buyers’ volume, we should have seen a bounce in the index today. But thanks to the weekly + monthly expiry, price was suppressed.
That suppression means one thing – the market can pop out anytime.
Remember the 3-step process I shared before:
1. Accumulation
2. Manipulation
3. Distribution (uptrend)
Right now we’re in the accumulation phase. A manipulation phase cannot be ruled out – it could come as a direct drop or a bounce with sell-on-rise characteristics. So, watch closely over the next 2–3 days.
Personally, I think from next week we’ll enter the 3rd phase – distribution or simply, the uptrend. Until then, accumulating dips whenever buyers’ volume is up is the right strategy. That’s exactly what I’m doing.
Now for tomorrow:
– Pivot is at 24644, PP is 0.13%
– If index opens above the pivot and holds on the hourly chart, we can see a sharp move to 24760 / 24880
– Downside support is at 24570
Sector-wise, PSU Banks and Metals are looking strong.
I’m holding NSE:HINDZINC and added NSE:REDINGTON today. I won’t be adding more until market breadth improves.
That’s all for today. Take care. Have a profitable tomorrow.
---
📊 Levels at a glance:
Pivot: 24644
Support: 24570
Resistance 1: 24760
Resistance 2: 24880
Pivot Percentile: 0.13% (sharp move possible)
Bias: Accumulation phase, buy dips on buyers’ volume uptick
Sectors to watch: NSE:CNXPSUBANK , NSE:CNXMETAL