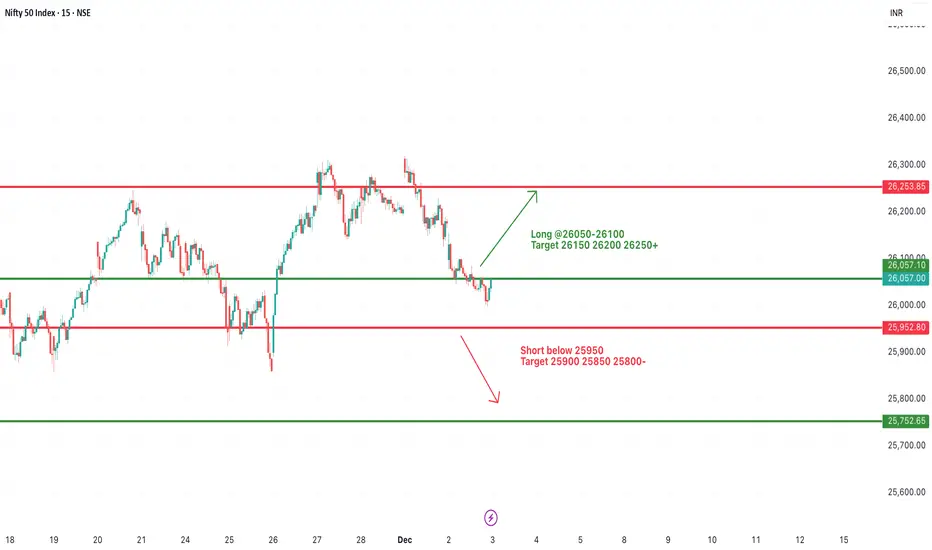
#NIFTY Intraday Support and Resistance Levels - 03/12/2025Nifty is likely to open in negative territory today. This signals that sellers still have a slight upper hand as the index trades near the lower end of its recent swing structure. A negative start also suggests caution from buyers. they may wait for stability before attempting any reversal. If Nifty manages to recover after the open and sustain above the 26050 to 26100 zone. the long setup activates. This level marks the immediate intraday hurdle. clearing it can trigger a short-covering bounce toward 26150, 26200, and 26250+. A sustained push above 26250 will strengthen the upside tone, indicating that buyers are willing to defend higher levels again.
If the index fails to hold early attempts to recover and slips below 25950, weakness will intensify. This breakdown activates the short setup with downside targets of 25900, 25850, and 25800-. A move below 25800 will confirm continued pressure, opening room for a drift toward the lower support near the 25750 area. This would signal that sellers remain firmly in control.
Overall, with a negative opening, the first bounce after the open will be critical. If that bounce gets sold into, the bearish continuation is likely. If buyers absorb the sell-off and push back through 26050 to 26100, the day can turn into a recovery-driven session. Watching the trigger zones closely will help decide whether the market remains weak or attempts a reversal.
Trade ideas
How to Understand Trading-view InterfaceWe provide Trading-view interface in a short way in this video introduction on Trading-view interface.
This video provides a clear and structured walkthrough of the Trading-View interface. It covers chart layout, drawing tools, timeframes, market watchlist in a simple and organized manner to help users understand the platform more effectively.

Nifty Intraday Analysis for 02nd December 2025NSE:NIFTY
Index has resistance near 26375 – 26425 range and if index crosses and sustains above this level then may reach near 26600 – 26650 range.
Nifty has immediate support near 25975 – 25925 range and if this support is broken then index may tank near 25750 – 25700 range.

NIFTY KEY LEVELS FOR 02.12.2025NIFTY KEY LEVELS FOR 02.12.2025
Timeframe: 3 Minutes
If the candle stays above the pivot point, it is considered a bullish bias; if it remains below, it indicates a bearish bias. Price may reverse near Resistance 1 or Support 1. If it moves further, the next potential reversal zone is near Resistance 2 or Support 2. If these levels are also broken, we can expect the trend.
When a support or resistance level is broken, it often reverses its role; a broken resistance becomes the new support, and a broken support becomes the new resistance.
If the range(R2-S2) is narrow, the market may become volatile or trend strongly. If the range is wide, the market is more likely to remain sideways
please like and share my idea if you find it helpful
📢 Disclaimer
I am not a SEBI-registered financial adviser.
The information, views, and ideas shared here are purely for educational and informational purposes only. They are not intended as investment advice or a recommendation to buy, sell, or hold any financial instruments.
Please consult with your SEBI-registered financial advisor before making any trading or investment decisions.
Trading and investing in the stock market involves risk, and you should do your own research and analysis. You are solely responsible for any decisions made based on this research

NIFTY Levels for Today
Here are the NIFTY's Levels for intraday (in the image below) today. Based on market movement, these levels can act as support, resistance or both
Please consider these levels only if there is movement in index and 15m candle sustains at the given levels. The SL (Stop loss) for each BUY trade should be the previous RED candle below the given level. Similarly, the SL (Stop loss) for each SELL trade should be the previous GREEN candle above the given level.
Note: This idea and these levels are only for learning and educational purpose.
Your likes and boosts gives us motivation for continued learning and support.
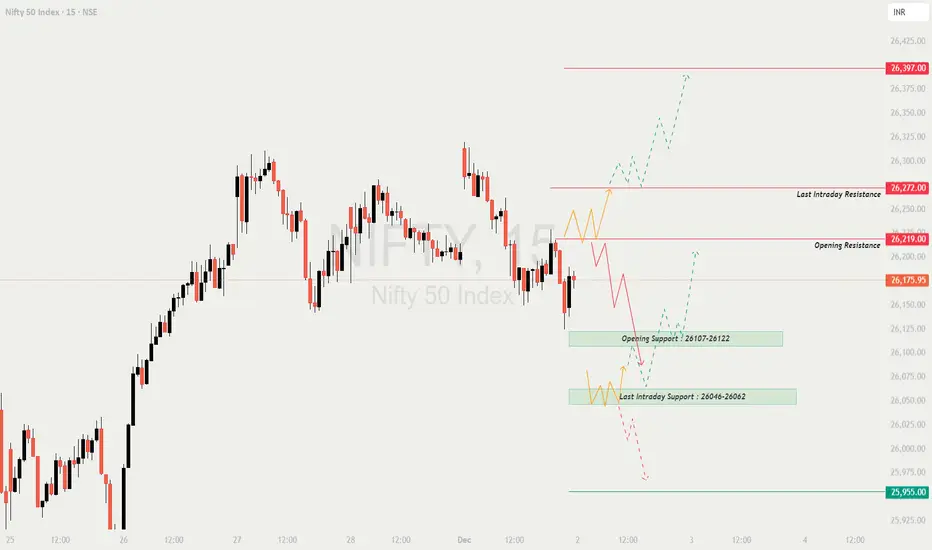
NIFTY : Trading levels and Plan for 02-Dec-2025📊 NIFTY TRADING PLAN — 02 DEC 2025
Nifty closed near 26,175, right between the Opening Resistance (26,219) and Opening Support (26,107–26,122).
The market is currently in a low-momentum, direction-hunting phase, where the opening behaviour will determine the next trend leg.
The structure shows clean supply zones above and strong demand zones below, meaning both sides have potential — but only confirmation-based trading is safe.
🔍 Key Intraday Levels
🟥 Opening Resistance: 26,219
🟥 Last Intraday Resistance: 26,272
🟥 Major Breakout Level: 26,397
🟩 Opening Support: 26,107 – 26,122
🟩 Last Intraday Support: 26,046 – 26,062
🟩 Major Breakdown Level: 25,955
🟢 SCENARIO 1 — GAP-UP OPENING (100+ Points)
If Nifty opens near 26,260–26,300, price opens right at or above resistance.
If price sustains above 26,219 for 10–15 minutes →
Upside targets: 26,272 → 26,330 → 26,397
This zone becomes a continuation breakout if volumes support.
If Nifty rejects 26,219–26,272 (wick rejections, long red candle) →
Expect a retracement towards:
➡️ 26,175 → 26,122
Best Long Setup:
Breakout above 26,272 → Retest → Bullish candle → Target 26,330 / 26,397
Avoid early shorting on gap-ups —
fakes are common near resistance clusters.
📘 Educational Note:
A gap-up directly into resistance requires patience.
Breakouts without retests often fail.
Retests confirm whether buyers truly control the level.
🟧 SCENARIO 2 — FLAT OPENING (26,150–26,190)
A flat open places Nifty between support and resistance. Expect early indecision.
Upside trigger → Break and sustain above 26,219.
Targets → 26,272 → 26,330
Downside trigger → Break below 26,122.
Targets → 26,062 → 26,046
The zone 26,175–26,200 is a noise range. Avoid trading inside it.
Two safe setups:
✔️ Breakout & Retest above 26,219
✔️ Breakdown & Retest below 26,122
💡 Educational Tip:
Flat openings give the cleanest structure of the day.
Wait for the breakout from the initial range (first 3–4 candles).
Impulse moves from the flat zone lead to strong trends.
🔻 SCENARIO 3 — GAP-DOWN OPENING (100+ Points)
If Nifty opens around 26,050–26,090, price enters the demand zones.
If support 26,062–26,046 holds and higher-low structure forms →
Reversal upside targets → 26,122 → 26,175 → 26,219
If 26,046 breaks →
Sharp downside possible →
➡️ 26,000 → 25,955 (major support)
This is a crucial liquidity zone.
Only sell BELOW 25,955 with confirmation.
Targets: 25,900 → 25,850
Reversal trades are valid ONLY after a bullish confirmation candle in the support zone.
📘 Educational Note:
Gap-downs into strong support often cause big traps for late sellers.
Wait for price to show exhaustion before buying —
Higher low + strong bullish candle = safest reversal pattern.
💼 RISK MANAGEMENT TIPS FOR OPTION TRADERS 💡
Avoid trading the first 5 minutes after the open.
Use ATM or ITM options for directional trades.
Set SL based on chart level, not premium price.
Never average a losing trade — cut and re-enter if needed.
Trail stop-loss after first target to lock profits.
Weekly expiry days → avoid overtrading during volatility spikes.
High VIX → Prefer spreads over naked buying.
⚠️ Golden Rule:
Be a risk manager first, a trader second.
Capital safety guarantees longevity.
📌 SUMMARY
Bullish Bias Above:
✔️ 26,219 → 26,272 → 26,330 → 26,397
Bearish Bias Below:
✔️ 26,122 → 26,062 → 26,046 → 25,955
Reversal Zones:
🟩 26,107 – 26,122 (Opening Support)
🟩 26,046 – 26,062 (Last Intraday Support)
🟥 26,219 – 26,272 (Heavy Resistance)
Danger / No-Trade Zone:
⚠️ 26,165–26,200 (Choppy, low-quality zone)
🧾 CONCLUSION
Nifty is at a decisive stage where both sides are open.
The day’s trend will be controlled by these key triggers:
✔️ Bullish only above 26,219
✔️ Bearish below 26,122
✔️ Strong breakout only above 26,272
✔️ Major breakdown only below 25,955
Trade with confirmation, respect levels, and avoid emotional entries.
Let market structure guide your trades — not impulses.
⚠️ DISCLAIMER
I am not a SEBI-registered analyst.
This analysis is purely for educational purposes.
Please consult your financial advisor before making trading decisions.
NFTY-50nifty my view bullish side 1st correction till 26061 tp 25970 buying zone if there creat bullish set-up then buy with validation below 25755.upside bias 26595/27050/27550

Is this a sign of REVERSAL!?As we can see NIFTY has formed more like a doji candle which shows immense indecision despite the strong weakness. It can also be been that this candle has been formed around the trendline hence unless this candle's low is broken and sustained below, every dip can bought. So, plan your trades accordingly and keep watching everyone.

Nifty Intraday Analysis for 03rd December 2025NSE:NIFTY
Index has resistance near 26225 – 26275 range and if index crosses and sustains above this level then may reach near 26425 – 26475 range.
Nifty has immediate support near 25825 – 25775 range and if this support is broken then index may tank near 25625 – 25575 range.

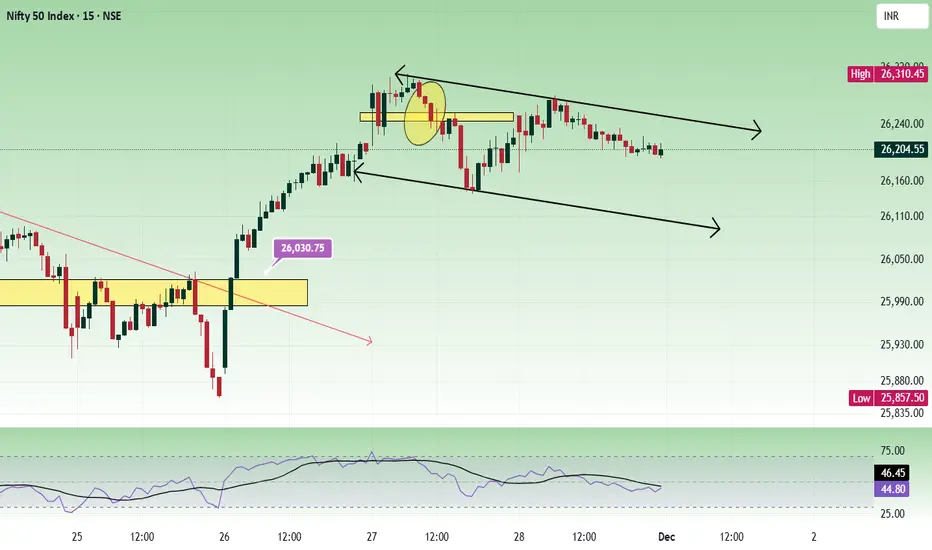
Will NIFTY take support at 26000 !?As we can see finally fell from our level as soon as it broke and fell unidrectionally as analysed. Moreover we can see it is trading around important psychological level of 26000 which is also a important demand zone, moreover it is also trading at important trend line support so any signs of rejection from this trend line could show strong reversal so plan your trades accordingly and keep watching everyone.

NIFTY Cup & Handle pattern price action-Trend - Bullish
-Pattern - Cup & Handle
-Break out & retest
-Current week price is on pull back from ATH
Target - 30,800 Level

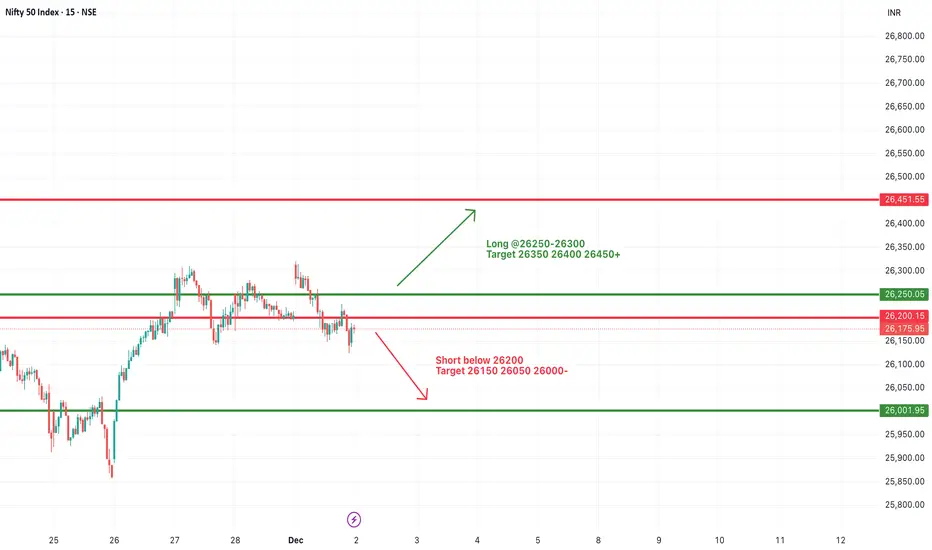
#NIFTY Intraday Support and Resistance Levels - 02/12/2025Nifty is expected to open flat today, indicating a neutral start as the index continues to move within a tight range after recent sideways sessions. A flat opening near the midpoint of the structure suggests that the market is waiting for a clear directional trigger before committing to a strong move. On the upside, if the index sustains above the 26250–26300 zone, the long setup becomes active with upside targets of 26350, 26400, and 26450+. A breakout above 26450 can further extend bullish momentum toward the next significant resistance at 26500 and potentially higher levels if the buying interest strengthens.
On the downside, immediate weakness will only be confirmed if Nifty breaks below the 26200 level, which activates the short setup with downside targets of 26150, 26050, and 26000-. A break below this zone would indicate a continuation of the selling pressure that has appeared near the top of the consolidation structure. If the index slips further toward the 26000 support band, lower levels may come into focus, especially if broader sentiment remains weak.
Overall, with a flat opening expected, the market may remain range-bound during the initial hour until a decisive breakout or breakdown occurs from the key levels. Traders should be cautious during the early session, as the market may show choppy movements before establishing a clear trend for the day.
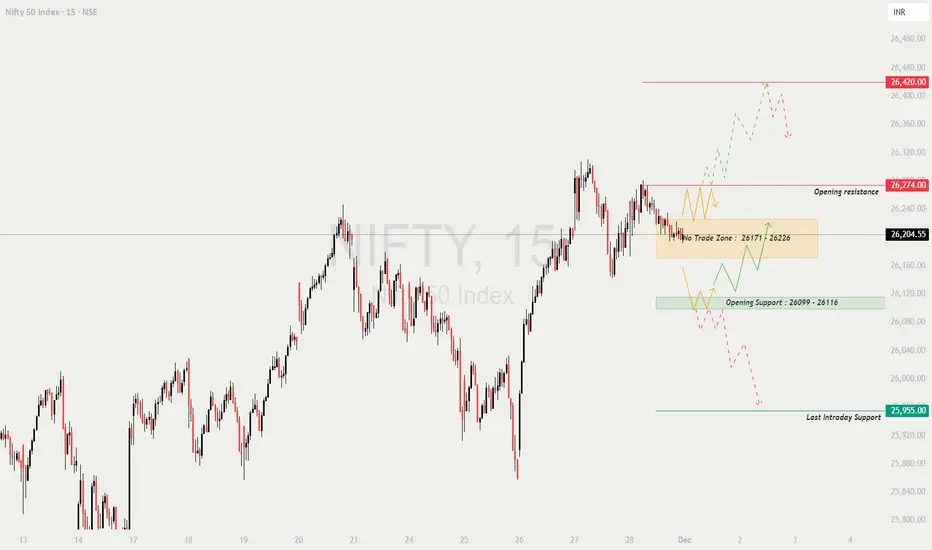
NIFTY : Trading levels and Plan for 01-Dec-2025📊 NIFTY TRADING PLAN — 01 DEC 2025
Nifty closed near 26,204, positioned right above the No-Trade Zone (26,171–26,226) and below the Opening Resistance (26,274).
The market is currently compressing inside a value area, meaning the reaction at the opening price will decide the day’s direction.
This session has clean levels for trend continuation and clear reversal zones, so disciplined execution is key.
🔍 Key Intraday Levels
🟧 No Trade Zone: 26,171 – 26,226
🟥 Opening Resistance: 26,274
🟥 Major Resistance: 26,420
🟩 Opening Support Zone: 26,099 – 26,116
🟩 Last Intraday Support: 25,955
🟢 SCENARIO 1 — GAP-UP OPENING (100+ Points)
If Nifty opens around 26,300–26,360, it will open near or above the resistance cluster.
If price sustains above 26,274 for 10–15 mins →
⭐ Upside targets → 26,330 → 26,365 → 26,420 (Major Resistance)
This is the bullish continuation zone.
If price rejects 26,274–26,300, expect a drop toward:
➡️ 26,226 → 26,171
Best long setup →
Breakout above 26,274, followed by retest and a strong green candle.
Avoid shorting immediately in a gap-up — wait for a clean rejection wick.
📘 Educational Note:
Gap-ups near resistance often trap impatient buyers.
Always wait for a retest confirmation rather than buying the first candle.
🟧 SCENARIO 2 — FLAT OPENING (Near 26,180–26,220)
A flat open keeps Nifty inside the No-Trade Zone (26,171–26,226) — expect choppy movement initially.
Only trade after a breakout from the zone:
— Above 26,226 → Trend resumes upward
— Below 26,171 → Downtrend resumes
Breakout above 26,226 →
Targets → 26,260 → 26,274 → 26,330
Breakdown below 26,171 →
Targets → 26,099 → 26,060
Do NOT take trades inside 26,171–26,226.
This zone is deliberately marked as confusing and unreliable.
💡 Educational Tip:
Flat openings are ideal to observe market intent.
The first directional breakout after 15–20 mins usually leads the entire session.
🔻 SCENARIO 3 — GAP-DOWN OPENING (100+ Points)
A gap-down near 26,080–26,120 places price into the Opening Support Zone (26,099–26,116).
If support 26,099–26,116 holds with bullish rejection →
Upside targets → 26,171 → 26,226 → 26,274
If support breaks decisively →
Next downside → 26,020 → 25,955 (Last Intraday Support)
A strong bounce from 25,955 is a potential high-probability reversal zone.
If 25,955 breaks with volume →
Deeper downside → 25,880 → 25,825
📘 Educational Note:
Gap-down into a clean support often produces high-quality reversal trades —
but only once a higher low forms. Never pre-empt the reversal.
💼 RISK MANAGEMENT TIPS FOR OPTION TRADERS 💡
Avoid trading the first 5 minutes — volatility is artificial.
Prefer ATM or ITM options for directional clarity.
SL should be based on chart levels, not premium amount.
Avoid averaging losers — if the structure breaks, exit immediately.
Use partial booking after each breakout target.
When VIX is low → Option buying works well.
When VIX rises → Switch to hedged strategies (spreads).
⚠️ Golden Rule:
Protect your capital. The goal is consistency, not hitting home runs every day.
📌 SUMMARY
Bullish above → 26,226
Targets → 26,260 → 26,274 → 26,330 → 26,420
Bearish below → 26,171
Targets → 26,116 → 26,060 → 25,955
Strong Reversal Zones:
🟩 26,099–26,116 (Opening Support)
🟩 25,955 (Major Support)
🟥 26,274 (Opening Resistance)
🟥 26,420 (Major Supply Zone)
No-Trade Zone:
⚠️ 26,171–26,226
🧾 CONCLUSION
Nifty will take a clear direction only after breaking out of the No-Trade Zone.
Trend clarity will come from:
✔️ A breakout above 26,226
✔️ A rejection from 26,274
✔️ A breakdown below 26,171
✔️ A bullish reversal from 26,099 or 25,955
Wait for confirmation; avoid overtrading in consolidation zones.
⚠️ DISCLAIMER
I am not a SEBI-registered analyst.
This analysis is for educational purposes only.
Always consult a certified financial advisor before trading or investing.
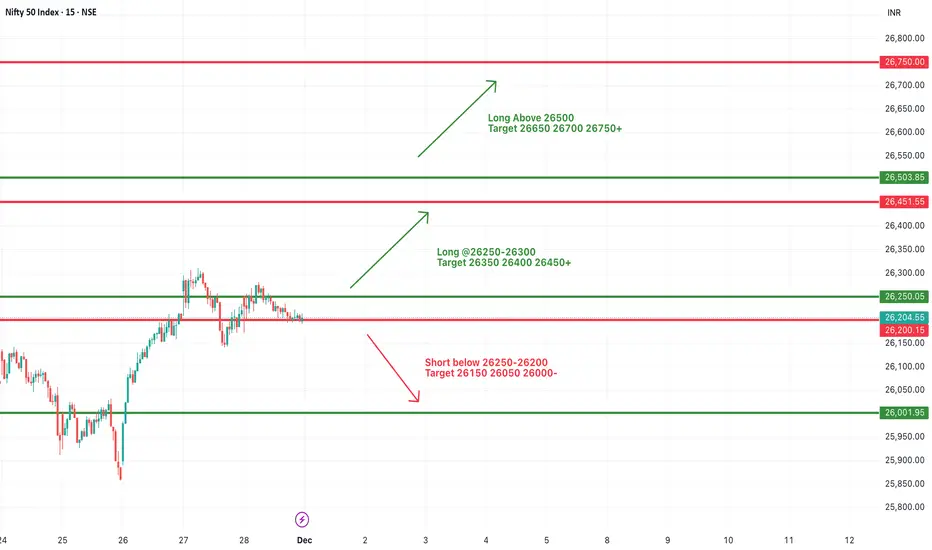
#NIFTY Intraday Support and Resistance Levels - 01/12/2025Nifty is expected to open with a strong gap-up near the 26450 zone, signalling sustained bullish momentum and renewed buying interest at higher levels. This opening zone is significant because it aligns closely with a key resistance area that the index has been attempting to break over the past few sessions. If Nifty manages to sustain above the 26250–26300 support band after the opening surge, it will reinforce bullish strength and keep the long setup active toward 26350, 26400, and back into the 26450 region. A stable price action above 26450 becomes particularly important, as it will indicate that buyers are willing to absorb supply at the upper levels and push the market into the next breakout phase.
A clear breakout above the psychological and technical resistance of 26500 could attract fresh buying momentum, opening the path toward higher targets at 26650, 26700, and even 26750+, especially if global cues support risk-on sentiment. In such a scenario, the market could experience a trend-driven rally with shallow pullbacks and continuous higher supports.
However, traders should also be cautious of any rejection from the 26450–26500 zone. Immediate weakness will only be confirmed if Nifty slips back below the 26250–26200 region, which would activate the short setup with downside targets at 26150, 26050, and 26000-. Such a move would indicate exhaustion of the gap-up momentum and potential profit booking by short-term participants.
Overall, with a gap-up opening near 26450, the broader short-term bias remains decisively positive. Sustaining above key breakout levels throughout the first hour will be crucial for maintaining momentum and validating the expected bullish continuation for the day.
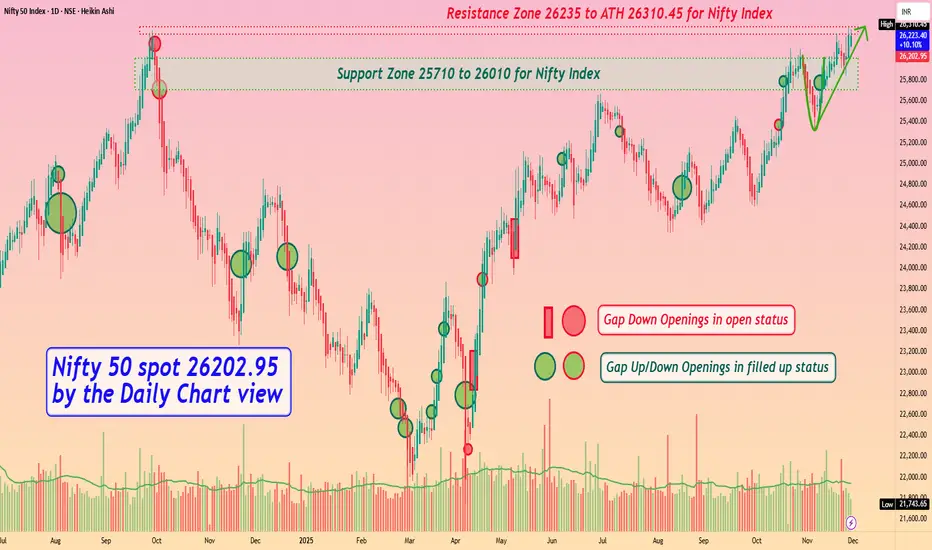
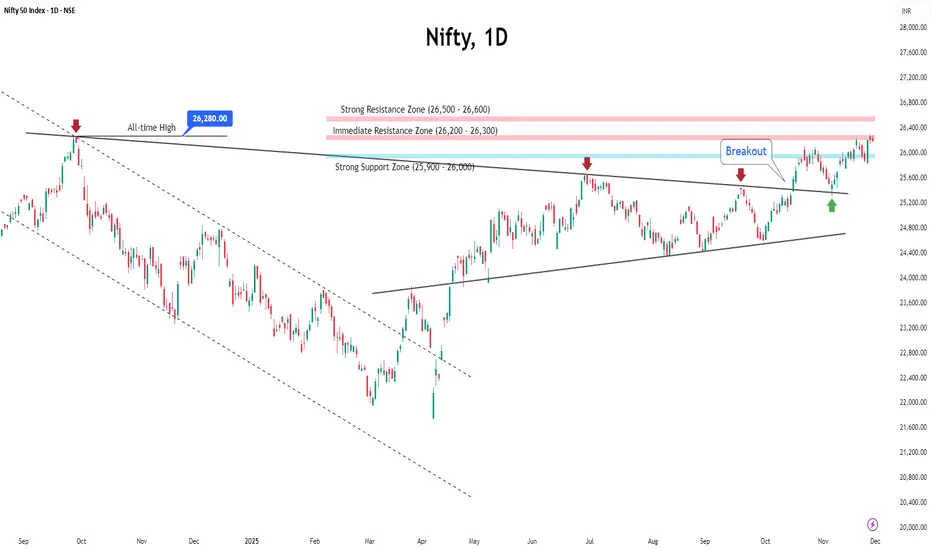
Nifty 50 spot 26202.95 by Daily Chart view - Weekly updateNifty 50 spot 26202.95 by Daily Chart view - Weekly update
- Support Zone 25710 to 26010 for Nifty Index
- Resistance Zone 26235 to ATH 26310.45 for Nifty Index
- Finally after 14 months Nifty 50 hit New Lifetime High Milestone 26310.45
- Hope to see Bullish momentum continue for Nifty 50 with positive expectation
Market Rotations in the Indian Stock MarketIntroduction
Market rotation is a concept widely used by investors and traders to understand how different sectors perform at various stages of the economic cycle. It refers to the movement of capital from one sector or asset class to another, often driven by economic trends, interest rate changes, government policies, or global market dynamics. In the Indian context, understanding market rotations is crucial due to the market's sectoral diversity and the influence of both domestic and international factors.
The Indian stock market, represented mainly by indices like the Nifty 50 and BSE Sensex, consists of multiple sectors such as Banking, IT, Pharmaceuticals, FMCG, Energy, Metals, and Infrastructure. Each sector reacts differently to economic conditions, and rotations across these sectors present opportunities for investors to optimize returns and reduce risks.
1. Understanding Market Rotation
Market rotation is essentially about capital flow between sectors. Investors rotate funds based on valuation, growth potential, interest rates, and macroeconomic trends. For example, during economic expansion, cyclical sectors like Banking, Automobiles, and Capital Goods tend to outperform, while defensive sectors like FMCG and Pharmaceuticals are preferred during economic slowdowns.
In India, rotations are influenced by:
Domestic factors: GDP growth, inflation, RBI policy rates, fiscal policies, and political developments.
Global factors: Crude oil prices, global interest rates, foreign institutional investor (FII) flows, and geopolitical risks.
2. Types of Market Rotations
Sector Rotation:
Movement of funds between sectors based on macroeconomic trends. Example: Investors move from IT and Pharma (defensive) to Banking and Auto (cyclical) during economic expansion.
Style Rotation:
Rotation between investment styles such as growth stocks and value stocks, or between large-cap, mid-cap, and small-cap stocks.
Asset Class Rotation:
Movement between different asset classes, e.g., equities to bonds or gold, often triggered by interest rate changes or global uncertainty.
3. Importance of Market Rotations
Understanding market rotations is crucial for multiple reasons:
Maximizing Returns: By following rotation trends, investors can position themselves in sectors likely to outperform.
Risk Management: Rotation helps avoid overexposure to underperforming sectors.
Timing Investments: Helps investors decide when to exit a sector that has peaked and enter one with higher potential.
Portfolio Diversification: Enhances risk-adjusted returns by shifting between cyclical and defensive sectors according to market phases.
4. Economic Cycles and Sector Performance in India
Market rotations often mirror the economic cycle, which can be broadly divided into four phases:
Early Expansion:
Characterized by recovery from recession, rising industrial production, and corporate earnings growth.
Sectors to watch: Capital Goods, Metals, Infrastructure, Auto.
Example: Post-pandemic India (2021-22) saw significant rotation into capital-intensive sectors due to economic revival and government infrastructure push.
Late Expansion:
Economic growth continues, but inflationary pressures increase.
Sectors to watch: Banking, Finance, Consumer Discretionary.
Example: During periods of strong credit growth, NBFCs and private banks often outperform.
Early Contraction / Slowdown:
Economic growth slows; earnings decline; interest rates may rise to control inflation.
Sectors to watch: FMCG, Pharmaceuticals, Utilities.
Reason: Defensive sectors maintain stable cash flows even during slowdown.
Recession:
Economic contraction, high unemployment, low consumption.
Sectors to watch: Gold, FMCG, Pharma.
Reason: Investors move to safe-haven assets and defensive equities.
5. Key Indian Sectors and Their Rotation Patterns
Banking & Financials:
Highly sensitive to interest rate cycles and credit growth.
Outperform during economic expansion and low interest rates.
Rotation cue: RBI policy changes, credit demand, and NPA trends.
IT & Software Services:
Considered defensive due to global revenue streams and recurring contracts.
Perform steadily during slowdowns but may lag during domestic growth surges.
Pharmaceuticals & Healthcare:
Defensive sector; stable revenue even during recessions.
Gains rotation interest during global uncertainty or domestic slowdown.
FMCG & Consumer Staples:
Defensive; high demand regardless of economic cycles.
Attract capital during slowdown and high inflation periods.
Automobile & Capital Goods:
Cyclical; benefit from rising disposable income and industrial demand.
Rotation flows in during early and late expansions.
Energy & Metals:
Sensitive to commodity prices and global demand.
Rotate in when industrial growth accelerates and global commodity prices rise.
6. Drivers of Market Rotation in India
RBI Monetary Policy:
Interest rate hikes often lead to rotation into defensive sectors like FMCG and Pharma.
Rate cuts encourage capital flow into cyclical sectors like Banking and Auto.
Government Policies:
Infrastructure spending or PLI schemes can trigger rotation into Capital Goods, Metals, and Electronics sectors.
Global Events:
Oil price spikes, US Fed rate decisions, and geopolitical risks influence rotations between Energy, IT, and Gold.
Valuation & Earnings:
Overvalued sectors see outflows, while undervalued sectors attract capital.
Investors rotate based on relative performance and P/E ratios.
Foreign Institutional Investor (FII) Flows:
FIIs significantly impact Indian markets. Strong inflows can rotate sectors like Banking, IT, and Pharma, while outflows often trigger a move to safe-haven sectors.
7. Strategies for Investors
Identify Macro Trends:
Track GDP growth, inflation, interest rates, and government policies to anticipate sectoral performance.
Follow Institutional Activity:
Monitor FII and domestic institutional investor (DII) flows to spot potential rotations.
Technical & Fundamental Analysis:
Use charts and valuation metrics to identify sectors or stocks ready for rotation.
Diversification Across Sectors:
Maintain exposure to both cyclical and defensive sectors to reduce risk.
Timing and Discipline:
Avoid chasing momentum; enter sectors early in rotation trends and exit before they peak.
8. Practical Examples of Market Rotation in India
2014-2015: Expansion in infrastructure and capital goods due to government’s Make in India initiative; rotation from defensive sectors to cyclical sectors.
2020-2021: Post-COVID economic recovery saw rotation into IT, Pharma, and FMCG sectors initially, followed by Banking and Auto as domestic demand revived.
2022-2023: Rising interest rates triggered rotation from rate-sensitive Banking to defensive FMCG and Pharma sectors.
9. Challenges in Predicting Rotations
Market Sentiment: Emotional trading can distort rational rotations.
Global Correlations: International shocks (oil, interest rates, geopolitical risks) can abruptly change rotation patterns.
Lag in Economic Data: Market reacts faster than published economic indicators.
Sector Concentration Risks: Over-reliance on one sector can magnify losses if rotation timing is wrong.
10. Conclusion
Market rotation is a powerful concept for Indian investors and traders seeking to maximize returns while managing risk. By understanding economic cycles, sector-specific drivers, and investor behavior, one can anticipate where capital is likely to flow next. In India’s diverse and dynamic market, rotation between defensive and cyclical sectors, as well as across asset classes, provides ample opportunities for disciplined and informed investors.
Successful rotation strategies require macroeconomic awareness, monitoring of institutional flows, valuation analysis, and timing discipline. While no strategy is foolproof, integrating market rotation principles into investment decisions can significantly enhance portfolio performance over time.

Nifty - Weekly review Dec 1 to Dec 5The price was rejected from the resistance at the 26300 - 26320 zone. Sustaining above this is important to move up further. The daily chart shows the price has formed an inside bar. This type of range, when broken with strength, can give good movement.
26000 is the nearby psychological support zone.
If the price opens gap down and takes support from the lower trend line of the channel, buy above 26150 with the stop loss of 26100 for the targets 26190, 26240, 26280, 26320, 26360 and 26420.
Sell below 25980 with the stop loss of 26030 for the targets 25940, 25900, 25860, 25820, 25760 and 25720.
Always do your analysis before taking any trade.
Nifty 50 for 1st December Here's my view on nifty 50 after carefully analysing volume, future and chart pattern.

NIFTY Hits New Highs but Breadth Weakens — What’s the Signal?The NIFTY 50 closed the week with a neat gain of 134.80 points (0.52%), touching fresh lifetime highs of 26,310.45.
Sounds impressive, right?
Yes — but there’s a twist.
A deeper look shows the Nifty 500 is still over 2.5% below its all-time high.
Meaning? This rally is not broad-based — it’s being carried by select large-cap heavyweights.
Meanwhile, the India VIX dropped 14.77% to 11.62, keeping volatility calm… for now.
◉ Key Levels to Watch This Week
Support Zones
● 26,000 — Strong and immediate support. Heavy put writing is visible here.
Resistance Zones
● 26,200 – 26,300 — Near-term supply zone
● 26,500 — Major resistance to beat
◉ Key Triggers This Week
1. RBI Policy – December 5
A 25 bps rate cut is widely expected, but the RBI may take a cautious approach as it balances low inflation with rising growth momentum.
2. Q2 GDP at 8.2%
The stronger-than-expected GDP print boosts sentiment but reduces the urgency for aggressive rate cuts, shifting the policy outlook toward a more measured stance.
3. India–US Trade Deal
Both countries are close to finalizing the agreement by year-end, which could support IT, manufacturing and export-focused sectors.
4. Rupee Weakness
The rupee’s slide to ₹89.49/$ raises import costs and potential inflation risks, adding pressure on the RBI while impacting corporate margins differently across sectors.
◉ December Outlook — What’s Likely Ahead?
● Base Case: NIFTY stays in a 26,000–26,500 range, with most upside already priced in.
● Bull Case: A breakout above 26,500 could send it toward 26,700 by month-end.
● Caution: If market breadth weakens further, volatility may creep back in.
◉ Strategy:
● As long as NIFTY holds above 26,000, sentiment stays positive.
● Dips above 26,000 = buying opportunity
● Avoid chasing breakouts blindly — focus on quality sectors and high-volume confirmations.
NIFTY – Elliott Wave Outlook (1H Chart) - 2-DEC-2025Wave 2 completed at 25,313 zone and now price is progressing in Wave 3 structure within the rising channel.
As long as 25,855 – 25,900 support holds, the bias remains bullish for continuation toward key resistance levels.
Key Levels
🔹 Supports: 25,855 / 25,313
🔹 Immediate Resistance: 26,377 – must hold breakout
🔹 Wave iii Target Zone: 27,050 – 27,500
🔹 Extended Target: 27,821+ (Wave 3 completion zone)
Elliott Wave View
Wave (i) and (ii) already visible within Wave 3
Current move expected to form Wave (iii) towards the green box region
Bullish continuation expected if price stays inside upward channel
Trading Plan
📌 Bullish above 26,000–26,100
👉 Buy on dips for 27,050 / 27,377 / 27,500 / 27,821+
🛑 Invalidation only below 25,855
Break below may retest 25,313
Sentiment
⭐ Structure remains bullish
⭐ Wave 3 usually strongest & longest wave — big momentum likely ahead
Disclaimer
Educational Elliott Wave study – not financial advice. Trade with risk management.

NIFTY BLOW OFF TOP WITH GDP DATAI see nifty forming a blow off top on monday with the Gdp data of 8.2 of q2 ..
monthly, weekly, daily top open high same
Later falls by 18800 in the black wxy pattern forming bigger time frame wave a.
Even the last leg of uside forming diamteric bow tie pattern of neo wave theory..
ABCDEFG.. all are coming close to complete..
this December will be great to watch..
If it happen in the said time line then we are going to see a big bear market..
Welcome to 1929 again.. Fingers crossed..
* ONLY FOR TUTORIAL PURPOSE, DONOT TRADE ON THIS VIEW..

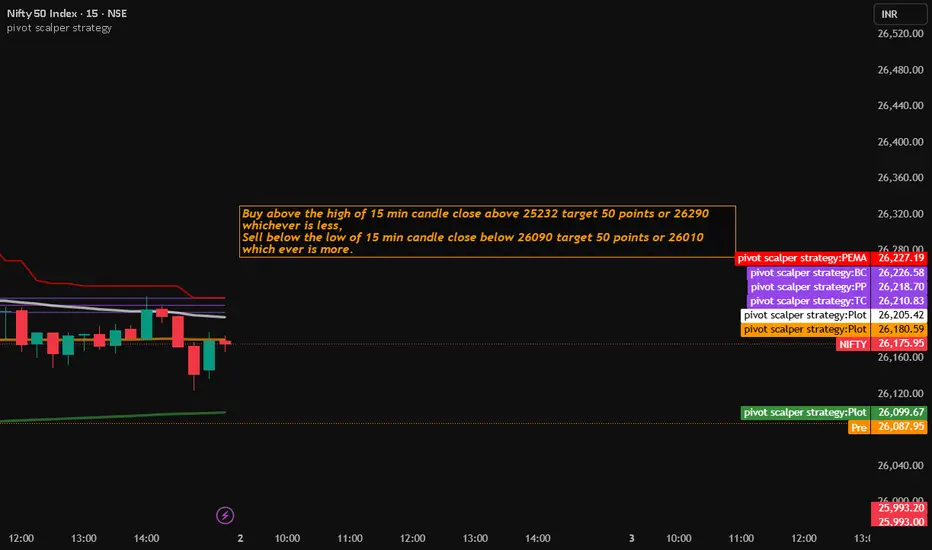
Nifty Trading Strategy for 02nd December 2025📈 NIFTY Trading Strategy – Buy & Sell Rules (15-Min Candle)
🟢 BUY SETUP
✨ Entry Condition
Wait for the 15-minute candle to close ABOVE 25,232.
The candle that breaks the level must be GREEN.
After it closes above the level, enter a Buy above the high of that candle.
🎯 Target
Target = 50 points from entry
OR
26,290
➡️ Use whichever is LESS.
🛑 Stoploss
50 points from entry.
⚠️ Additional Rule
If there is a big gap-up at the market open and price is near the target, DO NOT trade.
🔴 SELL SETUP
✨ Entry Condition
Wait for the 15-minute candle to close BELOW 26,090.
The candle that breaks the level must be RED.
After it closes below the level, enter a Sell below the low of that candle.
🎯 Target
Target = 50 points from entry
OR
26,010
➡️ Use whichever is MORE.
🛑 Stoploss
50 points from entry.
⚠️ Additional Rule
If there is a big gap-down at the market open and price is near the target, DO NOT trade.
⚠️ DISCLAIMER
📌 This is only for educational purposes.
📌 I am not SEBI registered.
📌 Trading in the stock market involves risk. Follow proper risk management.
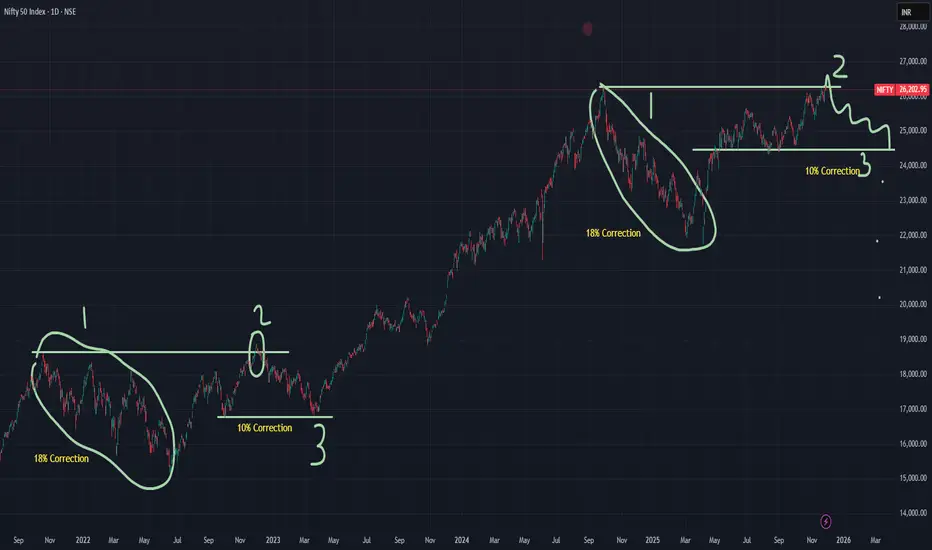
Nifty is showing a repeat pattern. Nobody can predict the direction of nifty. But we can observe the past pattern to help us take informed decision.
Nifty has touched a life time high, now if soon the high is not sustained then 10% correction is expected.
Please consult your financial advisor before investing.