28 Nov 2025 - The Stance is still Bullish + Nifty PostMortemNifty Stance Bullish 🐂
In last week's report, I had expressed doubts that the long-only stance may be under pressure, and we witnessed that on Tuesday, the 25th, when the EMAs crossed over.
I was hoping to see further bearish momentum, but the bottom was formed on that Tuesday itself, and from Wednesday, the 26th, we saw a huge reversal. Nifty went up 454+ points to hit a new high of 26310.
There was some profit-taking on Thursday, but markets held it ground by Friday. Currently, I am maintaining the long-only stance on Nifty, and since the EMAs are diverging, the next short signal could come only if we have a sharp fall or a completely flattish week.
Trade ideas

NIFTY can show unidirectional move from here!As we can see NIFTY is showing signs of indecisiveness from its ALL TIME HIGH and as per previous post, we also discussed previous swing can act as a resistance. We can expect NIFTY to show strong upmove above 25300 based on strong GDP quarterly posting hence we must keep these levels under observation and plan our trades accordingly.

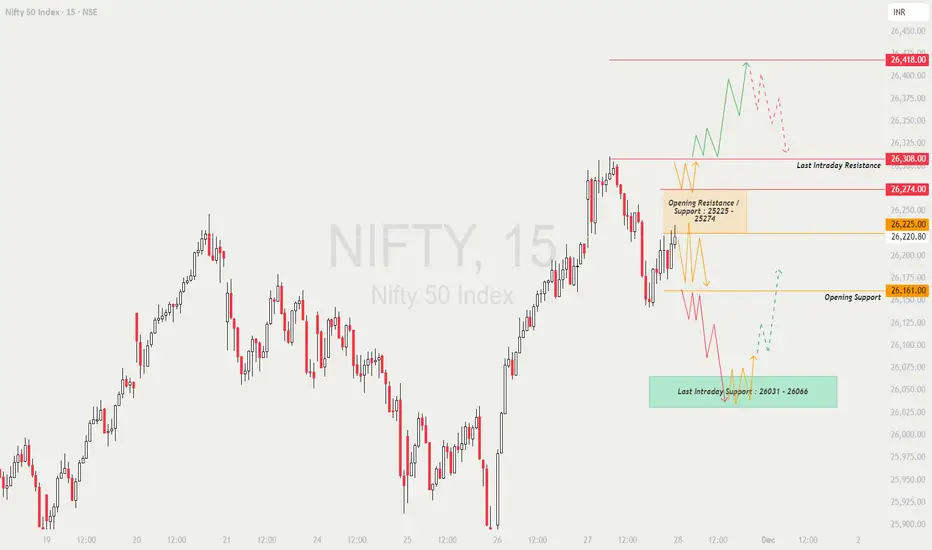
NIFTY : Trading levels and Plan for 28-Nov-2025📊 NIFTY TRADING PLAN — 28 NOV 2025
Nifty closed around 26,220, after bouncing strongly from lower levels and now sitting just below an important Opening Resistance / Support Zone (26,225–26,274).
The market is positioned between major overhead resistance and key intraday support.
This increases the importance of the opening direction.
Key Intraday Levels
🟧 Opening Resistance / Support Zone: 26,225 – 26,274
🟥 Last Intraday Resistance: 26,308
🟥 Profit Booking Zone: 26,418
🟩 Opening Support: 26,161
🟩 Last Intraday Support: 26,031 – 26,066
🟢 SCENARIO 1 — GAP-UP OPENING (100+ Points)
If Nifty opens around 26,300–26,350, it directly enters the resistance territory.
If price sustains ABOVE 26,308 for 10–15 minutes →
⭐ Expect bullish continuation toward → 26,360 → 26,395 → 26,418
If Nifty rejects 26,308 with sharp wicks →
Expect pullback toward → 26,274 → 26,225
Avoid long entries immediately at open — gap-ups near resistance can cause bull traps.
Best long setup = Breakout → Retest above 26,308 → Continuation.
📘 Educational Note:
Resistance-based gap-ups often create volatility. Always wait for confirmation candles, not emotional entries.
🟧 SCENARIO 2 — FLAT OPENING (26,200–26,250 Range)
A flat open places Nifty inside or just below the Opening Resistance / Support Zone.
A breakout above 26,274 →
Targets → 26,308 → 26,360 → 26,418
Failure to sustain above the zone may drag price back to 26,161.
Inside the 26,225–26,274 zone →
No high-probability trade. Avoid jumping into noise.
Best trades:
✔️ Breakout retest above 26,274
✔️ Breakdown below 26,161
✔️ Long from Last Intraday Support 26,031–26,066 (strong bounce zone)
💡 Educational Tip:
Flat openings provide the most reliable trend insight through the first 15-min candle. Let price choose direction — don’t force trades.
🔻 SCENARIO 3 — GAP-DOWN OPENING (100+ Points)
A gap-down around 26,080–26,120 brings Nifty near the Opening Support (26,161) area.
If price rejects 26,161 with bullish wick →
Reversal targets → 26,200 → 26,225 → 26,274
If price breaks 26,161 decisively →
Price will slide quickly toward the big support → 26,031–26,066
A strong bounce at 26,031–26,066 offers an attractive long opportunity.
If 26,031 breaks with momentum →
Expect downside extension → 25,980 → 25,940
📘 Educational Note:
Gap-downs into support often give excellent reversal trades — but NEVER without confirmation.
Watch for higher lows or bullish engulfing candles.
💼 RISK MANAGEMENT TIPS FOR OPTION TRADERS 💡
Avoid the first 5 minutes — large gap openings often reverse quickly.
Use ATM or ITM options for directional momentum.
NEVER average a losing option trade.
Use fixed SL based on structure, not on premium.
When VIX is low → prefer option buying.
When VIX is high → hedged option selling is safer.
Book partial profits near resistance zones like 26,308 & 26,418.
⚠️ Golden Rule:
Protect your capital first — good opportunities always come after clarity.
📌 SUMMARY
Bullish Above → 26,274
Targets → 26,308 → 26,360 → 26,418
Bearish Below → 26,161
Targets → 26,120 → 26,066 → 26,031 → 25,980
High-Risk Zones:
🟧 26,225–26,274 (Opening whipsaw zone)
🟥 26,308–26,418 (Profit booking region)
🧾 CONCLUSION
Nifty is approaching a strong overhead resistance zone, and the opening candle will decide whether we get a breakout continuation or a pullback day.
The highest-probability trades will come from:
✔️ Breakout retest above 26,274
✔️ Rejection / reversal at 26,308
✔️ Bounce from 26,031–26,066
✔️ Breakdown below 26,161 for momentum shorts
Trade only clean structures — avoid noise inside the middle consolidation zone.
⚠️ DISCLAIMER
I am not a SEBI-registered analyst.
This analysis is meant only for educational purposes.
Please consult a certified financial advisor before trading or investing.
1-Day (Daily) & 4H Chart — What It Says Now🔎 1-Day (Daily) Chart — What It Says Now
📌 Moving Averages Extremely Supportive
All key moving averages — 5, 10, 20, 50, 100, and 200 DMA — continue to trend upward, with price comfortably trading above them.
This alignment reflects:
strong underlying demand
a sustained uptrend
buyers active on dips
Trend structure: Clean, bullish, and stable.
📌 Momentum Indicators Point Upwards
RSI (14) hovering in mid-60s → bullish but not overbought
MACD remains in positive territory, signal line crossover holding
Stochastic %K is elevated → reflects strength and sustained momentum
Overall, momentum is firmly bullish, with no signs of exhaustion yet.
📌 Pivot Levels Active
Price is reacting near key pivot zones, meaning:
Intraday swings may occur
Breakouts or rejections can come quickly
Supports/resistances are likely to be respected
This adds importance to short-term decision zones.
📌 Overall Daily Trend
✔ Strong uptrend
✔ Healthy momentum
✔ Above all major moving averages
✔ Buyers retain dominance
Bottom Line:
Nifty’s daily structure is bullish. Trend remains intact unless key support levels break decisively.
⏳ 4-Hour (4H) Chart — Short-Term Market Behavior
The 4H chart adds more detail to shorter-term moves and shows the internal strength of the ongoing trend.
📌 4H Trend Still Up, but Entering a Decision Zone
Price action shows:
Higher lows
Higher highs
Strong support clusters on dips
Sellers showing mild presence near upper resistances
This timeframe suggests mild consolidation within a bullish structure.
📌 4H Indicators
RSI mildly elevated
MACD flattening slightly as price approaches resistance
Price compression possible before a breakout
This hints at short-term stabilization — a pause rather than reversal.
📈 4-Point Broader Chart / Market Outlook (Short → Medium Term)
1️⃣ Near-Term Upside Target / Resistance Zone
Key resistance seen at 26,440 – 26,800.
This is the zone to watch for:
Breakout → fresh rally
Rejection → consolidation or dip
A decisive close above this range may open the gate for new highs.
2️⃣ Key Support Levels to Track
Immediate support: 26,100 – 26,200
If this breaks, deeper supports lie near previous consolidation levels.
As long as Nifty holds above these, the structure remains bullish.
3️⃣ Volatility & Consolidation Risk
Despite bullish trend, momentum is steady, not euphoric:
ADX not extremely strong → trend is healthy but not overheated
Possible sideways movement
Integrated consolidation before next leg
Ideal for range trading until breakout clarity emerges.
4️⃣ Sectoral & Breadth Context
Even though headline Nifty is strong:
Media, Realty, IT have underperformed
Breadth is not fully aligned with index strength
Heavyweight stocks driving the rally
Sector rotation may be key for medium-term sustainability.
🎯 Key Scenarios Going Forward
📌 1. Bullish Continuation (High Probability)
If Nifty holds 26,100–26,200 and breaks 26,440–26,800 →
Upside expansion likely, trend remains intact.
📌 2. Range / Consolidation (Likely Before Breakout)
Mixed breadth + moderate volatility suggests
Brief sideways movement before decisive direction.
📌 3. Pullback / Correction (Risk Trigger)
If supports break along with sectoral weakness →
Nifty may test lower supports with increased volatility.
💼 What This Means for Traders & Investors
For Traders
Bullish bias is intact
Prefer trades on breakouts or support bounces
Avoid premature entries near resistance
Manage risk due to short-term consolidation risk
For Medium-Term Investors
Trend is not showing signs of topping
Continue exposure but track sectoral leadership
Focus on stock-specific strength rather than index alone
Risk Management
Avoid over-leveraging as volatility pockets may emerge
Respect support levels
Watch the 26,440–26,800 zone for next directional cue
📌 Final Combined View (1D + 4H)
Nifty remains in a strong, well-supported uptrend across both timeframes.
Daily chart shows broad strength → 4H chart shows controlled consolidation.
Market is setting up for a potential breakout, though short-term range-bound action is likely until price crosses key levels.

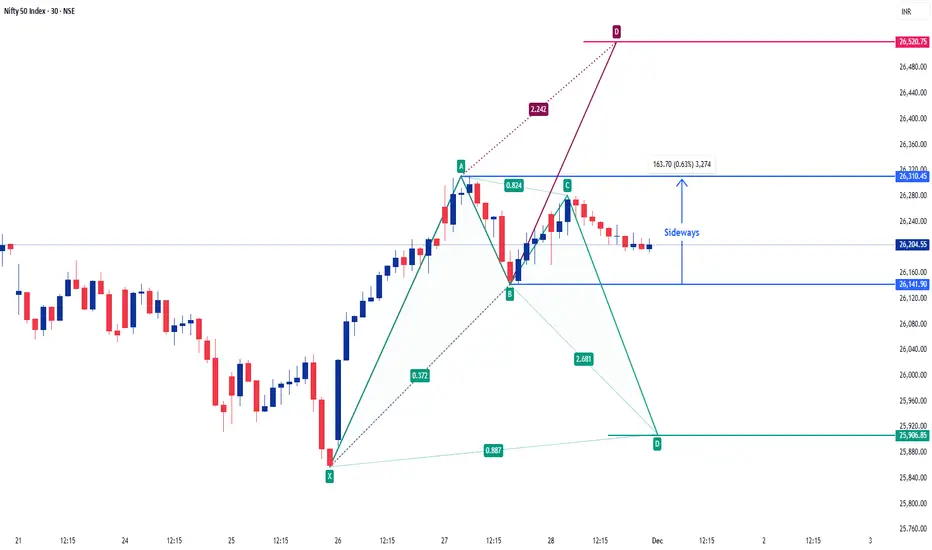
#Nifty Weekly 01-12-25 to 05-12-25#Nifty Weekly 01-12-25 to 05-12-25
26100-26300 is the sideways range(no trade zone for option buyers) for next week.
If Nifty sustains above 26320, ABCD gets activated and targets are 26400/26500.
If Nifty trades below 26100. XABCD gets activated and targets are 26000/25900.
View: Sideways to bearish, reason is Divergence in Higher TF's.
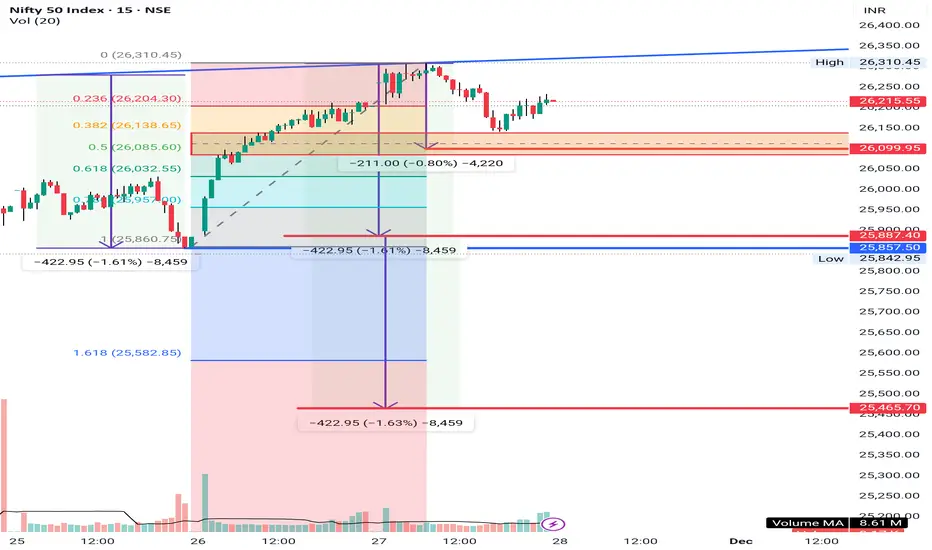
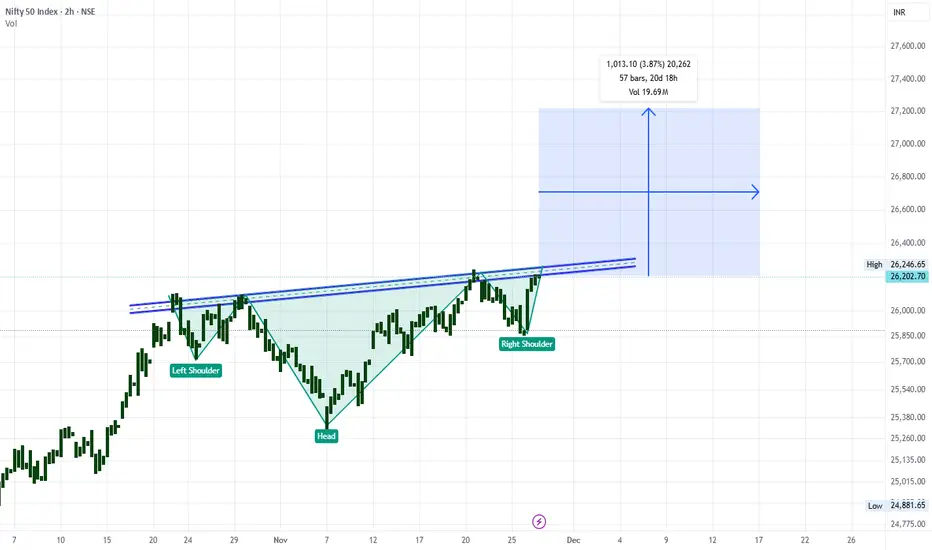
Head and shoulder pattern in NiftyHead and shoulder pattern in Nifty (SL on 15 min. candle close)
Short Nifty @26205
SL 26247
Target : 25496-25469
CMP 26205 @ Nov 26, 2025

NIFTY - Updated viewRejected at upper resistance line and resistance levels.
Immediate support : 25850, 25750
Immediate resistance : 26100, 26250.

Nifty Analysis for Nov 27, 2025Wrap-up:
Nifty has completed major wave 1 and wave 2 is in progress of which internal wave A is formed and heading towards internal wave B.
What I’m Watching for Nov 27, 2025 🔍
Short nifty only if it breaks 26156 SL above 26216 for a target of 25673-22596 (SL on 15 min. candle close).
Disclaimer: Sharing my personal market view — only for educational purpose not financial advice.

Nifty 50 Price Structure Analysis [27/11/2025: Thursday]Nifty 50 Price Structure Analysis for 27th November 2025. The day is Thursday.
(1) Monthly Timeframe:
Strong green candle. Major support is at level 26000. The view is bullish.
(2) Weekly Timeframe:
Green paper umbrella candle. But there is no sign of weakness or trend reversal. A very strong buying force is available from level 25850. Major support zone is in the zone - 26050 - 26000. The view is bullish.
(3) Daily Timeframe:
Perfect bullish marubozu. The candle engulfed the 4-day candle body. Very strong support in the zone 26100 - 26000. No bearish trade till the zone is breached. The view is bullish.
(4) 30-Minute Timeframe:
Strong bullish trend. Any down move should be doubted; rather, it will be an opportunity to go long. Strong support is in the zone 26100 - 26000. No bearish trade. The view is bullish.
Bullish Set-Up:
(i) Price sustains above the opening price.
(ii) Price stays above the level 26100.
Bearish Set-Up:
(i) Price sustains below the opening price.
(ii) Price breaches the zone of 26100 - 26000 and sustains below it.
Expectation: There is a higher probability of bullish continuation. Take no bearish trade.
Event: SENSEX monthly expiry. No other major trend.
NOTE:
"Mark your points. Trade your points. Price is God. Anything can happen. Trade what you see, not what you believe."
Happy Trading!

NIFTY KEY LEVELS FOR 28.11.2025NIFTY KEY LEVELS FOR 28.11.2025
Timeframe: 3 Minutes
If the candle stays above the pivot point, it is considered a bullish bias; if it remains below, it indicates a bearish bias. Price may reverse near Resistance 1 or Support 1. If it moves further, the next potential reversal zone is near Resistance 2 or Support 2. If these levels are also broken, we can expect the trend.
When a support or resistance level is broken, it often reverses its role; a broken resistance becomes the new support, and a broken support becomes the new resistance.
If the range(R2-S2) is narrow, the market may become volatile or trend strongly. If the range is wide, the market is more likely to remain sideways
please like and share my idea if you find it helpful
📢 Disclaimer
I am not a SEBI-registered financial adviser.
The information, views, and ideas shared here are purely for educational and informational purposes only. They are not intended as investment advice or a recommendation to buy, sell, or hold any financial instruments.
Please consult with your SEBI-registered financial advisor before making any trading or investment decisions.
Trading and investing in the stock market involves risk, and you should do your own research and analysis. You are solely responsible for any decisions made based on this research.

NIFTY Levels for Today
Here are the NIFTY's Levels for intraday (in the image below) today. Based on market movement, these levels can act as support, resistance or both
Please consider these levels only if there is movement in index and 15m candle sustains at the given levels. The SL (Stop loss) for each BUY trade should be the previous RED candle below the given level. Similarly, the SL (Stop loss) for each SELL trade should be the previous GREEN candle above the given level.
Note: This idea and these levels are only for learning and educational purpose.
Your likes and boosts gives us motivation for continued learning and support.

NIFTY INDEXNifty at all time high made with double top with divergence with strong support at 26,140 level. IF NIFTY breakdowns 26,140 we can see next support at 25,850
Nifty Analysis for Nov 21, 2025Wrap-up:
Nifty breaks previous high 26104, now pattern has been changed and nifty now formed internal wxy pattern and major ABC wave pattern of which wave 5 is expected to be completed at 26104.
What I’m Watching for Nov 21, 2025 🔍
Short nifty only if it breaks 26097 SL above 25857 for a target of 25934-25892 and 25673-22596 (SL on 15 min. candle close).
Buy nifty only if takes support at 26154 for a maximum target of 26433 only intraday with a sl below 26097.
Disclaimer: Sharing my personal market view — only for educational purpose not financial advice.

NIFTY KEY LEVELS FOR 27.11.2025NIFTY KEY LEVELS FOR 27.11.2025
Timeframe: 3 Minutes
If the candle stays above the pivot point, it is considered a bullish bias; if it remains below, it indicates a bearish bias. Price may reverse near Resistance 1 or Support 1. If it moves further, the next potential reversal zone is near Resistance 2 or Support 2. If these levels are also broken, we can expect the trend.
When a support or resistance level is broken, it often reverses its role; a broken resistance becomes the new support, and a broken support becomes the new resistance.
If the range(R2-S2) is narrow, the market may become volatile or trend strongly. If the range is wide, the market is more likely to remain sideways
please like and share my idea if you find it helpful
📢 Disclaimer
I am not a SEBI-registered financial adviser.
The information, views, and ideas shared here are purely for educational and informational purposes only. They are not intended as investment advice or a recommendation to buy, sell, or hold any financial instruments.
Please consult with your SEBI-registered financial advisor before making any trading or investment decisions.
Trading and investing in the stock market involves risk, and you should do your own research and analysis. You are solely responsible for any decisions made based on this research.

#NIFTY Intraday Support and Resistance Levels - 27/11/2025Nifty is expected to open with a gap-up today, signalling strong bullish sentiment as price approaches the crucial resistance zone near 26250. If the index sustains above 26250 after the opening, the long setup becomes active with upside targets of 26350, 26400, and 26450+. A strong breakout above this level can extend the move further toward higher zones.
On the downside, a reversal short opportunity will emerge only if Nifty rejects the 26250–26200 zone, activating downside targets at 26150, 26050, and 26000-. Additionally, a long setup remains valid above the 26000–26050 zone with targets of 26150, 26200, and 26250+. With a gap-up opening, the early trend stays bullish, but sustaining above the breakout level is essential for continuation toward higher targets.

NIFTY Levels for TodayHere are the NIFTY's Levels for intraday (in the image below) today. Based on market movement, these levels can act as support, resistance or both
Please consider these levels only if there is movement in index and 15m candle sustains at the given levels. The SL (Stop loss) for each BUY trade should be the previous RED candle below the given level. Similarly, the SL (Stop loss) for each SELL trade should be the previous GREEN candle above the given level.
Note: This idea and these levels are only for learning and educational purpose.
Your likes and boosts gives us motivation for continued learning and support.
Nifty Hourly Chart suggest Inverse H&S Pattern targets 27200+Nifty Hourly Chart suggest Inverse H&S Pattern targets 27200+ by Dec End.
LTP - 26205
Targets 27200+
Timeframe - 15-25 trading sessions.
Happy Investing.
Nifty LongNifty Support on 1H TF.
Expecting Liquidity fill around 25700 and then Upwards 26000 which is its max pain from past one month.
Also Fib aligned to 0.6
Entry - 25700
TGT - 26000
SL - 25650
I am in Learning Phase.

Nifty 11th Dec OutlookNifty closed with weak volume, and that’s exactly what the structure suggests ahead of two major catalysts:
1) The US Federal Reserve rate decision tonight
2) BSE:SENSEX expiry tomorrow
This combination often suppresses volatility before the event and releases volatility after, which is visible on today’s chart.
1. Low Volume = Risk-Off Positioning, Not Bearish Conviction
Today’s declining volume reflects institutional caution:
Fed outcome tonight → uncertainty in US yields & dollar
Sensex expiry tomorrow → option writers avoid taking directional exposure
USD/INR at extreme levels
Nifty at critical HTF supports → shorts avoid pressing aggressively
This leads to range-bound weakness, not a breakdown.
2. Key Technical Levels Align With Higher-Timeframe Structure
Daily chart shows Nifty hovering near important supports:
25,700 → first structural support
25,550–25,600 → major higher-timeframe demand zone
RSI on the daily has dipped near 50, which historically acts as a pivot for relief bounces unless macro sentiment is extremely negative.
Importantly, Nifty rarely breaks below daily RSI-50 without a deep global risk trigger. At present, no such domestic negative catalyst exists.
3. Why a Sharp Fall Is Unlikely Unless the Fed Surprises
Two strong supports lie directly below price: 25,700 and 25,500.
Both require significant volume expansion to break.
Given:
Muted institutional participation today
Expiry pinning tomorrow
Traders waiting for clarity
No negative domestic triggers
A strong direct breakdown is lower probability.
If the Fed delivers a cut (25 or 50 bps) with neutral/dovish guidance, the knee-jerk reaction may even favour a bounce, not a continuation of the fall.
4. Sensex Expiry Adds Another Layer of Price Compression
On the session before expiry, option writers:
Avoid committing to a direction
Keep the index pinned near max pain
Do not encourage volatility
Avoid large stop-runs or breakouts
This creates the low-range, low-volume drift we saw today.
Tomorrow, expect:
Early volatility due to Fed
Midday compression due to expiry
Final-hour positioning swings
5. Two Main Scenarios for Tomorrow
🟥 Scenario 1: Downside (needs Fed hawkishness)
Break of 25,700 opens 25,600 → 25,550
For deeper downside, Fed must surprise with a restrictive tone
Weak USD/INR or heavy FII selling would intensify this
But without strong volume, supports should hold.
🟩 Scenario 2: Upside / Relief Bounce (if Fed is neutral or dovish)
Nifty can rebound toward 25,900–26,050
Expiry pinning likely caps it below 26,200
RSI structure supports an upside reaction from current levels
This scenario is more consistent with today’s price behaviour.
6. My Bias
Base Case:
Sideways to slightly positive, unless the Fed delivers a negative surprise.
Directional clarity will likely appear after the first hour tomorrow, once global reactions settle and expiry flows align.
Conclusion
Today’s low volume was a sign of anticipation, not weakness.
Nifty is sitting near strong supports, and with Fed outcome + expiry both in play, the next move will be driven by global cues rather than pure technicals.
A sharp breakdown requires both volume and a negative macro shock — neither is present yet.
A relief bounce or sideways consolidation is the higher-probability outcome unless the Fed turns unexpectedly hawkish.

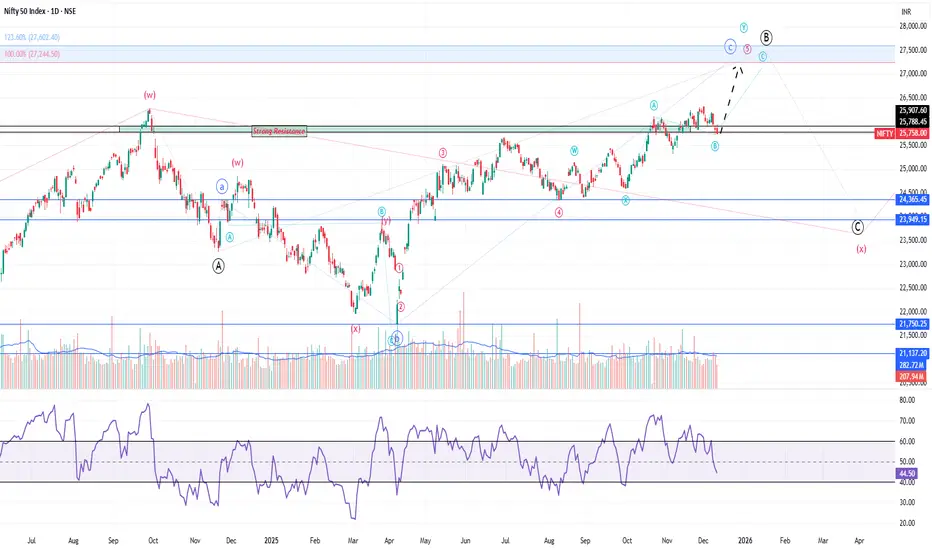
Positional View in Nifty till december, 2025 and January, 2026Wrap up:-
In wave 5 of c of b of X, Nifty is making wxy pattern. Wave w has been completed at 25153 and wave x at 24587 and heading towards internal wave y of wave 5.
In wave y of wave 5, Nifty has completed wave a at 26104 and b at 25728 and heading towards its wave c for a target of 27244.
Buy Nifty at cmp 25758 sl 25728 for a target of 27244 till december, 2025 or mid of january, 2026.
Disclaimer: Sharing my personal market view — only for educational purpose not financial advice.
25500 is coming up!!As we can see NIFTY had been weak throughout the day as analysed in our previous post. Now, we can see a pending gap which is yet yo be filled. Hence, we can expect NIFTY to continue its bearishness till 25500 which is its next important demand zone so plan your trades accordingly and keep watching everyone.

NIFTY : Trading levels and Plan for 11-Dec-2025📊 NIFTY TRADING PLAN — 11 DEC 2025
Nifty closed around 25,742, sitting just below the Opening Resistance / Support (25,813) and well below the Opening Resistance (25,894).
Price has shown weakness but is still near strong intraday supports from where reversals are possible.
Key Levels from Chart:
• Opening Resistance / Support: 25,813
• Opening Resistance: 25,894
• Last Intraday Resistance Zone: 25,973 – 26,007
• Opening + Last Intraday Support: 25,654 – 25,672
• Major Downside Support: 25,532
Directional bias will depend on whether price opens above or below 25,813.
🚀 1. GAP-UP OPENING (100+ points)
A gap-up above 25,840–25,880 pushes price near crucial resistance levels and may trigger bullish continuation if validated.
1. If price opens above 25,813 and retests successfully
• Do NOT chase the opening candle.
• Wait for a retest of 25,813 to confirm buyers are defending the zone.
• Long entries become valid on bullish wick rejection/CHoCH.
• Upside targets: 25,894 → 25,973 → 26,007.
• Partial booking advised near 25,894 due to historical rejection.
2. If price opens directly near 25,894 (Opening Resistance)
• Avoid immediate longs — this is a supply zone.
• If rejection occurs → Short entries valid only when price loses 25,813 again.
• Downside targets: 25,760 → 25,700.
3. If breakout sustains above 26,007
• Trend-day likely.
• Next resistance: 26,080–26,120 zone.
• Trail stop-loss aggressively to lock gains.
📌 Educational Note:
Gap-ups near resistance must be handled carefully — institutions often fade early strength. Retest entries protect from false breakouts.
⚖ 2. FLAT OPENING (around 25,730–25,770)
Flat opens indicate the market wants to test nearby levels before choosing direction.
1. If price reclaims 25,813 and sustains
• Strength returns to buyers.
• Break + retest of 25,813 = valid long setup.
• Targets: 25,894 → 25,973 → 26,007.
2. If price rejects 25,813
• Lower-highs indicate weakness.
• Short entries valid toward 25,700 → 25,654.
• Breakdown below 25,654 leads to further downside.
3. If price stays between 25,742–25,813 initially
• Expect sideways movements.
• Avoid trading inside this chop zone.
• Directional clarity only after a clean breakout.
📌 Educational Note:
Flat opens reveal early structure — let the market form its first higher-low or lower-high before taking trades.
📉 3. GAP-DOWN OPENING (100+ points)
A gap-down toward 25,650–25,700 brings price directly into strong intraday support.
1. If price opens inside 25,654–25,672 (Opening + Intraday Support)
• This is a high-probability reversal zone.
• Do NOT short immediately.
• Look for reversal signals — hammer, bullish engulfing, CHoCH.
• If confirmed → Long entries:
→ Targets: 25,742 → 25,813.
2. If price opens near 25,532 (Major Downside Support)
• Strong reaction expected here.
• Ideal place for long reversal setups.
• Targets: 25,654 → 25,700.
3. If price breaks below 25,532 decisively
• Avoid catching falling knives.
• Wait for a retest of 25,532.
• If retest rejects → Short continuation toward 25,460–25,420.
📌 Educational Note:
Gap-downs sweep liquidity; traders must wait for confirmation to avoid getting trapped in panic selling.
🛡 RISK MANAGEMENT TIPS FOR OPTIONS TRADERS
1. Avoid first 5 minutes of trading — premiums are unstable during gap openings.
2. Never buy far OTM options after gaps — IV crush can wipe out capital.
3. Always use price-level-based stop-loss, not premium SL.
4. Maintain strict risk per trade: 1–2% only.
5. High IV → Prefer option selling; Low IV → Option buying works better.
6. Book partial profits at key levels:
25,813 / 25,894 / 25,973 / 26,007
7. Avoid revenge trading — protect capital before chasing profits.
📌 SUMMARY & CONCLUSION
• Bullish bias begins only above 25,813, with targets toward 25,894 → 25,973 → 26,007.
• Neutral/Choppy zone: 25,742–25,813 — avoid taking trades inside until breakout.
• Strong downside reversal zones:
– 25,654–25,672
– 25,532
• Structure + confirmation = highest-probability trades.
• Respect risk — volatility increases near support zones.
⚠ DISCLAIMER
I am not a SEBI-registered analyst.
This trading plan is created solely for educational purposes and must not be treated as investment advice.
Always use personal judgment, risk management, and adapt to real-time market conditions.

Nifty Nifty is sitting at a crucial level once again, taking support near 25,750.
A breakdown below this zone could open the next support area around 25,450–25,350, offering a good short opportunity.
For a long setup, Nifty needs to break above 25,900 with a strong bullish candle.
The first 30-minute candle, followed by a confirming candle, will likely set the direction for the day.
Plan your trades accordingly.
✅ If you like my analysis, please follow me here as a token of appreciation :)
in.tradingview.com/u/SatpalS/
📌 For learning and educational purposes only, not a recommendation. Please consult your financial advisor before investing.
