Nifty 50 analysis for 11th December Nifty is bearish for me till we are below 26,000 on daily closing basis.
the view for tomorrow is sell on rise.
make sure to keep these charts levels marked on yours.
Trade ideas

Break of Structure & Time Cycle combination in NiftyFriends, we have mentioned many times before that when there is a Break of Structure in the index, and if the high and low of the candle that breaks that structure are considered, then if the market moves upwards, a 3% upside move is observed in the index, and if it breaks downwards, a 3% downside move is seen.
And this is indicated by the blue line in the chart.
And at the same time, you can see its 63- trading days cycle plotted here as well (black lines). By now, you must have understood that the candles of the time cycle, along with their highs and lows, act as support and resistance levels, and we have previously seen the market taking support around this area.
November 17th – this candle's high and low are very vital. The market has not yet broken the low of this candle, and if the market goes down, it might see a reversal near the low of that candle because the 3% move is around 25300.
And you can see we have also plotted the previous swing low here in the preview.
Whether we will see the support levels around 25300 in this area in the coming days, only time will tell. Until then, goodbye, take care, manage your risk while trading, and our main objective is to protect our funds.

Nifty 50 Price Structure Analysis [11/12/2025: Thursday]Top-Down Nifty 50 Price Structure Analysis for 11th December 2025. The day is Thursday.
(1) Monthly Time Frame:
Red marubozu. Red piercing candle. The green body of the previous month is almost engulfed. It is an inside month so far with a bearish bias. Clear signs of trend reversal. No sign of bullishness. Major resistance is at level 25900. Minor support is at level 25700. The view is indecision to bearish.
(2) Weekly Time Frame:
Perfect red marubozu after a red hanging man candle. It's a start of a lower lows and lower highs price structure. A clear breakdown of level 25900 confirms a breakdown from 3 weeks of consolidation. Super strong resistance is at level 25900. A minor support is at level 25700. There is no sign of bullishness. There is a high probability of dropping down to the level 25600 and further below. The view is bearish.
(3) Daily Time Frame:
A clear price structure of lower lows and lower highs is visible. Back-2-back 3 days red candle. Today's candle is an improvisation of red marubozu with a long upper wick. A clear sign of heavy selling pressure. Thus, the market is weak. Super strong resistance is in the zone (25950 - 25900). A minor support is in the zone (25750 - 25700). There is a high probability of the price breaking through the level 25700 to reach the level 25600. There is no sign of bullishness. The view is bearish.
(4) 30-Minute Time Frame:
A perfect breakdown from a head and shoulder (H&S) pattern. Price structure has also completed a minor pullback structure after breaking the H&S neck by touching the level 25900. Super strong resistance is in the zone (25950 - 25900). Minor support is in the zone (25750 - 25700). There is no sign of bullishness. Thus, there is a high probability of the price breaking down level 25700 to reach level 25600. The view is bearish.
Bullish Scenario Set-Up:
(i) Price sustains above the opening price.
(ii) Price constructs a higher highs and lower lows structure above the zone (25950 - 25900).
(iii) There is a very low probability of a bullish scenario.
Bearish Scenario Set-Up:
(i) Price sustains below the opening price.
(ii) Price decisively breaks down level 25700 with a motive of approaching the 25600 level.
(iii) There is a very high probability of a bearish scenario.
No Trading Zone (NTZ): (25900 - 25800)
Event:
SENSEX weekly expiry plus a high-impact event - FED interest rate decision is on 11/12/2025 (Thursday). Price structure uncertainty is expected.
Summary of the Trading Plan (Hypothesis and Insight):
(i) The market is clearly bearish. There is no sign of bullishness. Thus, every up move should be doubted. Execute only bearish trades.
(ii) SENSEX weekly expiry and the FED interest rate decision might create high price structure uncertainty. The best time to trade is in the second half or the last hour of the day.
(iii) A very strong resistance zone is (25950 - 25900). Think of bullish trades only when the price forms a higher highs and lower lows structure above the resistance zone. However, the probability is very low.
(iv) Minor support zone is (25750 - 25700). Once price breaks down the level 25700, take bearish trades with the first target to 25600. If the price falls deepens, then the next probable target is 25500.
(v) No trading zone (NTZ): (25900 - 25800).
(vi) Trade only when either bullish or bearish conditions are fulfilled. Otherwise, don't trade. Protect your resources.
NOTE:
"Mark your points. Trade your points. Price is God. Anything can happen in the markets. Therefore, trade what you see, not what you believe."
Happy Trading!

Nifty Intraday Analysis for 11th December 2025NSE:NIFTY
Index has resistance near 25950 – 26000 range and if index crosses and sustains above this level then may reach near 26200 – 26250 range.
Nifty has immediate support near 25550 – 25500 range and if this support is broken then index may tank near 25300 – 25250 range.
Financial markets globally, including India's, will react significantly to the US Federal Open Market Committee (FOMC) announcements tonight on interest rates. A rate cut, especially when accompanied by positive guidance, is typically viewed favourably by global markets including capital and commodity markets, leading to potential rallies. Conversely, an unexpected rate hike or a very "hawkish" stance may lead to market pullbacks.

Nifty Intraday Analysis for 10th December 2025NSE:NIFTY
Index has resistance near 26025 – 26075 range and if index crosses and sustains above this level then may reach near 26300 – 26350 range.
Nifty has immediate support near 25625 – 25575 range and if this support is broken then index may tank near 25400 – 25350 range.
Market is expected to move up in the opening and profit booking at higher levels will drag the market down in the second half or during market closing session due to the outcome of the US FOMC scheduled on 10th December 2025.
2008 Nifty 50 Crash - Analysis2008 Nifty 50 Crash Around 65% of 0 level complete study analysis of corrective wave pattern (Running Flat)

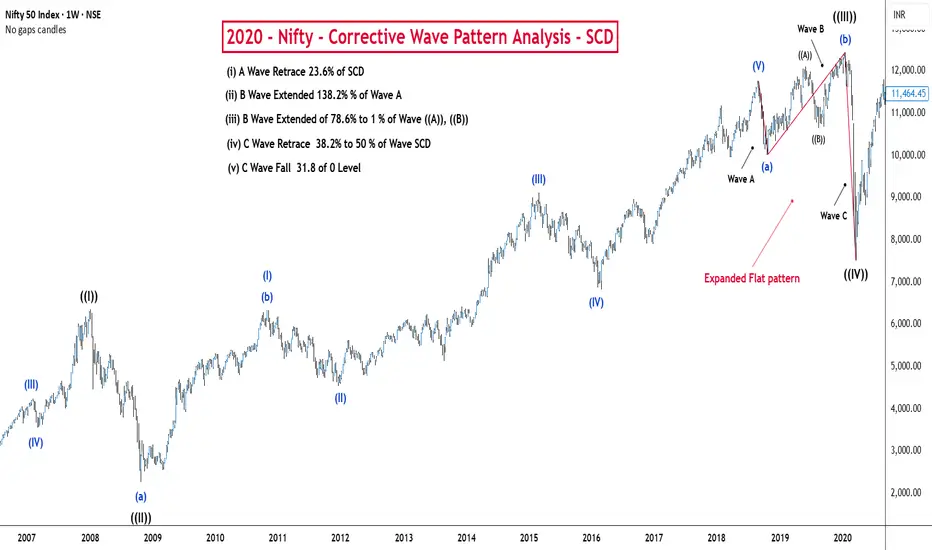
2020 Nifty Correction Analysis 2020 Corona Period Nifty 50 Fall at 38.2% of 0 level complete study analysis of corrective wave pattern (Expanded Flat)
EOD analysis of Nifty......Here is end of the day analysis of Nifty....
Disclaimer: This analysis is for educational purposes only and does not constitute investment advice. Please do your own research (DYOR) and check with your financial advisor before making any trading decisions.

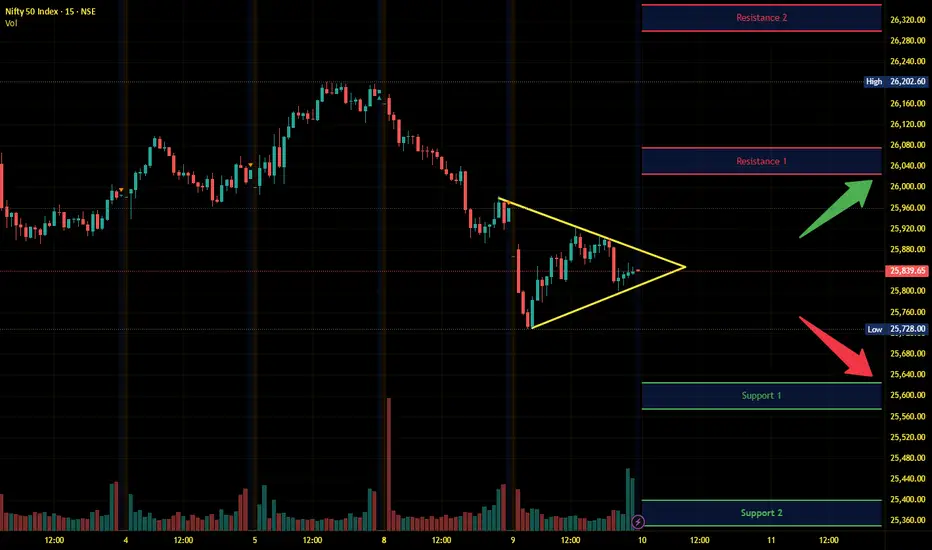
“Nifty Zone-to-Zone Reactions | Excellent Supply–Demand PlaybookNifty is respecting the marked supply and demand zones with excellent precision.
Price is currently trading inside a mid-range demand zone, and each move has been reacting cleanly from zone to zone, providing high-probability intraday opportunities.
🔍 Key Observations
Price rejected strongly from the 25,960–25,980 supply zone, confirming seller control at the top.
A clean reaction was seen earlier from the 25,740–25,760 demand zone, establishing it as a strong intraday support.
The market is now consolidating between 25,840–25,900, forming a decision area for the next directional move.
📈 Bullish Setup (If demand holds)
A bounce from 25,840–25,860 demand zone can push price back toward
▸ 25,900 resistance
▸ 25,960 supply zone
Break + Retest above 25,900 will open the upside.
📉 Bearish Setup (If zone breaks)
Breakdown below 25,840 zone may trigger a fall toward
▸ 25,780 support
▸ 25,740 demand zone
🧭 Trade Plan
Buy only at demand, sell only at supply.
Avoid entries in the middle — let the chart come to the edges of the zones.
This structure is ideal for zone-to-zone scalping & intraday trades.

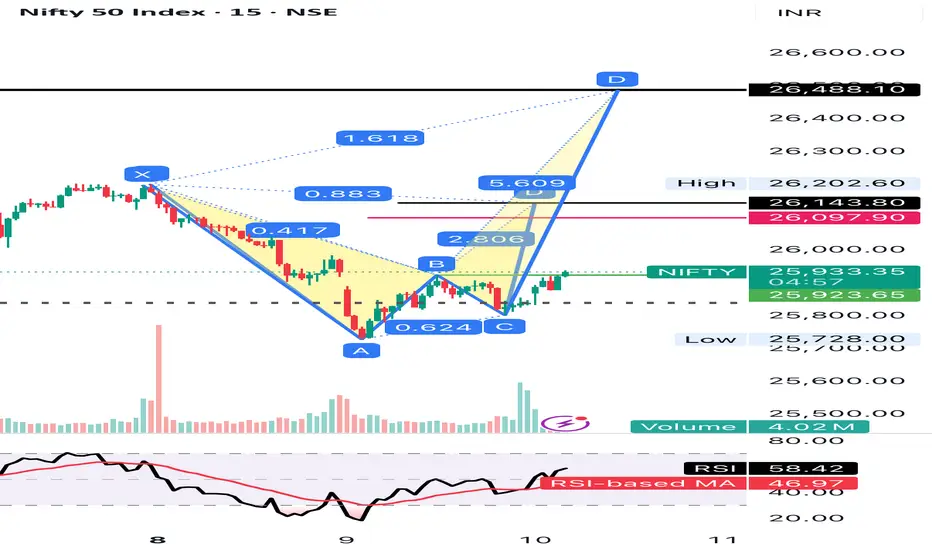
Nifty rally expected soon 26488++ in no timeNifty after hitting 50 EMa ready for rally
Immediate target 26488++
Probably this week only possible
26145/26277 hurdle points
#NIFTY Intraday Support and Resistance Levels - 10/12/2025Nifty is likely to open gap-down today, indicating continued weakness in the short term as the index remains below the consolidation zone and is struggling to reclaim the upper resistance levels. A gap-down start around 25900–25880 keeps the bearish sentiment intact, and any early pullback may face selling pressure near 25950–25900, which is now acting as a supply zone. As long as Nifty trades below this band, short positions remain favorable with downside targets of 25850, 25800, and 25750-, where the next minor support lies. If selling pressure continues, a breakdown below 25700 will open the door for a deeper fall toward 25650, 25550, and 25500-, making this the major level to watch for a trending move.
On the upside, a recovery will only gain strength if Nifty sustains above 26050, triggering fresh long opportunities toward 26150, 26200, and 26250+, but with global cues weak and a gap-down expected, a strong upside push looks less likely during the initial session. Overall, the market bias remains bearish unless Nifty re-enters the consolidation zone and shows strength above 26000. Traders should focus on breakdown levels rather than reversal trades, as opening volatility after a gap-down can create sharp intraday movements favoring the downside.

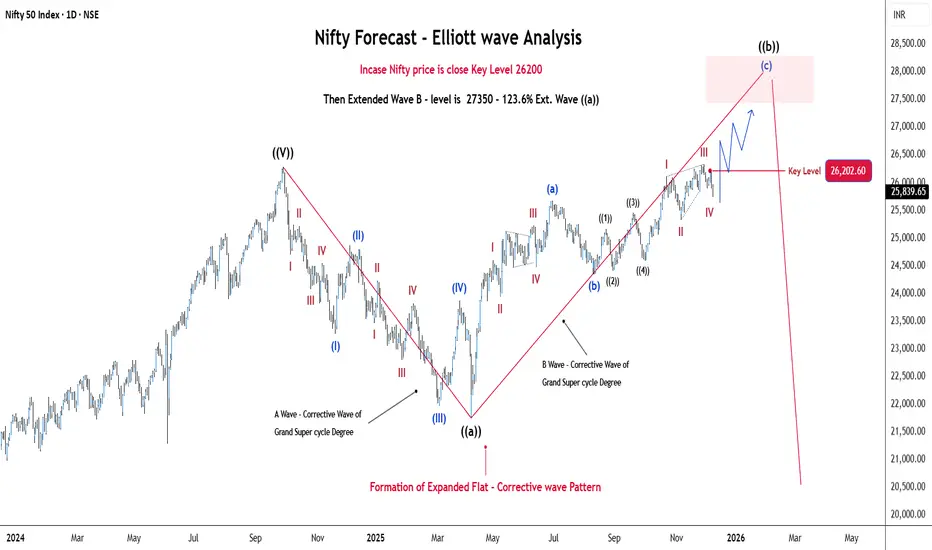
Nifty 50 - Elliott Wave ( Corrective Wave) AnalysisIncase Nifty Price close above 26200 key level B Wave (Corrective Wave) Extended at 27350 (Fib Ext. Wave A) then started C wave Correction so adjust your position and hedging
Nifty 4H me rising wedge hai – pattern normally bearish.Nifty 4H me rising wedge hai – pattern normally bearish.
Price baar-baar 25,900–26,100 ke upar wale trendline se reject ho raha hai (strong supply zone).
Neeche ka major support 25,300 (old resistance + trendline confluence).
Agar 25,300 ke neeche 4H close aata hai to pattern weak hoga, phir 25,000–24,850 tak slide possible.
Dusri side, agar 26,100 ke upar strong close milta hai to wedge breakout hoga, phir 26,250–26,320 upside targets ban sakte hain.

Nifty - Head and ShouldersNifty formed a Head&Shoulder patter with a 26320 and low of 25750.
A break and decisive close below 25750 should see a sign of more selling to come.

Nifty 50 trade idea for 10decI am seeing bearishness in nifty then next possible target for nifty 25650.
I have marked the trade if i get entry at my point then this will be a good trade for this Wednesday.

Nify EOD analysis.....Here is analysis of nifty after market close.
Please do follow me if you liked the idea💡...
Disclaimer ⚠️- This is just for education purpose, not any trading advice ⚠️⚠️

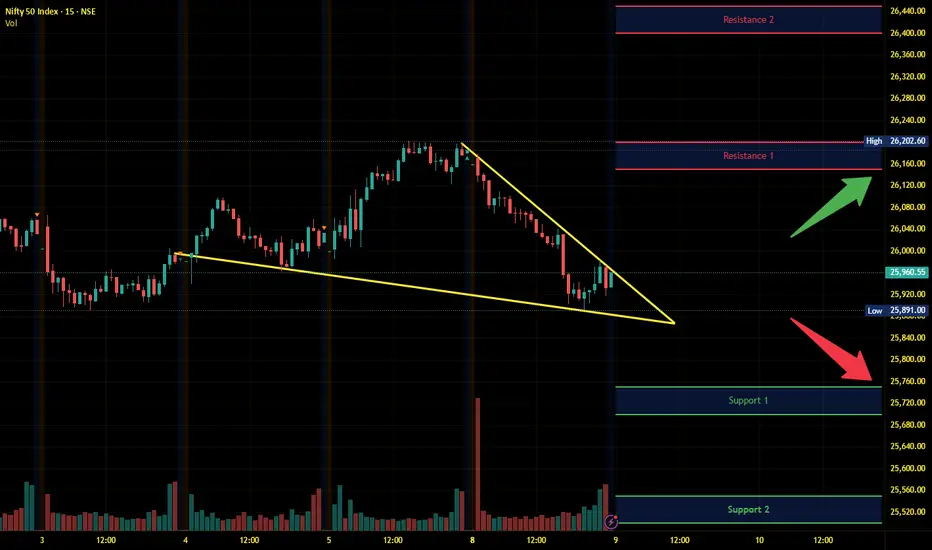
Nifty Intraday Analysis for 09th December 2025NSE:NIFTY
Index has resistance near 26200 – 26250 range and if index crosses and sustains above this level then may reach near 26400 – 26450 range.
Nifty has immediate support near 25750 – 25700 range and if this support is broken then index may tank near 25550 – 25500 range.
Market is expected to be range bound on the Nifty Weekly F&O expiry and reversal may take place from resistance or support zone.
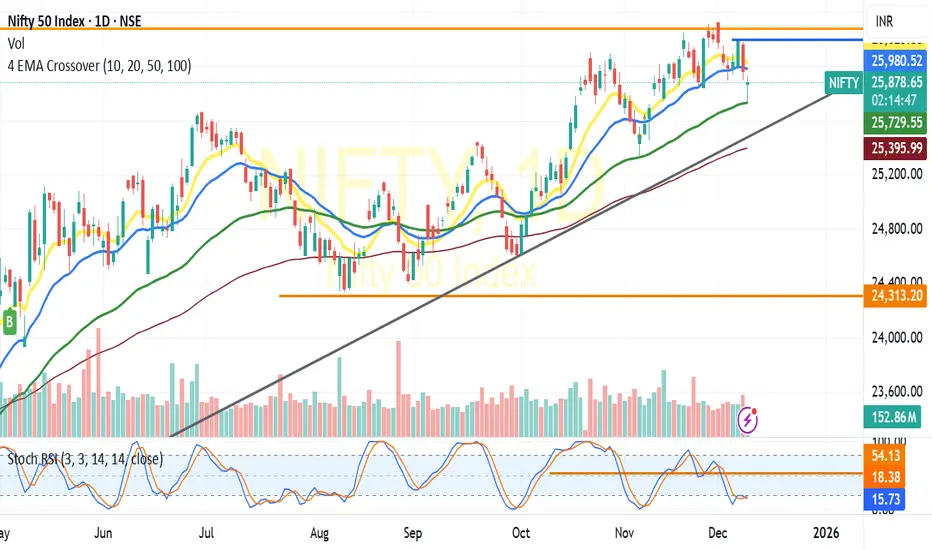
NIFTY -Positional View Buy or SELL?NIFTY :Witnessed giving up all its recent gains and tested 25800 band ,In the process violated all its critical Moving averages viz 10 &20 DEMA.
Though NIFTY showed a strong pull back towards 25900 ,expect the rally to sustain only when it gives a close above its 10 DEMA & 20 DEMA -Lying between 25950-26050.Deceseive close above 26000 is critical for the sustained rally. On the other hand close below 25700 is likely to drag it to 25500 levels,be cautious with the levels and trade accordingly(For educational purpose only)
NIFTY 50 – Elliott Wave Analysis | 3 Possible Wave Counts | 3H CCurrent Market Price: 25,754 (as on Dec 09, 2025)
🌀 3 Possible Elliott Wave Scenarios
🅰️ Scenario A – Wave 4 completed at today’s low
Price currently retesting the multi-month trendline support (blue & magenta channel confluence).
A bounce from 25,730 – 25,820 zone may trigger Wave 5 towards:
Target 1: 26,401
Target 2: 26,877
Target 3: 27,082 – 27,489 major resistance box
Invalidation: Close below 25,700
🅱️ Scenario B – Wave 4 still unfolding
Price may make a deeper correction if the support breaks.
Possible drop into 25,534 – 25,316 zone to complete an extended Wave 4.
Strong demand expected from that zone.
🅾️ Scenario C – Larger corrective Wave 2 (bigger picture)
If selling intensifies due to global weakness, larger structure may still be in play.
Downside cluster support near 25,144 – 24,973.
RSI oversold and in historical reversal zone—indicating possible climactic bottom formation.
Invalidation of bullish structure: Sustained close below 24,973
📌 Technical Confluence
RSI deeply oversold on 3H — near reversal territory.
Channel support + Fib 0.382 – 0.5 support zones aligned.
Gap zone and demand block present at current level.
🎯 Summary
View Support Bullish Targets
Wave 4 bottom done 25,730–25,820 26,401 → 26,877 → 27,082–27,489
Extended Wave 4 25,534–25,316 Same above targets
Bigger Wave 2 25,144–24,973 Mid-term bullish zone
📍 My Positioning View
As long as NIFTY holds above 25,700 on closing basis, bullish continuation remains favored.
Watching price action closely near 25,754 – 25,820 for reversal confirmation.
⚠️ Disclaimer
This analysis is for educational and research purposes only.
Not investment or trading advice.
Please consult with your financial advisor and trade with proper risk management.
Markets are unpredictable—view this as probability-based analysis, not certainty.

NIFTY- Intraday Levels - 9th December 2025Only few bullish levels (without buffer) are marked on chart 26033/56 seems to be make or break level.
If NIFTY sustain below 25938 below this bearish then 25892/74 support below this more bearish then 25843/30 strong level this is the same price were market made open= low on 26th nov very very strong level and last hope 25761 below this wait
My view :-
"My viewpoint, offered purely for analytical consideration, The trading thesis is: Nifty (bullish tactical approach: buy on dip) The market is anticipated to form a floor (bottom).
This analysis is highly speculative and is not guaranteed to be accurate; therefore, the implementation of stringent risk controls is non-negotiable for mitigating trade risk."
Consider some buffer points in above levels.
Please do your due diligence before trading or investment.
**Disclaimer -
I am not a SEBI registered analyst or advisor. I does not represent or endorse the accuracy or reliability of any information, conversation, or content. Stock trading is inherently risky and the users agree to assume complete and full responsibility for the outcomes of all trading decisions that they make, including but not limited to loss of capital. None of these communications should be construed as an offer to buy or sell securities, nor advice to do so. The users understands and acknowledges that there is a very high risk involved in trading securities. By using this information, the user agrees that use of this information is entirely at their own risk.
Thank you.

NIFTYGOOD to hold upto 25700 ,
be cautious and observe the trend lines
with strict stoploss .
Purely for informative and educational.

Nifty Intraday Analysis for 08th December 2025NSE:NIFTY
Index has resistance near 26375 – 26425 range and if index crosses and sustains above this level then may reach near 26600 – 26650 range.
Nifty has immediate support near 26000 – 25950 range and if this support is broken then index may tank near 25775 – 25725 range.
Upside momentum is expected to continue as the US trade deal delegation is coming to India for the finalization of the India-US trade agreement amid the successful India-Russia Annual Summit 2025.

Nifty 8th Dec 2025 Nifty has once again climbed back into the major supply zone of 26,200–26,300, a region where price has repeatedly stalled for several weeks. While the broader trend remains intact, the recent candles show a very interesting behaviour:
price is forming higher-lows, but RSI is forming lower-lows / lower-highs.
This is a Hidden Bearish Divergence, and it usually signals weakening bullish momentum when it appears near a resistance zone.
1. Price Action (Daily Chart)
• Nifty printed a strong green candle, but it pushed straight into the same overhead supply zone that rejected multiple attempts earlier.
• The last 8–10 candles show higher-lows, suggesting dip-buying.
• However, price still failed to close above 26,300, showing that sellers are defending this level aggressively.
2. RSI Structure → Hidden Bearish Divergence
While price bottoms are rising, RSI bottoms are falling — a classic Hidden Bearish Divergence, which often appears during distribution or weakening momentum.
This indicates:
• Bulls are holding price up artificially,
• but momentum isn’t confirming,
• which increases the probability of a pullback.
3. Volume Confirms the Weakness
Volume on the recent bounce remains flat to falling, with no signs of institutional strength. A breakout without volume has a high chance of failing.
4. Stochastic Also Rolling Over
Stochastic on the daily timeframe is turning down from overbought territory, which often aligns with a short-term correction or mid-range pullback.
5. Key Levels to Watch
Resistance (Rejection Zone):
• 26,200 – 26,300
A daily close above this zone with strong volume would invalidate the bearish setup.
Support Levels (Pullback Targets):
• 26,050
• 25,880
• 25,700 ← strong demand zone
• 25,450 (if selling accelerates)
As long as Nifty stays below 26,300, the pullback scenario remains active.
6. Bias & Summary
The broader trend is still bullish, but the short-term structure shows signs of exhaustion.
Hidden bearish divergence + resistance zone + weak volume =
➡️ Increased probability of a short-term pullback
➡️ Expect hesitation and volatility near 26,200–26,300
➡️ Watch for rejection signals or a failed breakout wick
A clean breakout requires:
• Strong volume expansion
• A decisive daily close above 26,300
Without this, the market is more likely to cool off first.
Conclusion:
Nifty is at a critical inflection point. Hidden Bearish Divergence at major resistance suggests the index may be preparing for a short-term correction before any larger trend continuation. Keep a close eye on 26,300 — this zone will decide whether Nifty breaks out or pulls back.
