Nifty ready to touch 26020 levelsNifty went bearish and ready to touch its support line 26020. Expecting a pullback from there back in 26100 levels
Trade ideas
Real Knowledge Of Candle Patterns Candlestick Patterns in Reversal Trading
Reversals are powerful when:
Patterns appear on key levels
Trend is exhausted
Volume divergence occurs
Examples:
Morning Star at support
Shooting Star at resistance
Engulfing candles at major swing points
Combining Candles with Indicators
Although candles alone are powerful, combining them with indicators increases win probability.
Best indicators:
RSI for overbought/oversold
Volume Profile / Market Structure
MACD for momentum shift
Moving averages for trend direction

Nifty Chart Says - Trust the Bulls NSE:NIFTY Preparing for an Upswing — Buy-on-Dip Setup Active
Pivot Percentile is loose in Nifty today, which means we can expect a range-bound day.
Since the trend has turned Green, the approach now shifts to Buy on Dip and slowly accumulate for an upswing in the coming week.
Support sits at 26095 and resistance at 26200.
If Nifty manages to sustain above 26200, we can aim for 26400 on the index.
From a sectoral point of view, IT and NBFCs are leading the momentum, and Auto is preparing for a fresh upswing.
I’m currently studying NSE:MARUTI , NSE:SHRIRAMFIN , and NSE:M&M , NSE:CHOLAFIN for next week.
Setups are forming nicely, and the charts are beginning to show signs of bulls entering again.
It looks like the bottom is very close.
This is the right time to create a list of strong stocks and track them regularly.
That’s all for now.
Take care. Have a profitable tomorrow.
📊Levels at a Glance:
Pivot: 26130
Support: 26095
Resistance: 26200 (above = target 26400)
Bias: Buy on Dip
Sectors to Watch: IT, NBFC, Auto
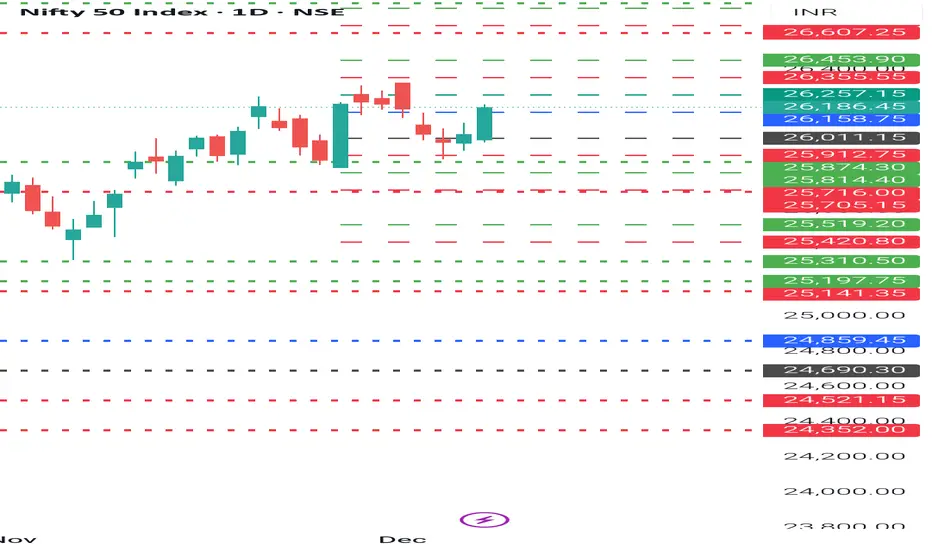
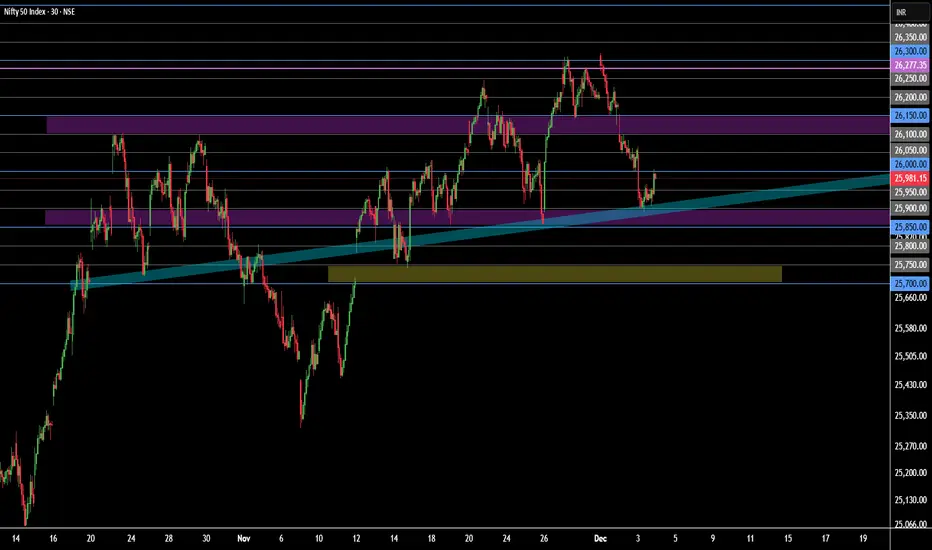
Key levels for nifty 08.12.2025These are key levels for nifty 50 index. Marked zones may act as walls of resistance or support. Look for breakout or reversals at these walls. Also look for bullish or bearish engulfing candles at these zones for entry.
Weekly Wrap : #Nifty50 Bulls are here to stay? First Step of a successful trader is to build a Trade plan & review what he has done. (education purpose for all )
*Trend is up.
*Trade plan: Buy on Dip
* Critical Levels:
* Resistance:26300/26470
* Support: 26060/25950
Jai Hind.
Disclaimer :
This video is only for educational purposes. Please consult your financial advisor before you take any trade.

Weekly Analysis of Nifty.....This is the weekly analysis of Nifty covering various topics of ICT, Price action.. Please do watch and repeat watch to learn these...
Note – if you liked this analysis, please boost the idea so that other can also get benefit of it.
Also follow me for notification for incoming ideas.
Also Feel free to comment if you have any input to share.
Join me on live stream for real time update.
Disclaimer: This analysis is for educational purposes only and does not constitute investment advice. Please do your own research (DYOR) and check with your financial advisor before making any trading decisions.

Nifty Swing/Positional Outlook: Is the Top for the Year Near?View : Cautious on current highs; anticipating a potential short-term top or consolidation.
My End-of-Year Market Thesis
It looks like the Nifty might be forming a significant top for the current year, potentially before the Christmas vacation period fully kicks in. This view is based on the cyclical nature of the market and the expected seasonal reduction in trading volume.
The Big Player Factor : As we approach year-end, many large institutional investors and FIIs (Foreign Institutional Investors) often take their profits off the table and head for the holidays. This withdrawal of major market participants typically leads to a notable decrease in liquidity and momentum.
Anticipating the Next Move : Without the consistent buying pressure from these "big players," the market will likely do one of two things:
1) A Deep Correction : We could see a sharp, volume-driven decline as domestic traders and profit-takers step in.
2) Consolidation : The index might enter a tight, sideways range at the current elevated levels, waiting for fresh cues.
Watch for key levels marked on chart .. The next significant move will likely be decided when the FIIs and big players return to the market in full force in the first or second week of January.
Disclaimer : This is purely a personal analysis and market outlook. Please conduct your own research and manage your risk accordingly.
NIFTY – Multi-TF Breakdown | Structure, Levels & What Comes Next📌 Higher-Timeframe Bias (1D)
Nifty continues to respect bullish market structure on the daily timeframe, holding above the recent Break of Structure (BOS) and defending the previous demand zone.
Key notes from the chart:
Price rejected from the premium zone near 26,350–26,400 (EQH area + weak high).
Strong reaction from the discount OB + FVG around 25,350–25,450 zone.
As long as Nifty holds above 25,800, higher-timeframe bullish bias remains intact.
Daily Structure:
HH → HL sequence intact
The last BOS confirmed continuation
Daily OB remains unmitigated below
🔍 4H Structure (Important for Traders)
On the 4H chart, Nifty filled previous imbalances and retested FVGs cleanly.
Key observations:
PDH & PDL zones respected perfectly.
A bullish MSS → BOS has shifted short-term sentiment upward.
FVG at 26,000–26,060 acted as intraday support.
Price reclaimed the VI / PDH cluster, showing absorption of sellers.
This suggests buyers are defending short-term inefficiencies.
🎯 Key Levels to Watch
Upside Resistance:
26,300 – 26,350: Major supply zone
26,400: Weak High + Liquidity Pool
26,475: Next upside target if breakout sustains
Downside Support:
26,050 – 26,000: Intraday FVG + 4H demand
25,900: PDL cluster
25,750: HTF structure break level
25,350 – 25,450: Daily OB/FVG (Major swing support)
📈 Trading Plan (Not Financial Advice)
Bullish Scenario:
If price holds above 26,000 and sustains above PDH/VI cluster →
▶ Target 26,300 → 26,400
▶ Break & close above 26,400 = continuation higher
Bearish Scenario:
If 26,000 breaks decisively →
▶ First target 25,900
▶ Below that → revisit 25,450 (Daily OB)
🧩 Market Structure Summary
HTF bullish, LTF recently flipped bullish
Price currently inside a premium zone, so chasing longs is risky
Dips into discount levels (26,000 / 25,900) are ideal for long setups
Break above 26,350–26,400 can trigger liquidity sweep continuation
🏁 Conclusion
Nifty is compressing between liquidity levels.
The next expansion is likely once 26,400 or 26,000 breaks.
🔥 Bias: Moderately Bullish as long as 26,000 holds.

Nifty 50 Price Structure Analysis [08/12/2025: Monday]Top-Down Nifty 50 Price Structure Analysis for 08th December 2025. The day is Monday.
(1) Monthly Time Frame:
Red paper umbrella candle. The body is smaller compared to the lower wick. So far, it is an indecisive market. The main trend is bullish, but the present scenario is indecisive. The major support zone is at 26100 and 26000. Major resistance is at 26300. The view is bullish to indecision.
(2) Weekly Time Frame:
Red paper umbrella candle. The body is smaller compared to the lower wick. There is no upper wick. Thus, there is good buyer participation. Looking at the combination of 3 candles, buyers (or bulls) are getting stronger. The lower wicks are getting longer every week. For the past 3 weeks, the price has been taking very good support at the zone (25850 - 25900). In the present scenario, levels 26100 and 26000 are major support zones. Major resistance is at 26300. Considering, past 8 weeks, the price is in the structure of higher highs and lower lows. Thus, bullishness is intact. Take no bearish trade until the price starts to trade below the zone of 26100 - 26050. Presently, the view is bullish to indecision. If the price keeps sustaining above the level 26200, then probably, the previous all-time high (ATH) will be breached.
(3) Daily Time Frame:
The past 2 days are green days. On 05th December price gave a 200-point bullish rally. However, price is still in the range of the bullish marubozu formed on 26th November (Wednesday). Price needs a stable movement above the level 26200. Presently, 3 levels have emerged as a strong support zone - 26100, 26050, and 26000. So, take no short position unless the price starts to trade below 26000. Any downward move should be doubted. The view is bullish to indecision as the previous ATH and level 26300 are very close.
(4) 30-Minute Time Frame:
The complex correction since 17th October 2025 continues. Presently, price is trying to trade in the upper zone of the rising channel. The direction of the complex correction is bullish but with high volatility and indecisive moves. A strong support zone is formed at the levels 26100 - 26000. A minor resistance is at 26200. Major resistance is at 26300 and the previous ATH (26277.35). Every down move should be doubted. Institutional bias is bullish. The view is bullish.
Event:
No expiries on Monday. No high-impact event. However, the U.S. Fed Interest Rate Decision is on 11th December (Thursday) - a high-impact event in the next week.
Bullish Scenario Set-Up:
(i) Price sustains above the opening price.
(ii) Price sustains above the level 26200 and shows promise of reaching levels 26277.35 (ATH) and level 26300.
Bearish Scenario Set-Up:
(i) Price sustains below the opening price.
(ii) Price starts to sustain below the level 26050 and starts to form a lower lows, lower highs structure below 26000.
No Trading Zone (NTZ): 26200 - 26100.
Expectations (Hypothesis and Insights from Trading Plan):
(i) Take bullish trades only. Price must start to trade above the level 26200.
(ii) Every down move should be doubted. Levels 26100 - 26050 are very strong support.
(iii) Be skeptical of executing trades in the first half of Monday, as level 26277.35 (previous ATH) and level 26300 are close. Also, in case of a gap up or a gap down, be very cautious. A clear price structure is needed for trend clarity.
(iv) Trade only when bullish/ bearish conditions are fulfilled. Otherwise, don't trade. Protect your resources.
NOTE:
"Mark your points. Trade your points. Price is God. Anything can happen. Therefore, trade what you see, not what you believe."
Happy Trading!

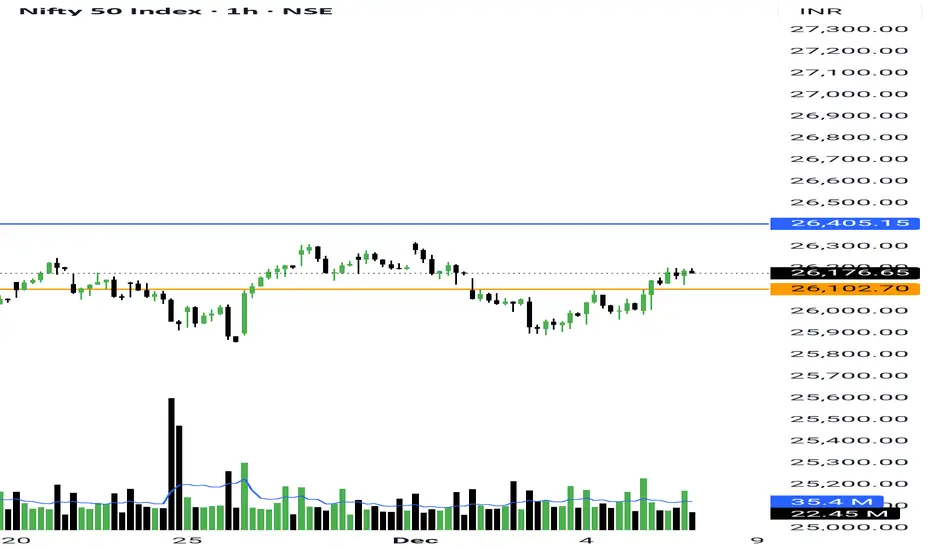
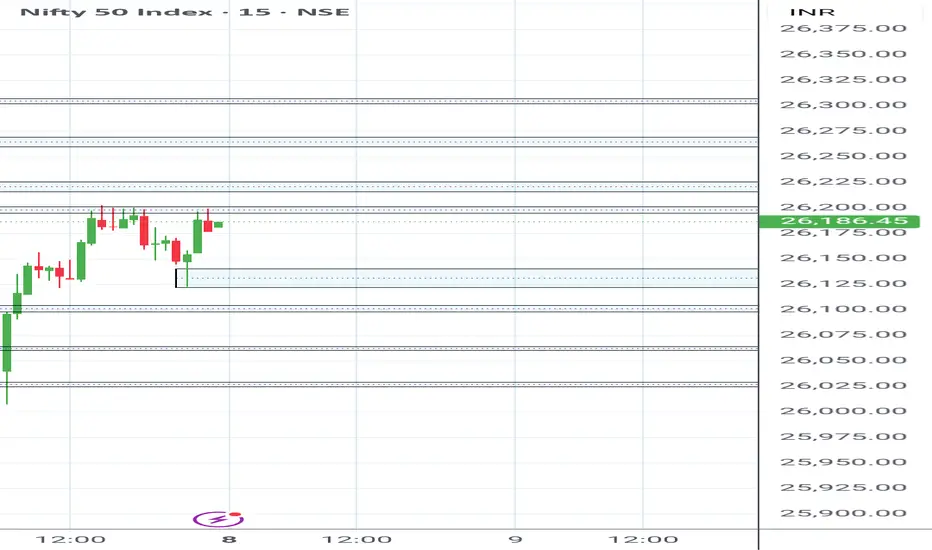
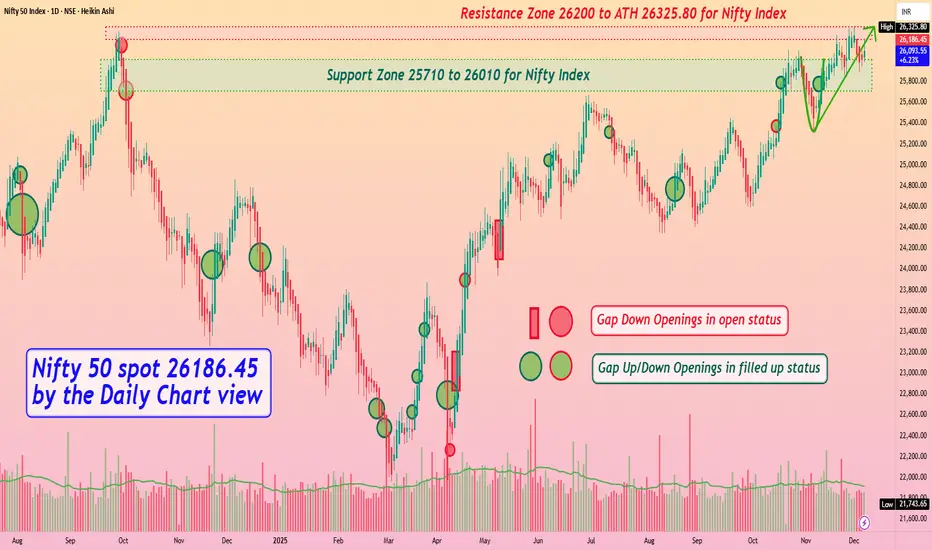
Nifty 50 spot 26186.45 by Daily Chart view - Weekly updateNifty 50 spot 26186.45 by Daily Chart view - Weekly update
- Support Zone 25710 to 26010 for Nifty Index
- Resistance Zone 26235 to ATH 26310.45 for Nifty Index
- Anticipate the subdued Bullish momentum to continue for Nifty 50
- Moreso Geo-Political tariff tricklers with certain Domestic factors creating weakness
NIFTY VIEW Here is a chart of nifty 15 minutes which shows a inverted head and shoulder pattern which shows a positive sign, signaling NIFTY can reach 26300

Nifty 50 Price Structure Analysis [05/12/2025: Friday] Top-Down Nifty 50 Price Structure Analysis for 05th of December 2025. The day is Friday.
(1) Monthly Time Frame:
Red inside candle. Highly indecisive market. Indecision is due to the price's nearness to the all-time high (ATH). Major resistance is at level 26300. Major support is in the zone (25900 - 25850). The view is indecision.
(2) Weekly Time Frame:
Red inside candle with minor buying support from the zone (25900 - 25850). Probably, level 26000 will also become a support if the price sustains far above 26000. The immediate resistance zone is (26150 - 26100). Price trading above the zone (26150 - 26100) will only be considered bullish sentiment this week. The view is indecision.
(3) Daily Time Frame:
A green spinning top is formed. The candle is inside the previous day. Taking into consideration the price, the structure is consolidating in the range of 26150 - 252900. However, the green spinning top is formed at the end of the 3-day fall. Maybe it is a sign of reversal. Bullish sentiment can be confirmed if the price starts to trade above the level of 26100. Presently, the major support zone is at (25900 - 25850), and the major resistance zone is (26150 - 26100). Also, the market is highly indecisive. The identified no trading zone (NTZ) is (26100 - 25900). The view is indecision.
(4) 30-Minute Time Frame:
The complex correction in the broader market range still continues. Today is a perfect non-directional and choppy day. Major support (or buying) zone is (25900 - 25850). The major resistance zone is (26150 - 26100). No trading zone (NTZ) is (26100 - 25900). The view is indecision.
HIGH IMPACT EVENT:
No expiries on Friday. However, there is a high-impact event - "RBI Interest Rate Decision" at 10:00 A.M. Also, it is the last day of the week.
Bullish Scenario Set-Up:
(i) Price sustains above the opening price.
(ii) Price starts to form a higher highs and higher lows structure above the level 26100.
Bearish Scenario Set-Up:
(i) Price sustains below the opening price.
(ii) Price starts to form a lower lows and lower highs structure below the level 25900.
No Trading Zone (NTZ): (26100 - 25900).
Expectations (Hypothesis and Insight from Trading Plan):
(i) Market structure is highly indecisive.
(ii) Do not execute trade in the identified NTZ (26100 - 25900).
(iii) Take bullish trade only when price starts to form a higher highs and higher lows structure above 26100. However, upside is also very difficult as there are multiple resistances above. Also, ATH and 26300 are above. The market needs a strong bullish force to sustain bullishness.
(iv) Take bearish trade only when price starts to form a lower lows and lower highs structure below the level 25900. In case, price breaks down the level 25850, then be prepared to heavily short the market.
(v) Think of trading only after 10:00 AM when the market has finally interpreted the RBI interest rate decision.
(vi) Trade only if conditions are fulfilled. Otherwise, avoid trading.
NOTE:
"Mark your points. Trade your points. Price is God. Anything can happen. Therefore, trade what you see, not what you believe."
Happy Trading!

NIFTY 50 CHART NIFTY 50 CHART FOLLOWING RISING WEDGE PATTERN ON DAILY TIME FRAME
nifty is near the resistance level of 26250 to 26300, which is the lifetime high.
the market is coming to this level after 14 months and forming a bearish pattern, which is not good.
levels for breakdown is 25850 to 25800. sustaining below this level i will go short.
levels for fresh breakout is 26250 to 26300 zone. sustaining above this level we will create long position.

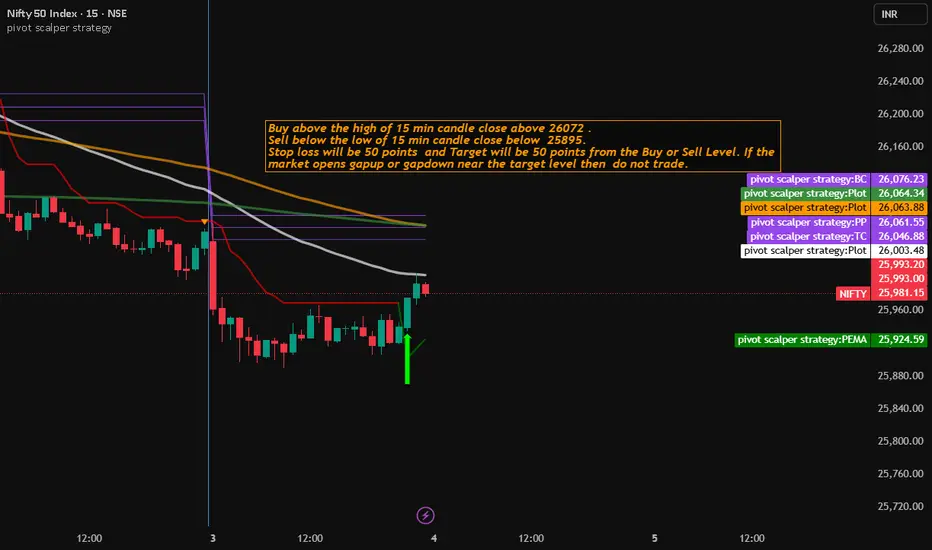
Nifty Trading Strategy for 04th December 2025📊 NIFTY 15-Min Trading Strategy
🟢 BUY Setup
Entry Condition:
Enter Buy when the 15-minute candle closes above ₹26,072.
Ensure the candle closes strongly above the level (not just a wick touch).
🎯 Target:
+50 points from the Buy level.
Example: If entry triggers at ₹26,072 → Target = ₹26,122
🛑 Stop Loss:
50 points SL from your entry level.
Example: Entry at ₹26,072 → SL = ₹26,022
⚙️ Trade Management:
Maintain position until the 50-point target or 50-point SL is hit.
Avoid premature exit unless strict risk rules say otherwise.
🔻 SELL Setup
Entry Condition:
Enter Sell when the 15-minute candle closes below ₹25,895.
🎯 Target:
+50 points from the Sell level.
Example: Entry triggers at ₹25,895 → Target = ₹25,845
🛑 Stop Loss:
50 points SL from the entry level.
Example: Entry at ₹25,895 → SL = ₹25,945
⚠️ Important Market Condition
Do NOT Trade
If NIFTY opens gap-up or gap-down near the target level,
→ No trade should be taken, because the risk-reward becomes poor and traps are common on gap openings.
📝 Disclaimer
This content is for educational and informational purposes only.
I am not SEBI registered.
Market trading involves substantial risk.
Please trade with proper risk management and at your own discretion.
NIFTY Levels for TodayHere are the NIFTY's Levels for intraday (in the image below) today. Based on market movement, these levels can act as support, resistance or both
Please consider these levels only if there is movement in index and 15m candle sustains at the given levels. The SL (Stop loss) for each BUY trade should be the previous RED candle below the given level. Similarly, the SL (Stop loss) for each SELL trade should be the previous GREEN candle above the given level.
Note: This idea and these levels are only for learning and educational purpose.
Your likes and boosts gives us motivation for continued learning and support.
Nifty long soonNifty can go down and break this 26230 level by end of this month. Best buy at 25700-800 level.

Nifty 50 Price Structure Analysis [04/12/2025: Thursday]Top-Down Nifty 50 Price Structure Analysis for 04th December 2025. The day is Thursday.
(1) Monthly Time Frame:
The candle is red. The month is inside the previous month. It is an inside candle. Very strong resistance is at levels (26300 - 26150). Major support is formed in the zone (25900 - 25850). The view is indecisive.
(2) Weekly Time Frame:
A strong red candle is formed with minor buying. For 3 consecutive weeks, the price has been trading in the range of (26300 - 25850). It seems that, price is consolidating in a 300-point range. The immediate strong resistance zone is (26150 - 26100). Immediate strong support zone is (25900 - 25850). Price trading inside these two support and resistance zones is the no-trading zone (NTZ). Need a very good risk management effort to trade in the NTZ. The view is indecisive.
(3) Daily Time Frame:
Back-2-back 5 red days. Back-2-back 3 days downtrend. Down downtrend is still on. There is weakness in the market. Also, price is only 400 points away from the all-time high (26300). Today's candle is a red long-legged doji. Price settled near a major psychological level, 26000. It seems both the buyers and sellers are fighting hard for existence. Yet taking into consideration the trend, the sentiment is still bearish. However, the institutional bias (slope of 10 EMA and 35 EMA) is bullish to indecisive. The major resistance zone is at (26150 - 26100). The major support zone is 25900 - 25850. The present condition is indecisive.
(4) 30-Minute Time Frame:
As per the current market structure, the price has been in a complex correction since 12th November 2025. There is both sideways and sharp prise-wise correction. It is evident that both sides' price impulses are sharp. Probably, the price is in a major consolidation zone. The zone of (25900 - 25850) still holds as a major support zone. It will be risky to short until the price breaches 25900 and shows the promise of breaking down 25850. Only then can we take a short position with confidence. On the other hand, the zone of (26150 - 26100) acts as a major resistance zone. Also, there is no evidence of a bullish price structure of higher highs and higher lows. Thus, the view is indecisive.
Events:
SENSEX weekly expiry on Thursday. No other high-impact events on Thursday. But the RBI interest rate decision is on the day after (Friday). So, it seems like the market will be indecisive.
Bullish Scenario Set-Up:
(i) Price sustains above the opening price.
(ii) Price decisively breaks out of the zone (26150 - 26100).
Bearish Scenario Set-Up:
(i) Price sustains below the opening price.
(ii) Price decisively breaks down the zone (25900 - 25850).
No Trading Zone (NTZ): (26150 - 26100) to (25900 - 25850).
Expectations (Hypothesis and insights from the trade planning):
(i) The market is highly indecisive.
(ii) The market is not for directional trades rather for the non-directional traders.
(iii) Take bullish trades only when the price breaks out of the zone (26150 - 26100).
(iv) Take bearish trades only when the price breaks down of the zone (25900 - 25850).
(v) If conditions are not met, then don't trade. A high-impact event is near.
(vi) Don't waste your resources when markets are indecisive.
NOTE:
"Mark your points. Trade your points. Price is God. Anything can happen. Therefore, trade what you see, not what you believe."
Happy Trading!
HOW TO WATCHLIST MAKE A COPY & CLEAR LIST✅ Complete Process: HOW TO WATCHLIST MAKE A COPY & CLEAR LIST (Trading-View)
1️⃣ Open the Watchlist Panel
➣ The Watchlist panel is located on the right side of the Trading-View interface.
➣ If it is hidden, click the small arrow on the edge to open it.
2️⃣ Open Watchlist Options Menu
➣ At the top of the watchlist, click the three-dot menu (⋮).
➣ This menu contains all the main watchlist management options.
3️⃣ How to Make a Copy of a Watchlist
Step-by-step:
➣ In the three-dot menu, select “Make a Copy”.
➣ A duplicate copy of the current watchlist will be created.
➣ The copied watchlist will appear in the watchlist dropdown list.
➣ You can rename the copied watchlist by:
⤷ Opening the dropdown → clicking Rename → typing the new name → pressing Enter.
This is useful when you want to create variations of the same watchlist.
4️⃣ How to Clear a Watchlist
Step-by-step:
➣ Open the three-dot menu (⋮) at the top of the watchlist.
➣ Select “Clear List”.
➣ Trading-View may ask for confirmation.
➣ Once confirmed, all symbols inside the watchlist will be removed, but the watchlist itself
remains.
This is helpful when you want to reset or start the watchlist fresh.
5️⃣ Switch Between Watchlists
(Useful after creating a copy)
➣ Click the watchlist name at the top.
➣ A dropdown will appear with all available watchlists.
➣ Select the watchlist you want to view or edit.
🎯 Short Summary (Optional for captions)
➣ Make a Copy → Menu → Make a Copy → Rename if needed
➣ Clear List → Menu → Clear List → Confirm
➣ Switch Watchlists → Dropdown → Select List

Nifty view for 04/12/25
Nifty view for 04/12/2025
* Wait for + OB
* Wait for +POI
* Entry on 1 min time frame
* Wait for Displacement
buy above it and sl will be below
* Not more than 2 trades allow

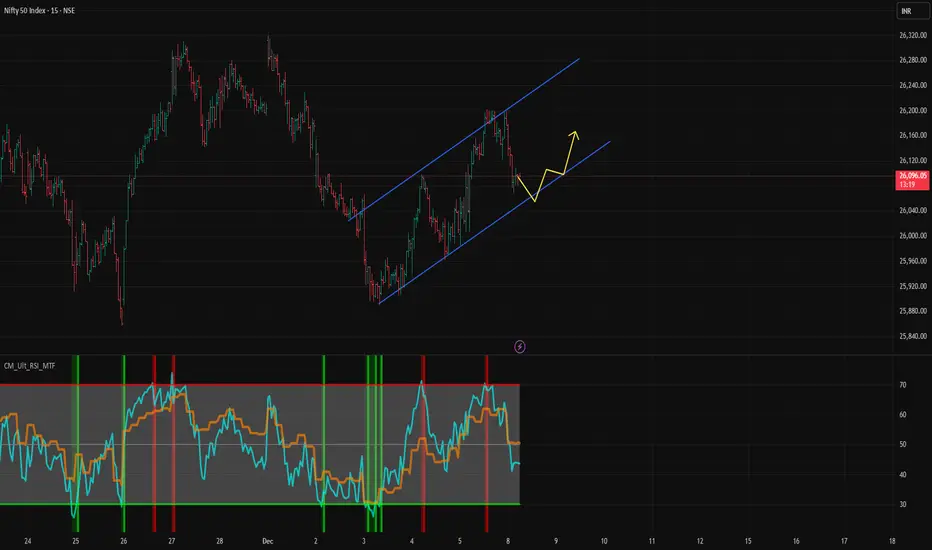
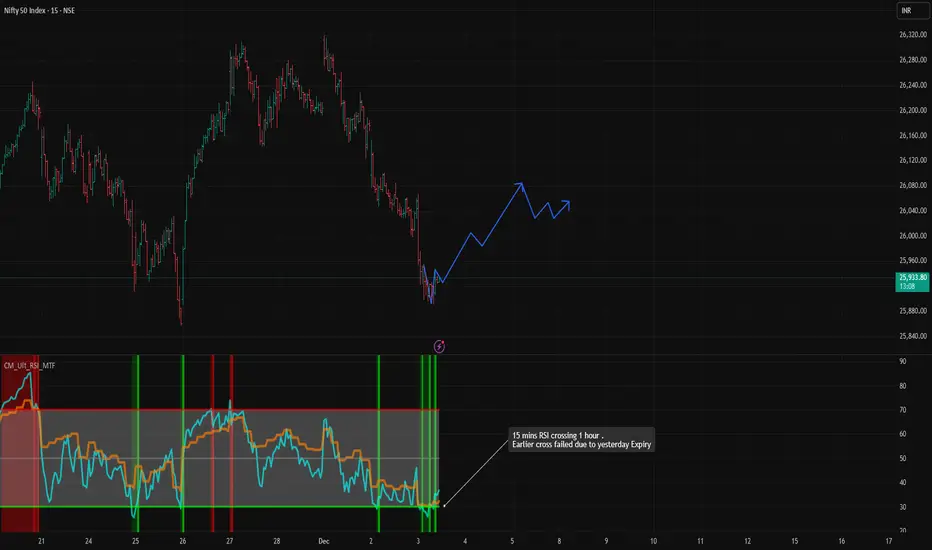
Nifty Set for Up move Intraday, 26060-26090 levelsSecond cross on RSI 15 mins, 1hour combo. Expecting little higher move than today's high and than consolidation.
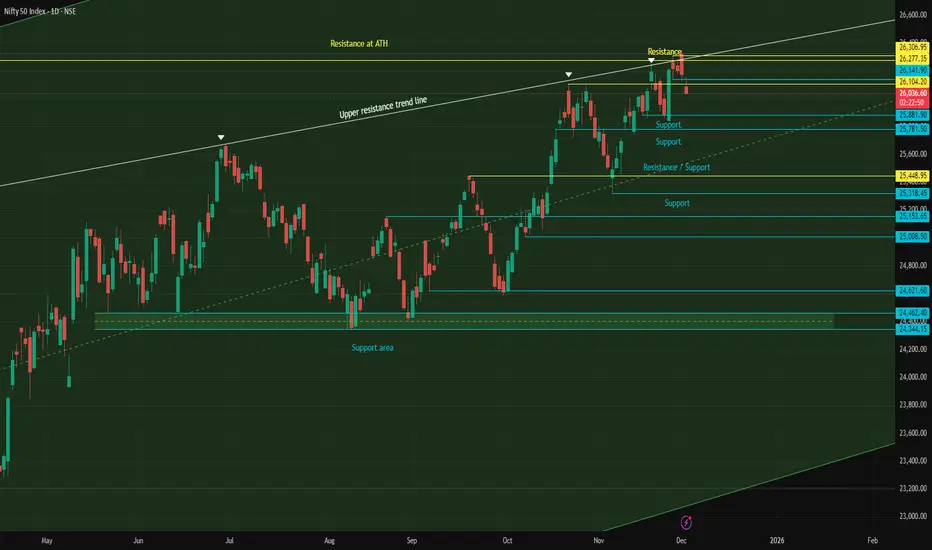
NIFTY - Expecting some more fallRejected at strong resistance level 26300 and upper resistance line.
If closed below 26050 then chances are high to hit the support level 25900 - 25850 again.
NIFTY Elliott Wave Analysis – 1H - 03-DEC-2025Price is currently reacting inside the support zone and may be completing Wave (ii) within Wave 3. As long as the support region holds, bullish continuation toward Wave (iii) and beyond remains valid.
Key Support Zone
🔹 25,855 – 25,713
🔹 Major support / invalidation: 25,313
Bullish Wave Structure
Wave 1 completed, Wave 2 bottomed at 25,313
Current decline is likely forming Wave (ii) pullback
Expected rise into Wave (iii) once support holds
Target zone for Wave iii = 27,050 – 27,500
Wave 3 larger target = 27,821 – 28,255 / 28,434 / 28,834
Trading Plan
📌 Bullish above 25,855 – buy on dips
🎯 Targets: 26,377 → 26,755 → 27,050 → 27,500 → 27,821+
🛑 Invalidation only below: 25,713 / major invalidation 25,313
Market Sentiment
⭐ Strong upward channel still intact
⭐ Wave 3 expected to be strongest trending move
⭐ Risk/Reward highly favorable near support
Bias
Bullish as long as price stays above 25,855–25,713 zone
Disclaimer
Educational Elliott Wave study. Not investment advice.

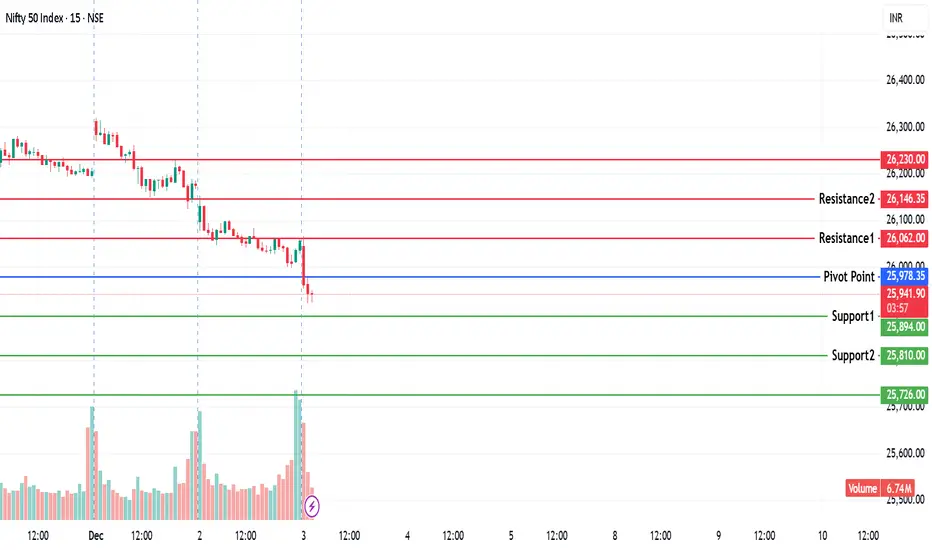
NIFTY KEY LEVELS FOR 03.12.2025NIFTY KEY LEVELS FOR 03.12.2025
Timeframe: 3 Minutes
If the candle stays above the pivot point, it is considered a bullish bias; if it remains below, it indicates a bearish bias. Price may reverse near Resistance 1 or Support 1. If it moves further, the next potential reversal zone is near Resistance 2 or Support 2. If these levels are also broken, we can expect the trend.
When a support or resistance level is broken, it often reverses its role; a broken resistance becomes the new support, and a broken support becomes the new resistance.
If the range(R2-S2) is narrow, the market may become volatile or trend strongly. If the range is wide, the market is more likely to remain sideways
please like and share my idea if you find it helpful
📢 Disclaimer
I am not a SEBI-registered financial adviser.
The information, views, and ideas shared here are purely for educational and informational purposes only. They are not intended as investment advice or a recommendation to buy, sell, or hold any financial instruments.
Please consult with your SEBI-registered financial advisor before making any trading or investment decisions.
Trading and investing in the stock market involves risk, and you should do your own research and analysis. You are solely responsible for any decisions made based on this research