26100 level Crucial for Direction - UP or DOWNSir/Mam,
Expiry idea was worked perfectly as given in the last Published Idea. You can check out that.
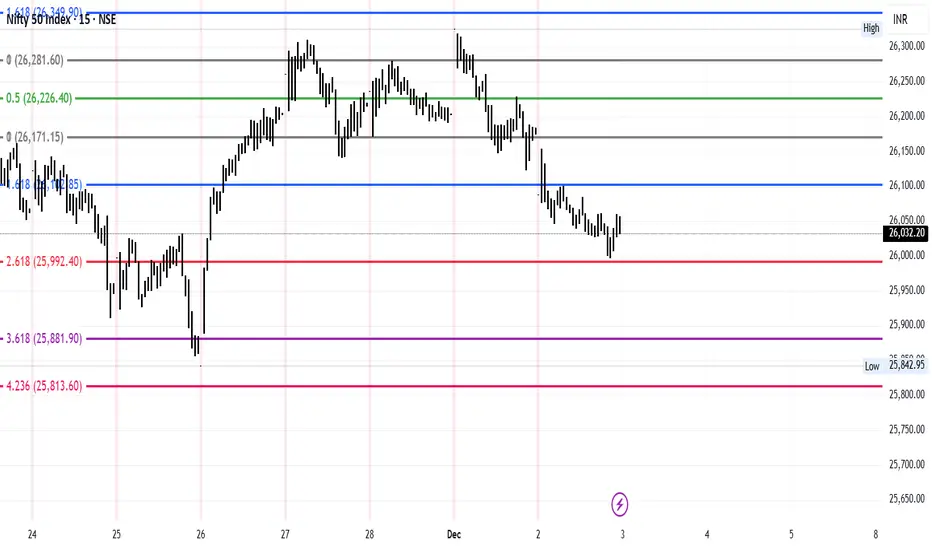
Now in the coming days, 26100 level which is crucial for the direction of the market as said in the subject itself.
For month expiry, buy CE and PE 26100 strike price.
Book profit for PE - if the level touch 25800 - 25750
Book profit for CE - if it touches 26250 - 26275
Now the price for that level is -
Nifty Dec 26100 CE - 362.60
Nifty Dec 26100 PE - 228.00
Have a nice day ahead.
Trade ideas
Nifty 50 Price Structure Analysis [03/12/2025: Wednesday]Top-Down Nifty 50 Price Structure Analysis for 03rd of December 2025. The day is Wednesday.
(1) Monthly Time Frame:
Red candle. So far, it is an inside month. The long-term trend is bullish, but the short-term trend shows weakness. Strong resistance is at levels 26300 and 26150. Strong support is at levels 26000 and 26850. The market is showing weakness at the all-time high (ATH). The view is indecisive to bearish.
(2) Weekly Time Frame:
Red Marubozu. The candle engulfed the body of the last week. A clear sign of weakness. Now major resistance is in the zone 26150 - 26100. Minor support is at level 26000. If level 26000 is breached, then level 25850 is reachable. No bearish trade till the price goes above the 26150 level. The view is bearish.
(3) Daily Time Frame:
Back-2-back 4 red days. Price gave a breakdown from level 26150, confirming the consolidation zone (26300 - 26150) as a major distribution zone. No, the previous consolidation zone is a major resistance. Take no bullish trade till price sustains above the level 26150. Every upmove should be doubted. A minor support is at level 26000. If level 26000 is breached, then there is a high chance of breaking down to level 25850. The view is bearish.
(4) 30-Minute Time Frame:
A clear sign of a sell-off. There is weakness in the market structure. Very strong resistance is at level 26150. No sign of bullishness until the price starts to trade above the level 26150. Every up move should be doubted. Minor support is at level 26000. The view is bearish.
No Trading Zone (NTZ): 26150 - 26000.
Major resistance: 26150.
Minor Support: 26000.
Probable first bearish target: 25850 (if there is a breakdown below 26000).
Bullish Scenario Set-Up:
(i) Price sustains above the opening price.
(ii) Price sustains above the level 26150.
(iii) Price forms a higher highs and higher lows structure above the level 26150.
Beairsh Scenario Set-Up:
(i) Price sustains below the opening price.
(ii) Price decisively breaches (or breaks down) level 26000.
Event:
No expiries on Wednesday. No high-impact event. However, a high-impact event is on 05 December (Friday) this week.
Expectations (Hypothesis and insight from the trade planning):
(i) There is a clear sign of weakness in the price structure. The view is bearish.
(ii) The previous zone of consolidation (26300 - 26150) is now a major zone is resistance. Any up move should be doubted.
(iii) Take no bullish trade till price forms a higher highs and lower lows structure above the level 26150.
(iv) Look only for the bearish trade.
(v) In case either a bullish or a bearish scenario does not happen, then don't trade. Trade only when conditions are met.
NOTE:
"Mark your points. Trade your points. Price is God. Anything can happen. Therefore, trade what you see, not what you believe."
Happy Trading!
nifty50 analysis(2/12/2025).(EXPIRY).
CPR: Narrow + overlapping lower cpr: Sideways to bearish.
FII: -1,171.31 Sold
DII: 2,558.93 bought.
Highest OI:
Resistance:26300,26400.
Support :26000.
conclusion:
My pov:
1.Today expiry so, market can be no moment at all/ can be volatile also.
2.26000 strike is the only support.
3.lets wait and watch how the market is reacting today, because cpr showing a bearish to sideways today if price close and cross 26000.
psychology fact:
when you feel good, you’ll increase your chances of making a profit
note:
8moving average ling is blue colour.
20moving average line is green colour
50moving average line is red colour.
200moving average line is black colour.
cpr is for trend analysis.
MA line is for support and resistance.
Disclaimer:
Iam not Sebi registered so i started this as a hobby, please do your own analysis, any profit/loss you gained is not my concern. I can be wrong please do not take it seriously thank you.

Nifty again entered in the Sell-On-Rise mode NSE:NIFTY didn’t move exactly the way we planned today.
But it still delivered the move I was expecting — just not in the structure I wanted.
Happens.
This is the beauty of the market.
It keeps challenging you, keeps you curious, keeps you sharp.
And that’s what makes this profession worth chasing.
Now let’s see what’s lined up for tomorrow:
Nifty’s Pivot has climbed to 26208, but price closed below it — which clearly shows a short buildup today.
PP is 0.13, meaning the space is tight and a sharp move may come in the direction of the prevailing trend.
Our Macro indicator also dropped by 8 points — further confirming the short buildup.
So the plan for tomorrow is simple:
Unless Nifty gives a strong close above 26300, I’ll stay in Sell-on-Rise mode for the index.
This does NOT mean the market is entering a downtrend.
Overall trend is still bullish — in fact, strength is quietly returning in Smallcaps and the broader market.
I’m only highlighting what the index data is signaling so we can capture intraday opportunities safely.
Resistance is now at 26280,
Support sits at 26050.
Market health has already turned Orange from Green, which indicates early signs of a shift.
Sector-wise, Auto is showing great momentum and relative strength.
That’s all for today.
Take care. Have a profitable tomorrow.

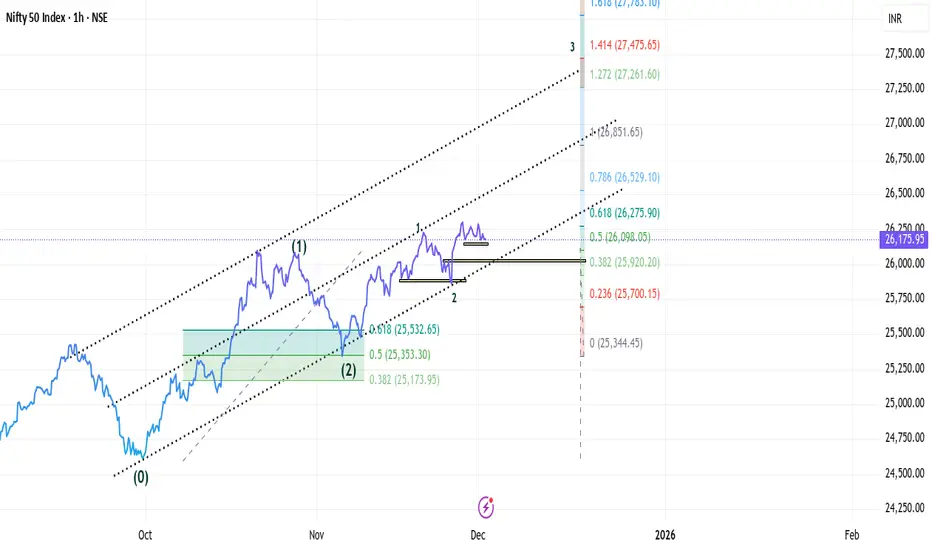
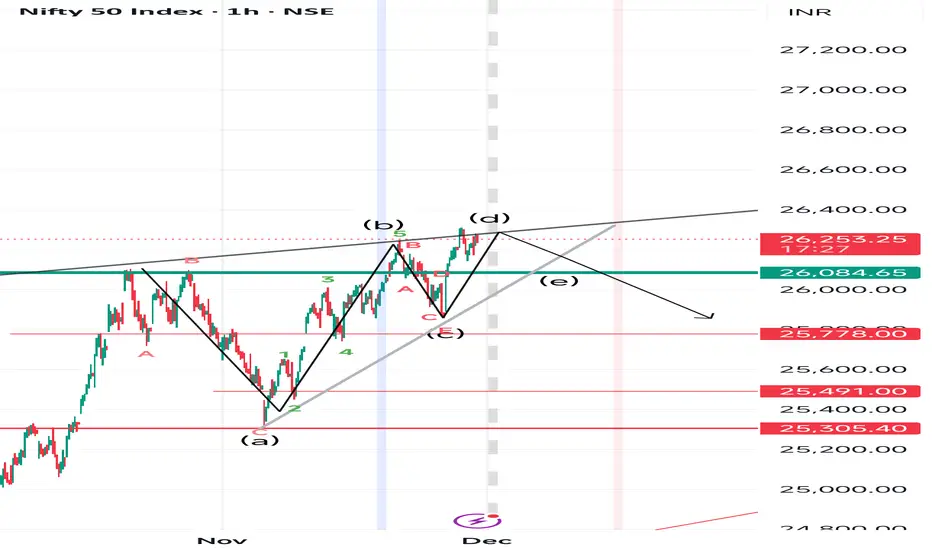
NiftyElliote wave analysis
Nifty is starting now 3rd of 3rd wave as per count..
Buy at CMP (26175)
SL (25850) OR break of 0-2 trend line
Target 1 (27058)
Target 2 (27783)
Sell @26200 - 26225 Levels - Nifty 50Sir/Mam,
Let the market go upside till 26225 and buy PE and CE 26250 strike price.
Or if the level not passed 26225 then wait till 2 PM
No trade if the market not touched 26225 or if it is below 26100 then wait to reach 26050 - 26000 for ONE SIDE buy only CE - 25950 strike price.
Comment me tomorrow if this works approx.
Have a nice day
HINT - Waiting for the perfect level shows patience of trader.

Nifty 50 Price Structure Analysis [01/12/2025: Monday]Top-Down Nifty 50 Price Structure Analysis for 01st December 2025. The day is Monday.
(1) Monthly Time Frame:
A strong bullish candle. Major support is 26100. Major resistance is 26300. The view is bullish.
(2) Weekly Time Frame:
A green long-legged doji candle. The major support is 26100. The major resistance is 26300. The view is bullish to indecisive. Stay bullish until 26100 is decisively broken. Rest stay bullish.
(3) Daily Time Frame:
Back-2-Back 2 days red spinning tops. The two days of indecisive price movement came after a massive bullish move on 26 November 2025. So, a major consolidation is happening in the zone of 26300 - 26150. The zone is also a no-trading zone (NTZ). The view is indecisive. No long and no short. Friday's candle is a perfect inside candle and a spinning top. No bullish trade till 26300 is decisively breached.
(4) 30-Minute Time Frame:
Price has formed a perfect pennant. It means the price structure is indecisive. Market needs much bullish force to breach the levels 26250, 26277.35 {previous all-time high (ATH)}, and 26300. Price closed above 26200. The view is indecisive till either side breaks is confirmed in the markets.
Bullish Scenario Set-Up:
(i) Price sustains above the opening price.
(ii) Price starts to trade above 26250.
(iii) Price breaks out of the pennant.
(iv) Price shows the promise of breaking 3 resistances - 26250, 26277.35 (previous ATH), and 26300.
Bearish Scenario Set-Up:
(i) Price sustains below the opening price.
(ii) Price breaks down the pennant.
(iii) Price decisively trades below the level 25150 and shows signs of breaching 26100.
No Trading Zone (NTZ): 26300 - 26150.
Events: No expiries on Monday. No high-impact events on Monday.
Expectations (Hypothesis from Trade Planning):
As per the present scenario, the market is indecisive. Structural clarity is possible when the price gives a breakout or breakdown from the pennant. Prices trading above 26250 will show signs of bullish continuation. On the contrary, price trading below 26150 will show signs of bearishness. Lastly, price needs a strong bullish force to breach levels 26250, 26277.55, and 26300. Wait patiently for either a breakout or breakdown.
NOTE:
"Mark your points. Trade your points. Price is God. Anything can happen. Therefore, trade what you see, not what you believe."
Happy Trading!
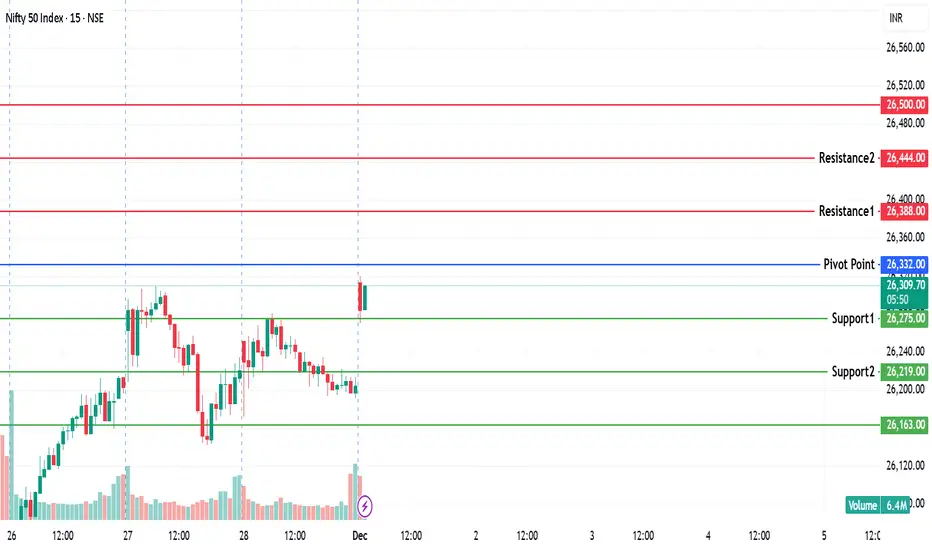
NIFTY KEY LEVELS FOR 01.12.2025NIFTY KEY LEVELS FOR 01.12.2025
Timeframe: 3 Minutes
If the candle stays above the pivot point, it is considered a bullish bias; if it remains below, it indicates a bearish bias. Price may reverse near Resistance 1 or Support 1. If it moves further, the next potential reversal zone is near Resistance 2 or Support 2. If these levels are also broken, we can expect the trend.
When a support or resistance level is broken, it often reverses its role; a broken resistance becomes the new support, and a broken support becomes the new resistance.
If the range(R2-S2) is narrow, the market may become volatile or trend strongly. If the range is wide, the market is more likely to remain sideways
please like and share my idea if you find it helpful
📢 Disclaimer
I am not a SEBI-registered financial adviser.
The information, views, and ideas shared here are purely for educational and informational purposes only. They are not intended as investment advice or a recommendation to buy, sell, or hold any financial instruments.
Please consult with your SEBI-registered financial advisor before making any trading or investment decisions.
Trading and investing in the stock market involves risk, and you should do your own research and analysis. You are solely responsible for any decisions made based on this research.
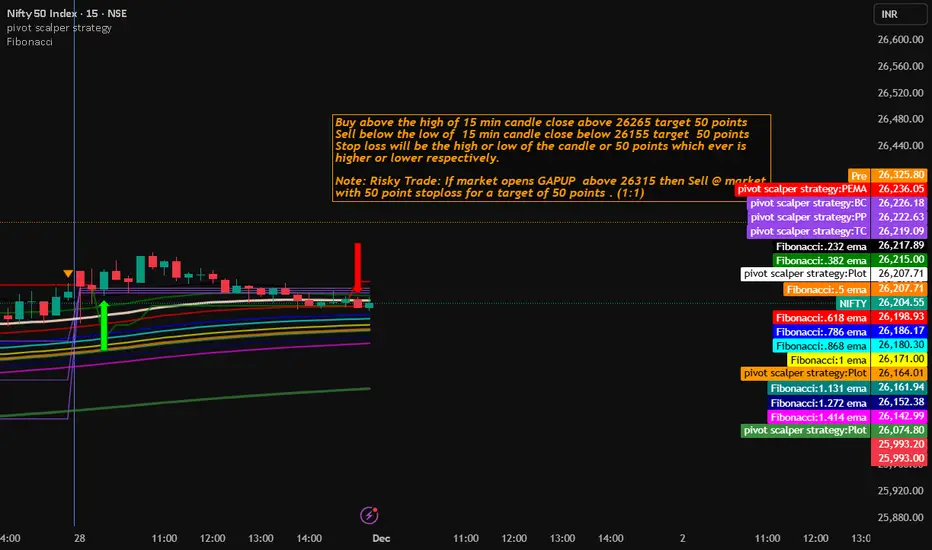
Nifty Trading Strategy for 01st December 2025📊 NIFTY 15-MIN BREAKOUT STRATEGY
🟢 BUY Setup
🔼 Buy above the High of the 15-min candle
✔️ Condition → Candle must close above ₹26,265
🎯 Target: + 50 points
🛡 Stop-Loss:
High of breakout candle OR 50 points → Whichever is higher
🔴 SELL Setup
🔽 Sell below the Low of the 15-min candle
✔️ Condition → Candle must close below ₹26,155
🎯 Target: + 50 points
🛡 Stop-Loss:
Low of breakdown candle OR 50 points → Whichever is lower
⚠️ RISKY TRADE (Aggressive Entry)
If market opens GAP-UP above 26,315:
🔻 Sell @ Market
🎯 Target → +50 points
🛡 SL → 50 points
Risk-Reward = 1:1
📌 Important Notes
📍 Follow only after 15-min candle closes
📍 Avoid trading during major news/event volatility
📍 Risk management is the key — do not over-leverage!
📍 Suitable for intraday traders only
⚠️ DISCLAIMER
🚫 This is not investment advice.
🔍 I am not SEBI registered and this is only for educational & study purpose.
💹 You are responsible for your trades & risk management.
Nifty50 Today(1/12/2025) analysis
CPR: Narrow + outside cpr: Sideways to bearish.
FII: -3,795.72 Sold
DII: 4,148.48 bought.
Highest OI:
Resistance:26300,26400.
Support :26000.
conclusion:
My pov:
1.Market opens with gap up but cpr shows a bearish view in techinical analysis ,there is two ways to confirm it if breakes ATH and sustains in 1hr candle and if it breaks and sustain above R1,also check volume . then go bullish.
2.market can be sideways to bearish.
3.confirmation is the key and wait for clarity.
psychology fact : most of the time, not doing anything is the best trading exercise you can ever do.
note:
8moving average ling is blue colour.
20moving average line is green colour
50moving average line is red colour.
200moving average line is black colour.
cpr is for trend analysis.
MA line is for support and resistance.
Disclaimer:
Iam not Sebi registered so i started this as a hobby, please do your own analysis, any profit/loss you gained is not my concern. I can be wrong please do not take it seriously thank you.

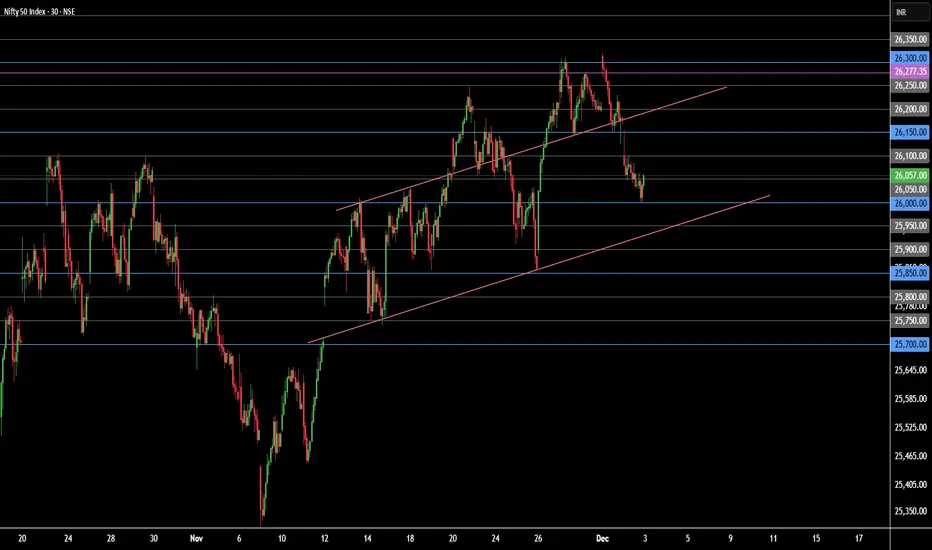
Weekly Analysis Nifty.....Last week Nifty had both side movement and provided good swing trades at both the sides and eventually closed positively at weekly level. It had broken all time high but could not sustain to close above it, eventually closed below all-time high and last week’s high. Last two days were range bound, indecision market. It seems players are consolidating the price for further move. We may see some consolidation and retrace till ~26200-100 range and then a possible breakout. Breakout may wait for any impactful global or domestic news/event.
Critical points ……………….
1. ~26200-100 range for consolidation/retrace.
2. Currently 1 Hour time frame is forming a W pattern. Which is again a positive signg.
3. We may see some good bullish LTF patter at the given range and then possible breakout if supported with even/new and volume.
4. If breakout support with volume and positive events, we may see 26500 and 26900 levels quickly.
Note – if you liked this analysis, please boost the idea so that other can also get benefit of it.
Also follow me for notification for incoming ideas.
Also Feel free to comment if you have any input to share.
Join me on live stream for real time update.
Disclaimer: This analysis is for educational purposes only and does not constitute investment advice. Please do your own research (DYOR) and check with your financial advisor before making any trading decisions.

nifty bullish chartaccording to chart pattern nifty bullish and also Fibonacci level 0.382 test and goes to upside

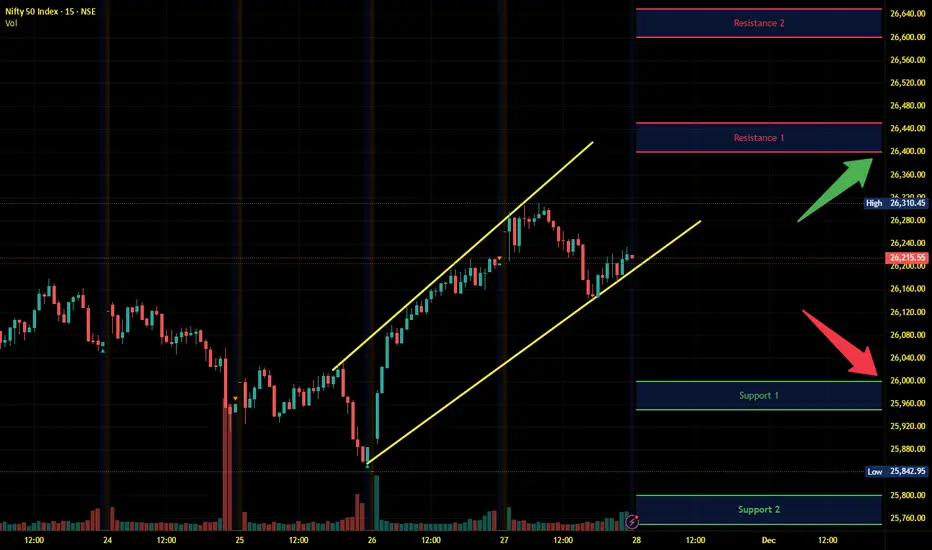
Nifty Intraday Analysis for 28th November 2025NSE:NIFTY
Index has resistance near 26400 – 26450 range and if index crosses and sustains above this level then may reach near 26600 – 26650 range.
Nifty has immediate support near 26000 – 25950 range and if this support is broken then index may tank near 25800 – 25750 range.
The uptrend is intact and a positive close will set the uptrend momentum for the next week.
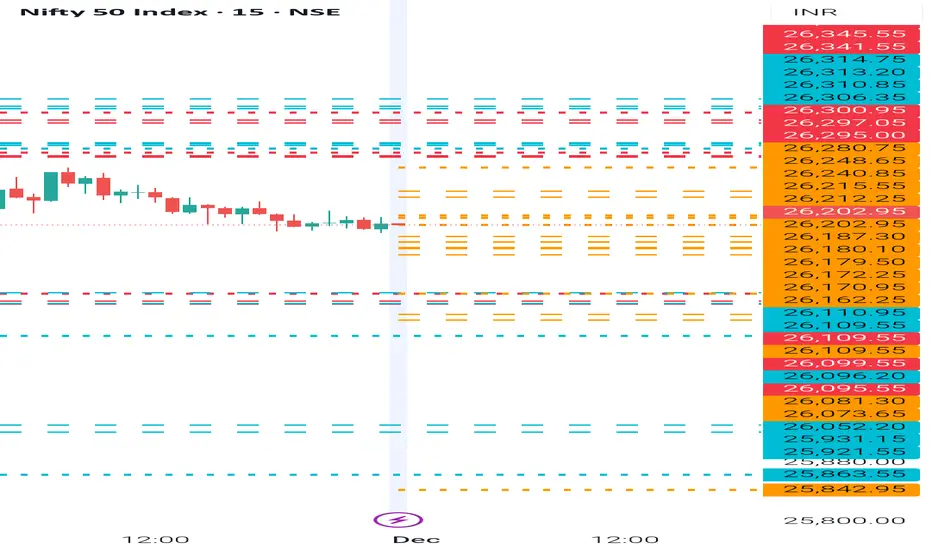
NIFTY- Intraday Levels - 1st December 2025If NIFTY sustain above 26202/12/15 above this bullish then around 26240/48 above more bullish around 26280 above this wait more levels marked on chart
If NIFTY sustain below 26187/62 below this bearish then 26110 support below this more bearish then 26099/95 strong level then very very strong level and last hope 26081/73 below this wait more levels marked on chart
My view :-
"My viewpoint, offered purely for analytical consideration, The trading thesis is: Nifty (bearish tactical approach: sell on rise)
This analysis is highly speculative and is not guaranteed to be accurate; therefore, the implementation of stringent risk controls is non-negotiable for mitigating trade risk."
Consider some buffer points in above levels.
Please do your due diligence before trading or investment.
**Disclaimer -
I am not a SEBI registered analyst or advisor. I does not represent or endorse the accuracy or reliability of any information, conversation, or content. Stock trading is inherently risky and the users agree to assume complete and full responsibility for the outcomes of all trading decisions that they make, including but not limited to loss of capital. None of these communications should be construed as an offer to buy or sell securities, nor advice to do so. The users understands and acknowledges that there is a very high risk involved in trading securities. By using this information, the user agrees that use of this information is entirely at their own risk.
Thank you.
Part 2 Ride The Big Moves Option Trading in India (NSE)
Popular tradable contracts:
NIFTY 50 (weekly & monthly expiry)
BANK NIFTY (weekly expiry)
FINNIFTY (weekly expiry)
MIDCAP NIFTY
Stock Options
Lot sizes:
Nifty: 25
Bank Nifty: 15
Finnifty: 40 (subject to change by NSE)
Stock options have higher margins and different lot sizes.

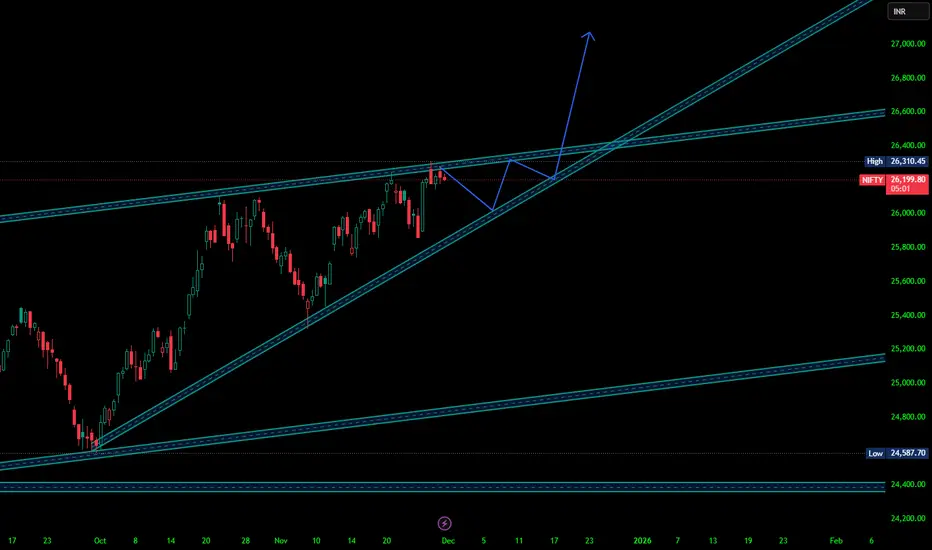
NIFTY 50 index next moveExcellent technical structure
Trend Direction: Bullish - Higher highs, higher lows intact
Current Phase: Pullback/Consolidation - Healthy correction expected
Risk Level: Medium - Not at ideal entry, better entry coming
Overall Probability: Bullish - Channel likely to continue
Wait for pullback to 25,600 zone, then initiate long positions with defined risk at 25,350. Target 26,300 initially, then 26,800-27,000 on breakout. This offers the best risk/reward profile with high probability of success.
Do not Chase current price
Do not Buy at resistance (26,300)
This chart represents a textbook ascending channel in a strong uptrend, currently at a decision point after testing resistance. The most prudent approach is patience for the high-probability pullback to support.
DISCLAIMER: This information is provided for educational purposes only and should not be considered financial, investment, or trading advice.
No guarantee of profits: Past performance and theoretical models do not guarantee future results. Trading and investing involve substantial risk of loss.
Not a recommendation: This script illustration does not constitute a recommendation to buy, sell, or hold any financial instrument.
Do your own research: Always conduct thorough independent research and consider consulting with a qualified financial advisor before making any trading decisions.
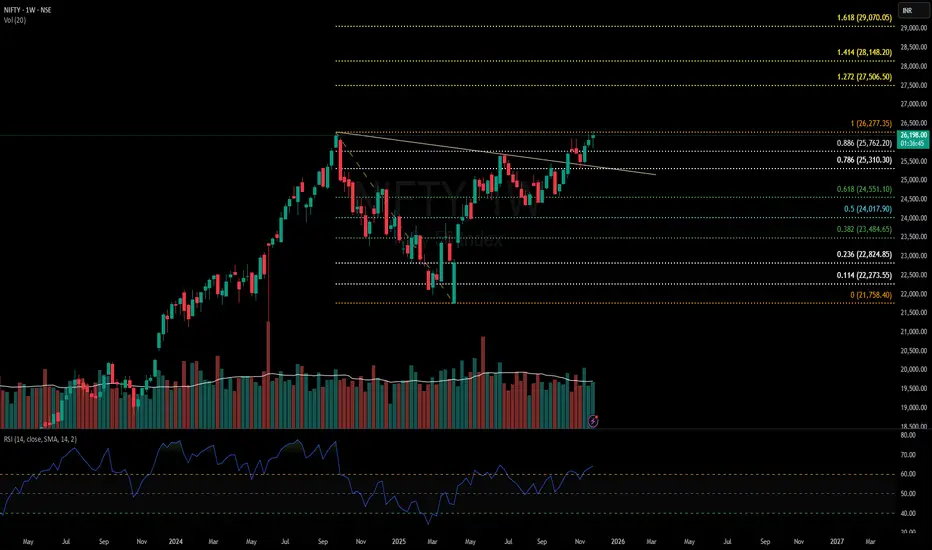
NIfty50 Analysis: Is it start of new bull run or a bull trap?Nifty50 Has given a cup& handle breakout and has already retested this breakout.
Currently, it is hovering near ATH and already looks ready for a breakout.
If this breakout sustains, we might see a good rally coming till budget(Feb'26) and levels to watch according to fib are 27500, 28150 & 29000.
However, December is a favourite season for FIIs to offload money and a correction is historically seen during Christmas season. So, there is a high probability of a bull trap formation as well.
25300 will be a crucial support for Nifty. a breakdown of this level will be confirmation of bull trap and we might see a sharp fall towards 24000 level.
I will suggest to keep a watch on Nifty price action if you have any swing trades open.
Rising wedge patternA leading diagonal is a five-wave Elliott Wave pattern that occurs at the beginning of a trend, found in wave 1 or A, and signals a continuation of the trend. It differs from an impulse wave by having a 5-3-5-3-5 internal structure and features the overlap of waves 4 and 1. Leading diagonals appear as converging wedge shapes and can be either contracting or expanding.
Daily Analysis: Nifty 28/11/25Targets on either side for Nifty based on the breakout of support and resistance levels as mentioned.

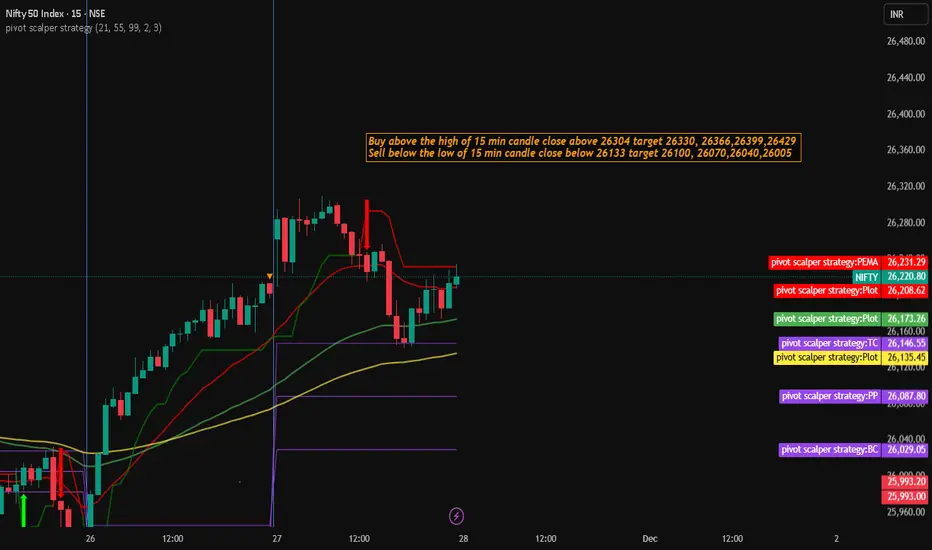
Nifty Trading Strategy for 28th November 2025📊 NIFTY Trading Plan – Levels to Watch
🟢 BUY SETUP
⚠️ Condition to Enter:
Enter only if price closes above the High of the 15-minute candle and sustains above 26304.
This confirms bullish strength and continuation.
🎯 Target Levels After Breakout:
26330 – First resistance zone / partial booking recommended
26366 – Momentum continuation target
26399 – Higher resistance breakout level
26429 – Final target zone for intraday if trend remains strong
🔒 Risk Management:
Place SL below breakout candle low
Trail SL as targets hit
Avoid chasing if breakout fails to sustain
🔻 SELL SETUP
⚠️ Condition to Enter:
Enter only if price closes below the Low of the 15-minute candle and sustains below 26133.
This signals bearish pressure and downside possibility.
🎯 Target Levels on Breakdown:
26100 – First support zone
26070 – Continuation level
26040 – Deeper decline target
26005 – Extended intraday target if selling remains strong
🔒 Risk Management:
SL just above breakdown candle
Book partials on every target
Do not short if price reverses back above breakdown level
🧠 Important Notes
Always trade with SL 🔐
Wait for candle close confirmation — wick breakout is risky
Do not over-leverage — position sizing matters 💰
Plan → Execute → Secure profits → Protect capital
⚠️ Disclaimer
📌 This is purely for educational and informational purposes.
🚫 I am not SEBI registered.
📉 Market trading involves risk — do your own analysis before taking any trade.
#NIFTY Intraday Support and Resistance Levels - 28/11/2025Nifty is expected to open with a slightly gap-up start today, reflecting a mild bullish tone as the market attempts to build on the recent recovery. The price is hovering near a crucial structure zone, and holding above the 26250–26300 range will be essential for sustaining upward momentum. If Nifty manages to remain stable above this breakout area after the opening, the long setup becomes active, targeting 26350, 26400, and 26450+. A strong continuation move above 26500 can further accelerate the upside, potentially pushing the index toward the higher targets of 26650, 26700, and even 26750+, especially if broader sentiment supports the move.
On the downside, any weakness will only be confirmed if the index faces rejection from the 26250–26200 zone, where a reversal short opportunity opens up. This downside structure carries immediate targets at 26150, 26050, and 26000-, indicating that sellers may try to reclaim short-term control if Nifty fails to hold the breakout region. Until then, the bias remains moderately positive due to the slightly gap-up opening, and intraday direction will largely depend on how price behaves around these key reaction levels.

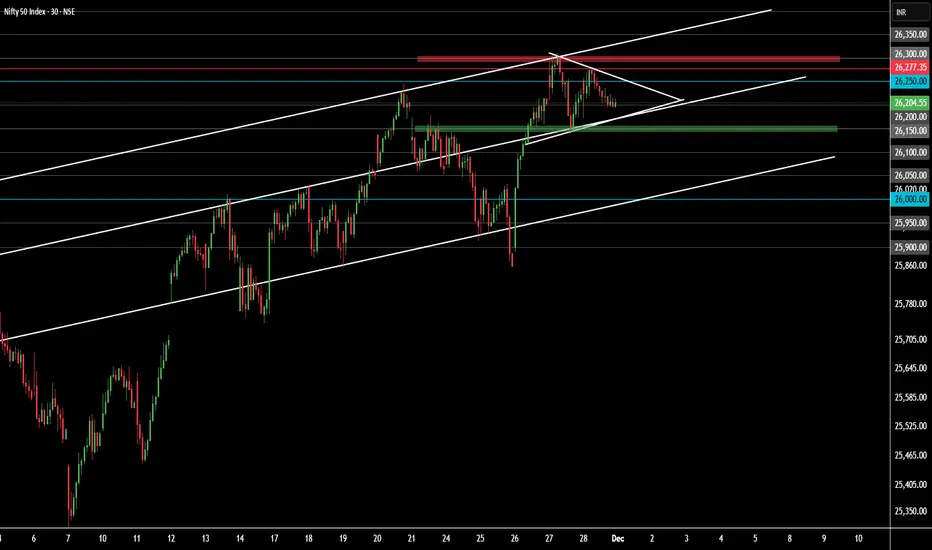
ATH is here for NIFTY! What's next!?As we can see NIFTY has finally achieved new ATH which also a previous swing and as per technical POV, this swing can act as a RESISTANCE. Hence any signs of rejections from here can be considered an opportunity to short. moreover, no fresh positions should be made at current levels.

Nifty Ready for a Sharp Move — But Volume Says “Be Careful”So exactly as written yesterday, NSE:NIFTY trapped both sellers and buyers today.
A perfect inside-bar style liquidity grab.
Now let’s see what today’s data says for tomorrow:
• Pivot has moved up to 26226
• Macro data strongly positive
• Buyers beat sellers by 28 million
• PP is extremely tight — just 0.03%
These points clearly signal that tomorrow can be a sharp bullish day.
But… something very strange is happening underneath.
Price is moving up, but the 10-day average volume is falling every single day.
This means people are acting in greed — not confidence.
So even if a bullish move comes tomorrow, it can be a trap.
That’s why building long positions on the index is not advised.
Playing it day-by-day would be the smartest thing to do until average volume aligns with price again.
Resistance is at 26277.
I’ll take a trade only if we get an hourly close above this level.
For intraday traders, buying the dip is fine — but only till 26026.
Below that, I won’t touch the long side because the trap from bears is very clear.
📊 Levels at a Glance:
Pivot: 26226
Support: 26026
Resistance: 26277
PP: 0.03%
Bias: Day-by-Day (Avoid index positional longs)
Market View: Sharp move possible but volume divergence = trap potential
That will be all for today.
Take care. Have a profitable tomorrow.
