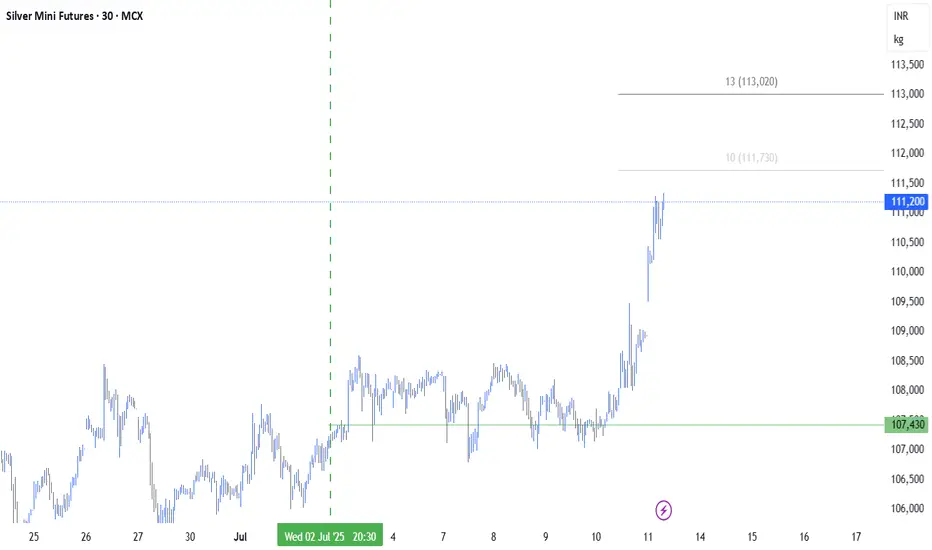
12R locked in on $MCX:SILVERMIC1!12R locked in on MCX:SILVERMIC1!
I entered with conviction, managed with discipline.
Risk was tight, exits were clear, emotions silent.
Price moved, I trailed. Trend built, I rose with it.
No rush, no greed — just system and patience.
This is sigma trading: controlled risk, amplified reward.
SILVERZ2025 trade ideas
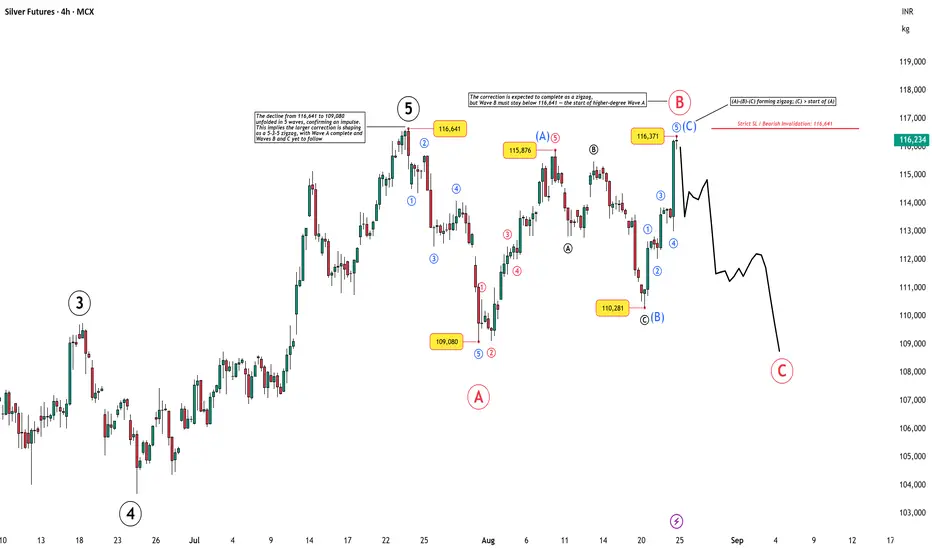
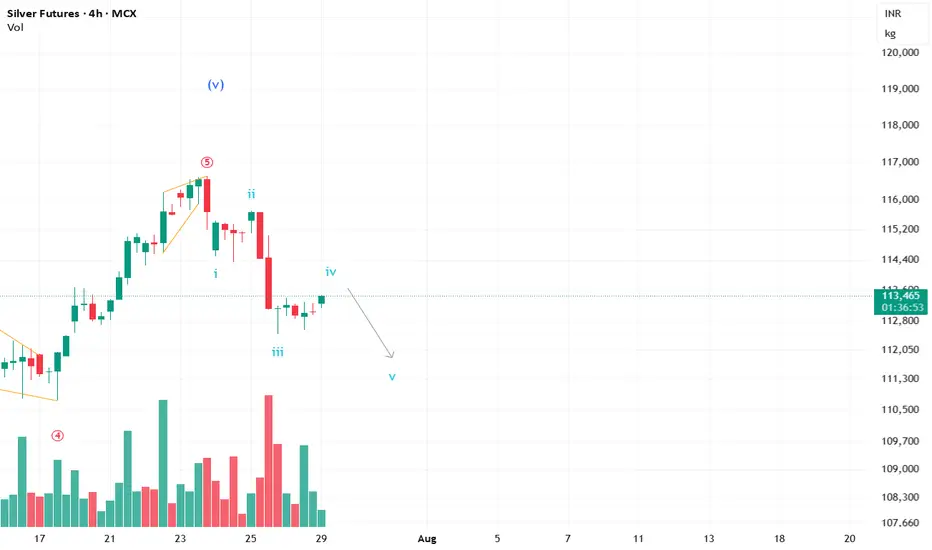
Silver Futures (4H) – Zigzag Correction in ProgressThe decline from 116,641 → 109,080 unfolded in 5 waves, confirming an impulse. This sets the stage for a 5-3-5 zigzag correction . With Wave A complete, the market is now advancing in Wave B, expected to resolve as a zigzag.
A strict bearish invalidation level is marked at 116,641 . As long as prices remain below this level, the expectation is for Wave C down to follow and complete the zigzag sequence.
📌 Key Levels:
Invalidation (SL): 116,641
Wave B unfolding as zigzag
Wave C down expected next
Disclaimer: This analysis is for educational purposes only and does not constitute investment advice. Please do your own research (DYOR) before making any trading decisions.
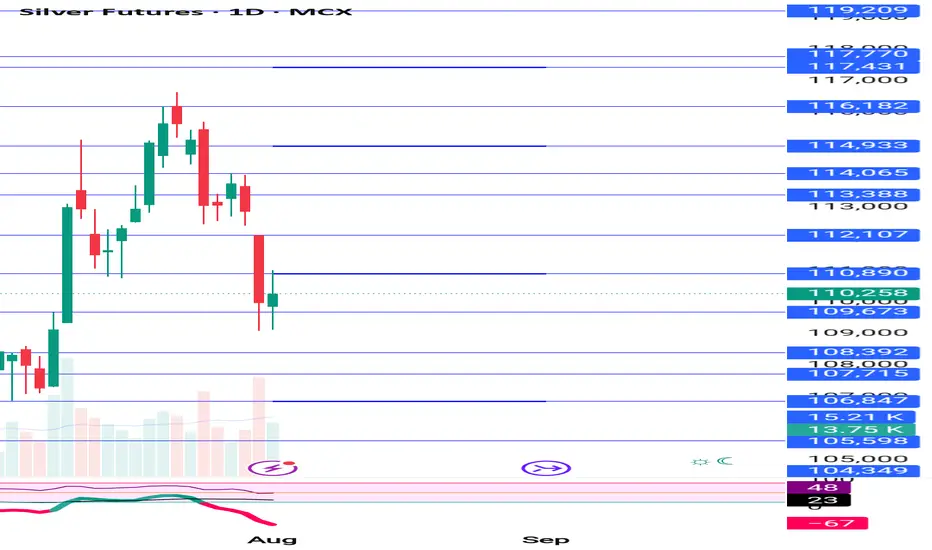
SILVER,silver look more bullish till 113550 to 114000 ++silver retrace 112300 to 112000,wait retrace dip buy

Silver still more fall possible 700-800 points avoid any buySilver holding sell trade from 113550 , still more fall possible of 700-800 points avoid any buy trade, safe traders can book profit now also ,since fall will come on comex but mcx may be not open tomorrow morning that also possible
Silver holding sell trade from 113550-113600 , sl 114500Silver we are holding sell trade from 113550 .
Until 114500 not break sell on rise will continue.
Downside target 112800, 112100, 111500, 110900
How My Harmonic pattern projection Indicator work is explained below :
Recent High or Low :
D-0% is our recent low or high
Profit booking zone ( Early / Risky entry) : D 11.8% -D 16.1 % is
range if break them profit booking start on uptrend or downtrend but only profit booking, trend not changed
SL reversal zone (Safe entry ) : SL 23% and SL 25% is reversal zone if break then trend reverse and we can take reverse trade
Target : T1, T2, T3, T4 and .
Are our Target zone
Any Upside or downside level will activate only if break 1st level then 2nd will be active if break 2nd then 3rd will be active.
Total we have 7 important level which are support and resistance area
Until , 16% not break uptrend will continue if break then profit booking will start.
If break 25% then fresh downtrend will start then T1, T2,T3 will activate
1,3,5,10,15,20 minutes are short term levels.
30 minutes 60 minutes , 2 hours,3 hours, ... 1 day and 1 week chart positional and long term levels

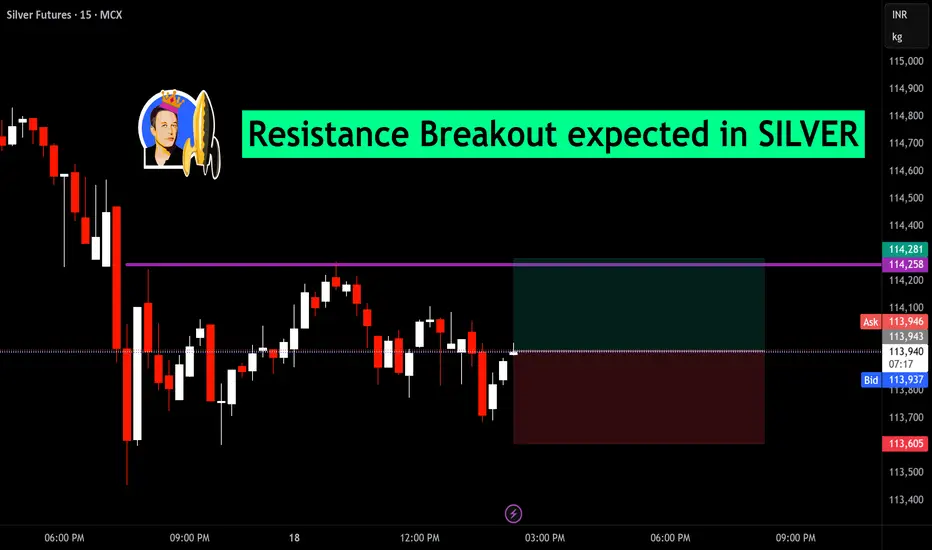
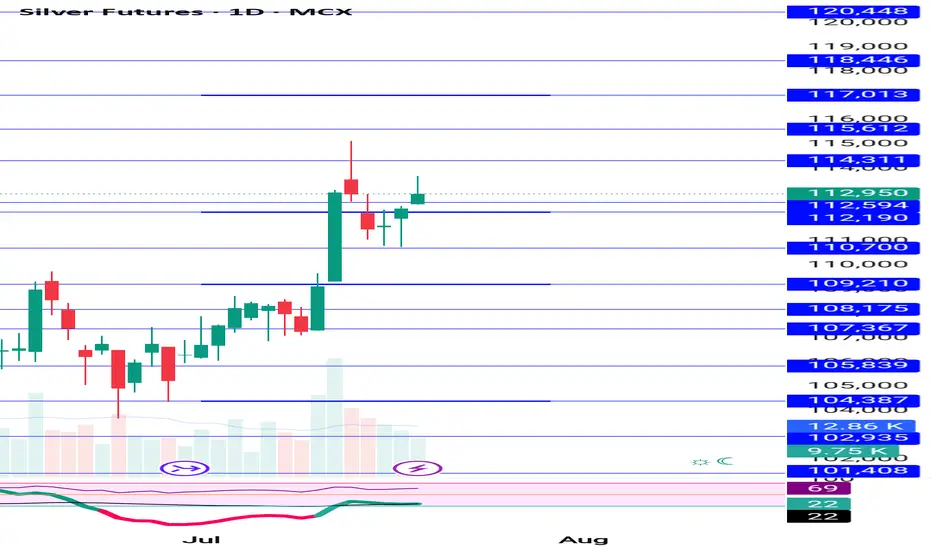
Resistance Breakout expected in SILVERilver Futures (MCX) are approaching a key resistance zone at ₹114,258. Price action shows multiple tests of this level, suggesting strong buying interest and a potential breakout. If this resistance is cleared, bullish momentum may accelerate, offering an attractive long opportunity for traders. Risk management is crucial; consider placing stops below recent support to protect capital. Monitor for confirmation through sustained price action above the resistance and increased volume. This set-up highlights evolving strength in silver and could pave the way for a further move higher. This analysis is for educational purposes and not investment advice.
Silver Reversal In PlayLast trade delivered 12R.
Now positioned again in MCX:SILVERMIC1! .
Reversal signs clear, momentum building.
Risk defined, rules followed, no guessing.
Stops trail, trend decides.
Let’s see where this one runs.

Silver good to long.Silver is trending in uptrend in weekly timeframe. Geopolitical tension will give spur to silver. I think its very good opportunity to long silver above last weeks high.
MCX Silver Ready For Big Dhamaka - Neal Bhai ReportsMCX Silver Prices Ready For Big Dhamaka, What you think up or down? - Neal Bhai Reports
Silver bought at 113100 today booked 2000 points profit Silver buy given at 113100 today booked 2000 points profit at 115100 ,
Silver levels given on chart buy on dip .
Upmove will continue.
There will be no deal on Trump and Putin meeting.

Silver sell recommended near 115600 better to book profit nowSilver sell given near 115600 , better to book profit on sell trade .
Updated levels given on chart , 38.20 to 38.25 , 38.65,38.70 resistance area on silver comex
Rate cuts geopolitical issues, tarrif will act both side move play safe , risk is high at current market scenario

Silver if break 113000 then sell on rise again levels on chart Silver sell on rise again if break 113000 , today RBI policy will bring USDINR down effect will be on gold and silver .
Both side levels mentioned on chart
Silver sell on rise recommended on last week, updated level Silver sell on rise recommended last week silver fall good ,
Updated levels given on chart for next week silver still negative sell on rise again target previous week low near
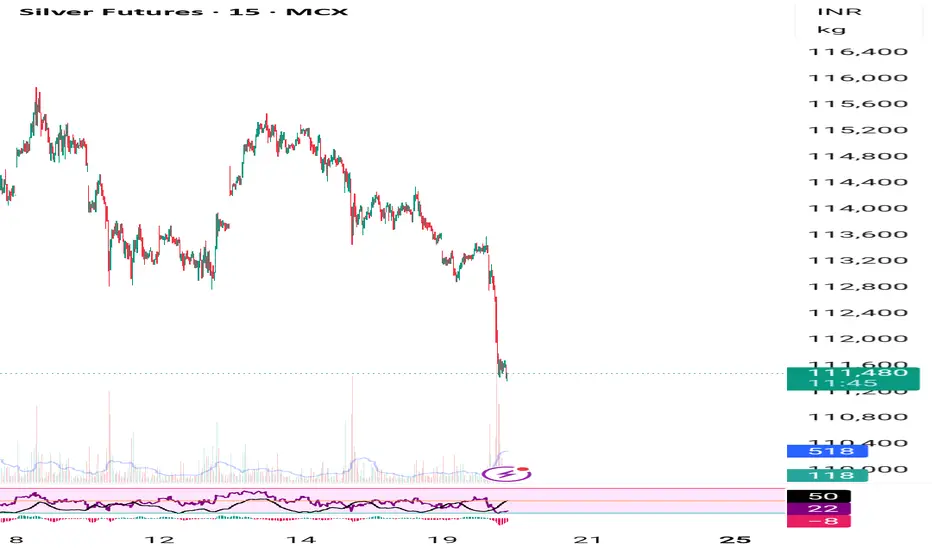
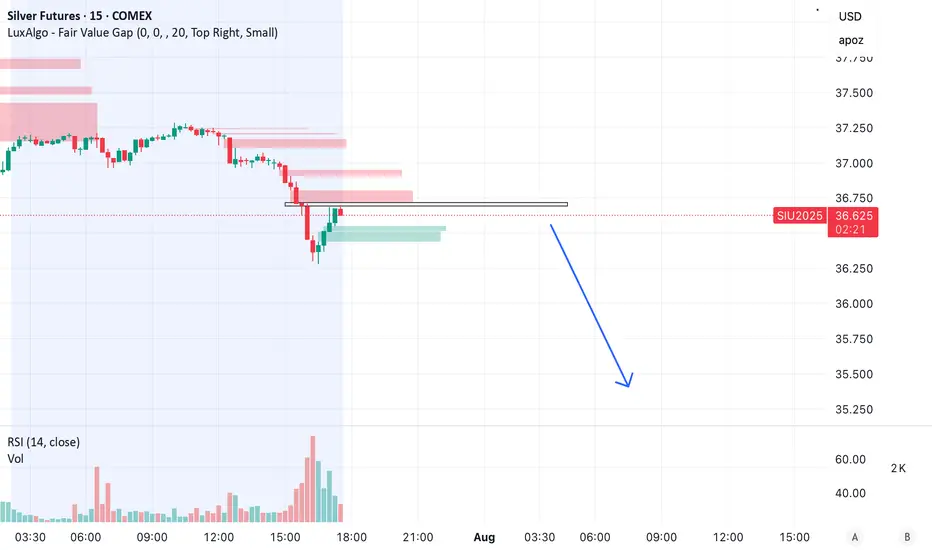
Silver’s Dead Cat Bounce Looks Tired
⸻
Technical Analysis
1. Price rejection at supply zone
• Price has tested a previous area of heavy selling and failed to break above it.
• This is a textbook lower high after a sharp down-move, indicating potential continuation of the downtrend.
2. Fair Value Gap (FVG) resistance
• Shows a visible sell-side imbalance overhead.
• Price is reacting negatively after filling into the upper range of that FVG zone — typically a bearish sign.
• No visible buy-side imbalance nearby to support price.
3. Weak volume on bounce
• The bounce from the recent low happened on declining volume.
• Previous drop had stronger volume, suggesting dominant seller interest.
4. RSI likely rejecting near 50
• While RSI isn’t shown, based on the structure, this looks like a classic RSI rejection near 50.
• In downtrends, RSI failing to cross above 50 confirms bearish control.
⸻
Macro Analysis
1. Strong dollar and real yields
• The US dollar is strengthening again after recent macro data, including strong GDP and sticky inflation.
• Real yields remain high, which suppresses precious metal rallies.
2. No inflation or China tailwinds
• Silver typically needs either inflationary panic or strong industrial demand.
• Neither is visible — China’s demand is weak and global PMIs remain soft.
3. Fed remains hawkish
• With economic data still coming in strong, there’s no reason for the Fed to pivot.
• That keeps pressure on non-yielding assets like silver.
⸻
Positioning View
Silver isn’t leading the market. It’s trading in reaction to macro forces, not in anticipation. Until inflation surprises, industrial activity surges, or the Fed clearly pivots, this chart setup aligns with the broader narrative — lower prices ahead.
⸻
Trade Setup
• Entry: $36.60–$36.65
• Stop-loss: $36.85 (just above resistance and FVG)
• Target 1: $36.10
• Target 2: $35.50
• Target 3: $35.00 (if macro weakness continues)
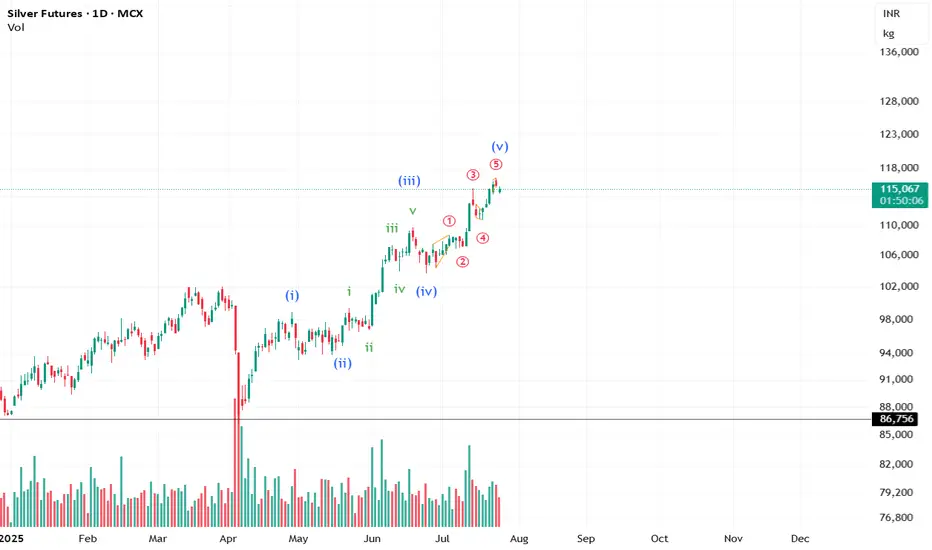
#Silver up for another short sell move?Silver is currently completing the 4th wave and may witness a down move in the short term. Keeping my eyes glued. :)
**This is an educational market outlook, not investment advice. Please consult a SEBI-registered advisor before taking any investment decisions.**
Silver holding sell trade from yesterday night 1400 points Silver holding sell trade from yesterday night 1400 plus points profit running, downside target mentioned on chart continuesly recommended sell after break 115700

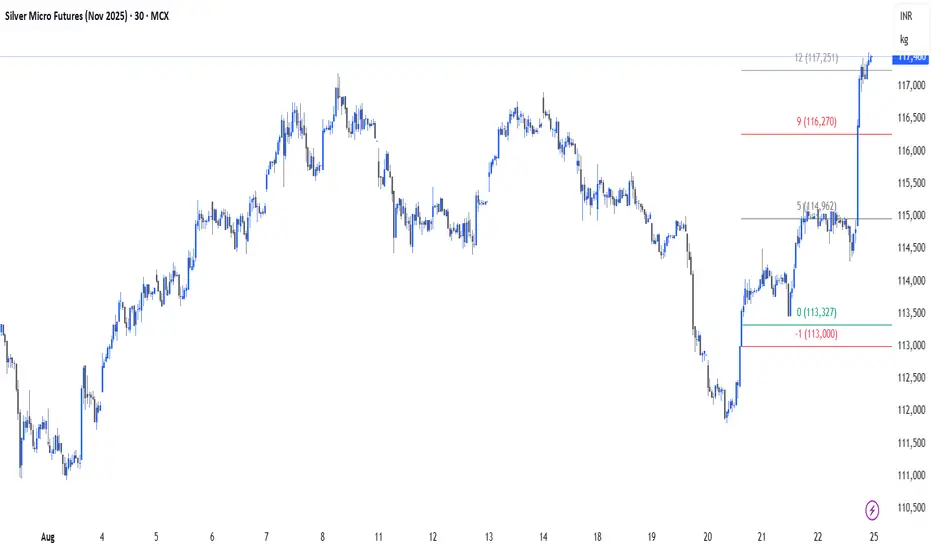
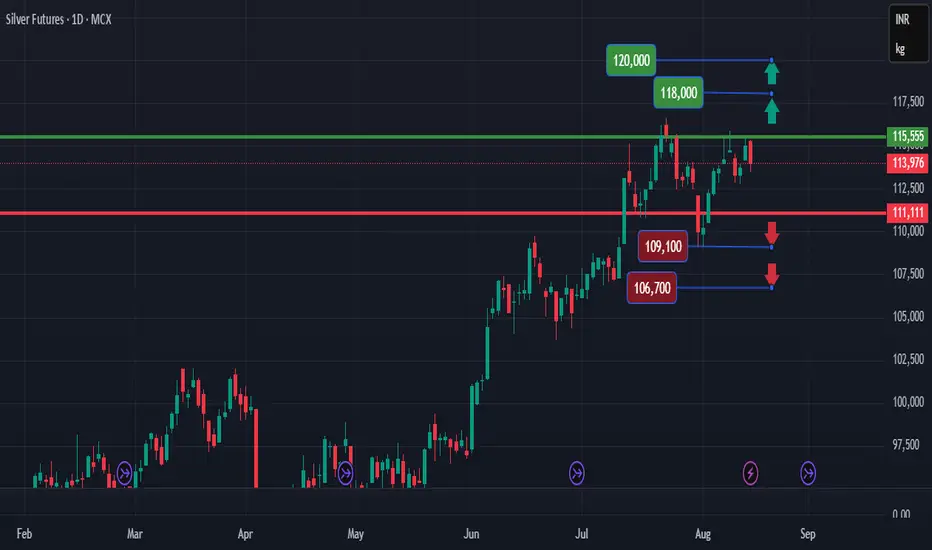
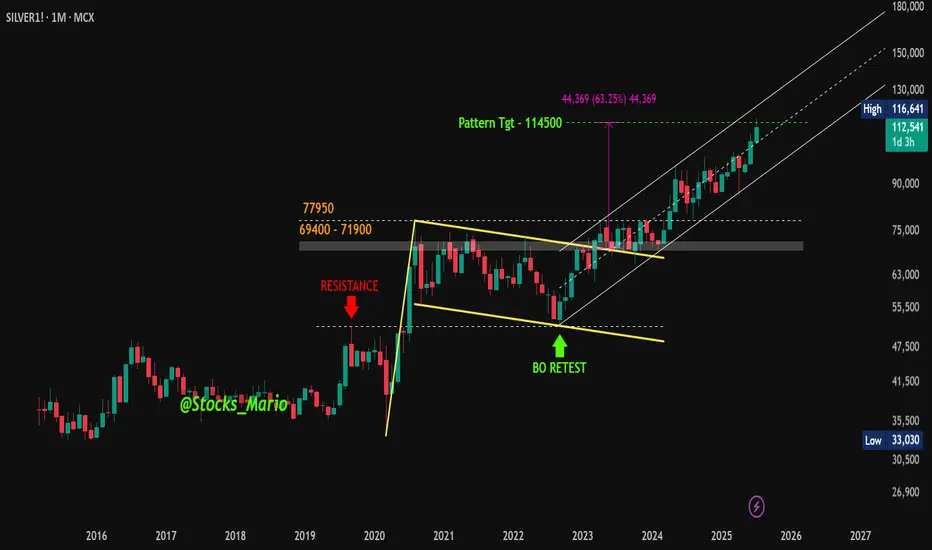
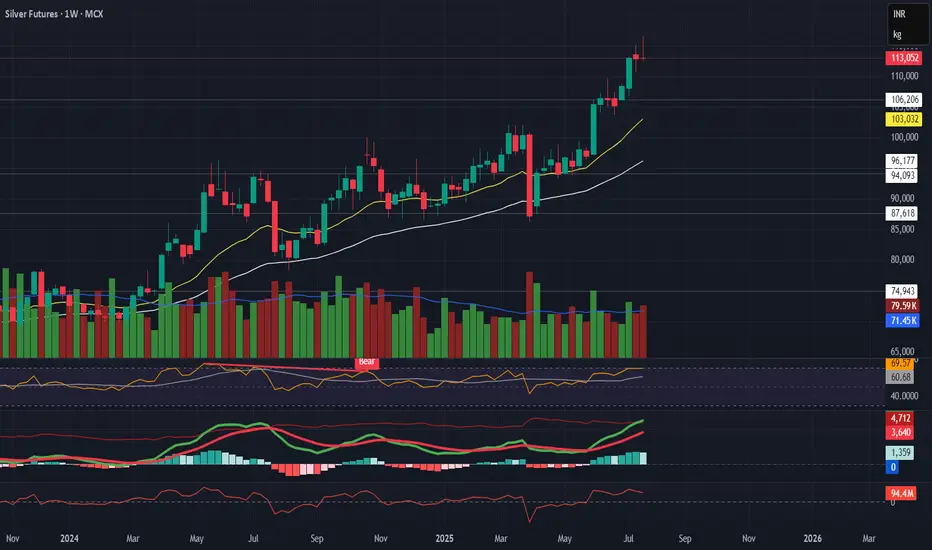
MCX Silver Powers Through Pattern Targets – Momentum Continues#Update | #MCXSilver
On Dec 27, 2022 , we identified a bullish flag pattern when Silver was trading around 69,845 . A follow-up update was shared on Apr 4, 2025 , with prices near 87,878 .
Since then, MCX Silver moved up and touched a high of 1,16,641 on Jul 14, 2025 , meeting the projected zone of the earlier chart pattern — a move of 67% from the initial post and +32% from the April update.
At present, Silver is trading within an ascending channel on the long-term charts — a structure often associated with a sustained trend.
Stay tuned — this could just be the beginning!
⚠️ This is a technical observation shared for educational purposes only. Not a buy/sell recommendation. Please consult your financial advisor before making any trading decisions.
#Silver | #MCX | #TechnicalAnalysis | #PriceAction | #Commodities | #TrendAnalysis | #ChartPatterns
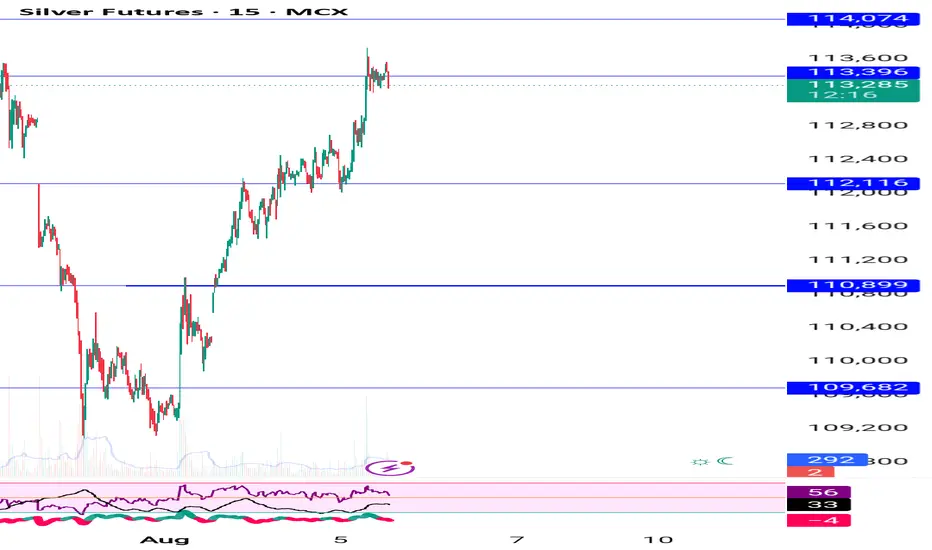
Silver last week we booked 4500 points on buy now holding sellSilver last week we get 4500 points profit now holding sell trade downside target mention on chart until 113900 not break downside move will continue

Silver Futures – Bearish Reversal in Progress
Silver Futures – Bearish Reversal in Progress
Description:
Silver is showing a strong technical reversal across timeframes. Short-term correction looks likely.
Technical Setup:
Daily:
Evening Star + Bearish Engulfing
Flattening EMAs
Volume and MACD confirming momentum slowdown
Weekly:
Gravestone + Southern Doji near resistance
RSI close to overbought
EMA slope still up, but weakening signs visible
Macro View:
No major bearish macro trigger — Fed dovish, USD stable, inflation low.
→ This is likely a technical pullback, not a fundamental reversal.
Trade Plan:
🔻 Breakdown Level: ₹114,560
🎯 Targets: ₹107K → ₹101K → ₹93K
🛑 SL: ₹116,000+
Caution: No position without breakdown confirmation.
Is the move over for Silver? #CommodityIt looks like the impulse for Silver is about to end. However, we still need the price action to confirm the view.
**This analysis is based on the Elliott Wave Principle.
This analysis is for educational purposes only and not investment advice.
Please consult your SEBI-registered advisor before making any investment decisions. Markets are subject to risk.**
$MCX:SILVERM1! – 13-Year Highs | Holding LongMCX:SILVERM1! just broke above a 13-year resistance, marking a major technical milestone.
We are holding our long position as price shows strong momentum and trend continuation potential.
📊 Highlights:
All-time breakout after more than a decade
Strong trend structure on higher timeframes
Momentum and volume backing the move
✅ Position: Long
📈 Bias: Bullish
⏳ View: Swing / Positional
Letting winners run while the trend is strong.
Watching for follow-through and possible re-entry setups on pullbacks.
Silver buy in dip near support given on chart will make new highHow My Harmonic pattern projection Indicator work is explained below :
Recent High or Low :
D-0% is our recent low or high
Profit booking zone: D13% -D15% is
range if break them profit booking start on uptrend or downtrend but only profit booking, trend not changed
SL reversal zone : SL 23% and SL 25% is reversal zone if break then trend reverse and we can take reverse trade
Target : T1, T2, T3, T4 and .
Are our Target zone
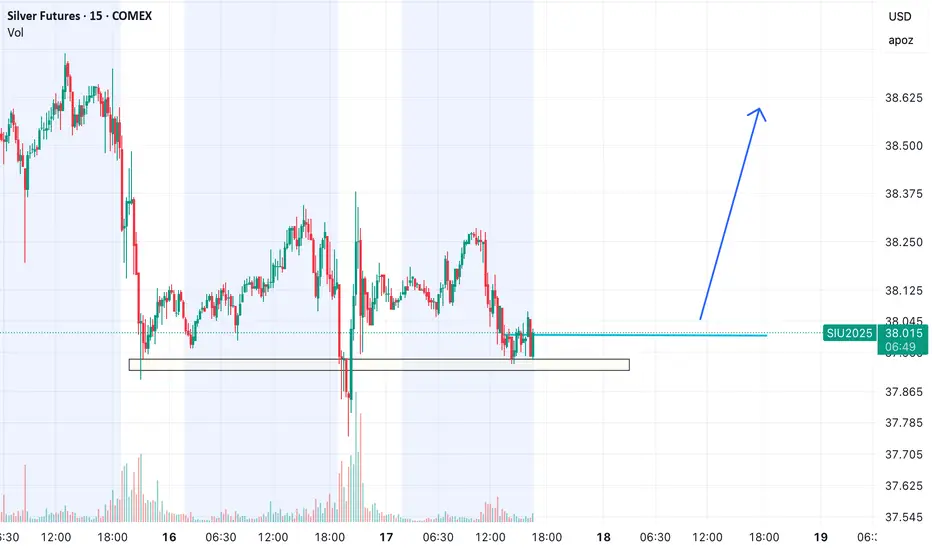
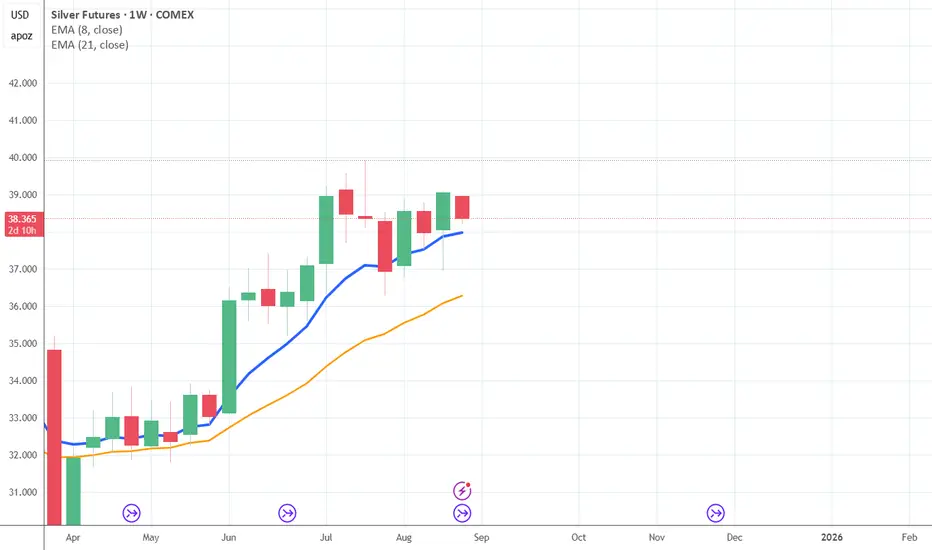
Silver Lining in a Foggy Macro — A Low-Risk Entry with High RS
CMP: $38.015
Buy Range: $37.95–38.05 (current zone)
Target 1: $38.60
Target 2: $39.10
Stop Loss: $37.65
Time Horizon: 2–4 sessions
Rationale:
1. Macro Tailwinds
• US Inflation Cooling: The recent softening in CPI and PPI prints has revived expectations of a Fed rate cut by September, weakening the dollar slightly and supporting precious metals.
• Real Yields Topping Out: With 10Y real yields unable to break out higher, silver (which correlates inversely) gets a tailwind.
• Global Risk Aversion: Amid rising geopolitical caution (e.g., US elections, China demand concerns), silver’s dual industrial + safe haven appeal makes it a better pick than gold on risk-reward.
2. Technical Setup
• The $37.85–37.95 zone has acted as a strong base, seeing high-volume defenses over 3 sessions.
• The false breakdown on July 16 was immediately absorbed, showing signs of strong demand.
• The structure shows a potential reversal with higher lows, and if price sustains above $38.05, we may get a quick leg toward $38.60–39.10.
• RSI (not visible here, but from broader chart) is curling up from neutral levels — a sign of early momentum building.
“You don’t buy silver just because it’s shiny; you buy it when it’s unloved and basing at a zone where risk is controlled, and macros are bending in your favor. This is one of those trades — not a moonshot, but a professional nibble.”