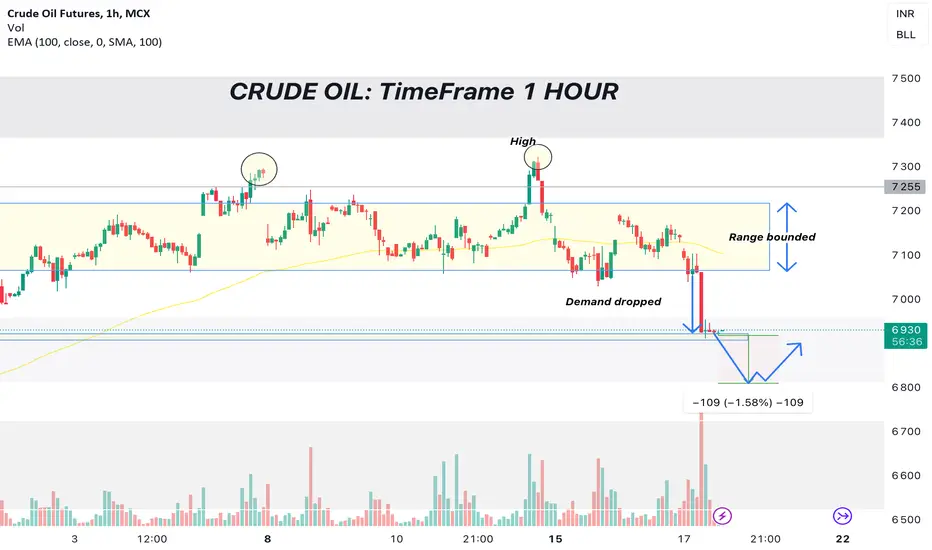
CRUDE OIL ANALYSIS 17 APR 2024 SHORTCrude oil analysis 17 Apr 24 short
currently crude oil is trading around 7041
all the levels are given in chart i guess i made it clear over there
R/R - 1:2
exacting crude oil to fall by 2-4.5%
Major resistance area is 7318
minor resistance area is around 7194
Major support area is around 6672
minor support area is around 6853
This analysis is for educational purpose only.
any queries wrt to the analysis feel free to ask
USCRUDEOILF2026 trade ideas

Crude Oil Weekly Technical Chart Analysis 22-26 April
📊 Crude Oil MCX 20 May Future Technical Chart Weekly Analysis
🎯 Range Point: 6981
🎯 Weekly Range: 374
📉 Buy Above: 7049
📉 Average At: 7005
🎯 Buy Targets 1: 7212
🎯 Buy Targets 2: 7355
🛑 Buyer Stoploss: 6924
📉 Sale Below: 6961
🎯 Sale Targets 1: 6750
🎯 Sale Targets 2: 6607
🛑 Seller Stoploss: 7086
Please follow/boost or respond what do you think of this trade. You actions fuel me to work ever harder to provide directional trade and save the traders from any shock from the market.
#Crude #CrudeOil #CrudeOption #CrudeFuture #MCX #MCXLevels #OilFuture
Crude Oil MCX 20 May Future Weekly Technical Analysis
Traders eyeing the Crude Oil MCX 20 May Future should prepare for a dynamic week ahead, marked by clear levels and a defined weekly range.
Key Levels:
Range Point: 6981
Weekly Range: 374 points
Buy Scenario:
Traders seeking long positions should monitor the market closely for a breakout above 7049. An entry at 7005 could provide a solid average position. Ambitious targets for buyers are set at 7212 and 7355, indicating potential bullish momentum. To mitigate downside risk, a prudent stop-loss is advised at 6924.
Sell Scenario:
Alternatively, a drop below 6961 may present opportunities for short positions. Sellers targeting 6750 and 6607 should remain vigilant. Implementing effective risk management strategies is essential, with a stop-loss set at 7086 to limit potential losses.
As traders navigate the Crude Oil MCX 20 May Future, a comprehensive understanding of these levels and disciplined risk management practices will be critical for capitalizing on potential opportunities while managing risks effectively.

Crude Oil Prices Surge Amid Geopolitical Tensions and Economic CIntroduction:
The global crude oil market experienced significant turbulence as prices surged by more than 3%, surpassing the $85 per barrel mark. This escalation followed reports of large explosions in Iran, Iraq, and Syria, presumed to be the result of Israeli attacks. Concurrently, various geopolitical factors, coupled with economic uncertainties, contributed to the volatility witnessed in the market.
Geopolitical Developments:
According to reports, Israel launched missiles targeting locations suspected to be linked to Iran's nuclear program. While the primary strike was believed to have targeted an Iranian nuclear facility, the extent of the attacks on Iraq and Syria remains unconfirmed. These events intensified concerns over regional stability, prompting a swift reaction in oil prices.
Impact of Sanctions:
The reimposition of US sanctions on Venezuelan oil further exacerbated the upward pressure on oil prices. Additionally, the prospect of new European Union sanctions on Iran added to the market's apprehension, reflecting the delicate balance of geopolitical forces influencing global oil dynamics.
Demand-Side Concerns:
Despite the geopolitical tensions driving prices higher, concerns about weakening demand persisted. March economic data from China, a key oil importer, revealed signs of sluggishness, compounding market anxieties. Moreover, speculation surrounding the US Federal Reserve's stance on interest rate cuts, with projections of potential postponements until the following year, contributed to the apprehensive sentiment among investors.
Key Economic Indicators:
In the upcoming period, market participants will closely monitor key economic data releases, including the German Producer Price Index (PPI) month-on-month from the Euro Zone and Retail Sales month-on-month from the GBP Zone. These indicators will provide crucial insights into the health of respective economies and their potential impact on global oil demand.
Technical Analysis:
Technical indicators suggest that crude oil prices may find support at $83.70 per barrel, with resistance anticipated at $86.60. Similarly, Crude oil MCX prices are expected to encounter support around 6800, with resistance levels at 7080. These levels serve as important reference points for traders navigating the current market environment.
Conclusion:
The recent surge in crude oil prices underscores the intricate interplay between geopolitical tensions, supply-side disruptions, and demand-side considerations. As global economic uncertainties persist, market participants remain vigilant, closely monitoring developments that could sway oil prices in either direction. Amidst this backdrop, robust analysis and informed decision-making are imperative for stakeholders navigating the complexities of the oil market.


possible shortwhole week spent in consolidation, now if it trade below 85 support, then a 2% drop could be there...

CrudeOil Alert! MCX 💥 Weekly 18 - 23Apr
Timeframe: 4-hour ⏰
🔍 Observing an intriguing D cup pattern emerging in crude oil. The alluring support beckons at 6726. Exciting times ahead! 💃🕺
Selling point at 6860
Target would be 6700 - 6680 (+150 -- +170 points)

📆 #Crudeoil Update MCX || April 18Update :-
🔸Support at 6811, with a potential move towards the 7000 level for settlement. Long only above 6950-6960.
🔸Crude oil prices declined over 3% due to robust US oil supply & growing demand concerns.
🔸US crude inventories increased by 2.735 million barrels.
📆 #Crudeoil Update - MCX | April 16
🔸Technical Analysis:
Current Situation: Crude oil is approaching the critical support level at 7100.
🔸Scenarios:
If the support at 7100 is breached, further downward movement is anticipated, with potential for lower levels.
However, there's a possibility that crude oil could find support at this level and reverse its direction, moving upwards.
🔸Market News:
Impact on Oil Prices: Oil prices surged amid concerns over escalating tensions between Israel and Iran.

#Crudeoil Update || APR 11 MCXHere are the key levels to watch:
Bullish above 7190: If crude oil prices rise above the 7190 level, it indicates bullish momentum in the market.
Bearish below 7100: Conversely, if prices fall below 7100, it suggests bearish sentiment taking hold.
Traders and investors are closely monitoring these levels to gauge market direction and make informed trading decisions.

📆 #Crudeoil Update MCX || April 15Technical Analysis:
Price failed twice to breach 7322, forming a double-top pattern.
Key neckline at 7057 suggests potential downtrend to 7000, unless breaking above 7330.
Support at 7100 (Bearish)
Resistance at 7170 (Bullish above)
Market Insights:
🔸 Potential dip in oil prices below $90/barrel post Iran's attack on Israel, considering pre-existing rally and flagged risks.
🔸 Calibrated nature of attack may pause Iran-Israel confrontation.
WTI crude futures down 0.3% at $85.37; Brent crude down 0.2% at $90.27.
🔸 Note: Market stability expected after 3 pm; await confirmation for trading at specified levels.

Crude Oil MCX Future Weekly Analysis for 15-19 April, 2024Crude Oil MCX 20 Apr Future Technical Chart Weekly Analysis!
📊 Range Point: 7187
📈 Weekly Range: 265
🎯 Buy Above: 7221
🎯 Average At: 7190
🎯 Buy Target 1: 7351
🎯 Buy Target 2: 7452
🛑 Buyer Stoploss: 7132
📉 Sale Below: 7158
🎯 Sale Target 1: 7023
🎯 Sale Target 2: 6922
🛑 Seller Stoploss: 7247
Don't forget to reciprocate your love by boosting, following and responding, your actions fuel my efforts to do even better for you!
#Crude #CrudeOil #CrudeOption #CrudeFuture #MCX #MCXLevels #OilFuture

CRUDEOIL Future Analysis Intraday Support level at 7180 and resistance level at 7296.
1st Support level : 7181
2nd support level : 7082

Crude Oil Prices Surge Amid Middle East Tensions and Demand ForeTechnical analysis suggests that crude oil prices may find support at $84.40 and face resistance at $87.30, with similar levels identified for Crude oil MCX prices. A recommended trading strategy involves selling on any uptick around $86.20, with a target price of $85 and a stop-loss order placed above $87.30. This strategy aims to capitalize on short-term price movements amidst the prevailing geopolitical uncertainties and demand outlook.
In conclusion, the current dynamics in the crude oil market reflect a delicate balance between geopolitical tensions, supply dynamics, and demand forecasts. Market participants are advised to remain vigilant and adapt their strategies accordingly in response to evolving developments.

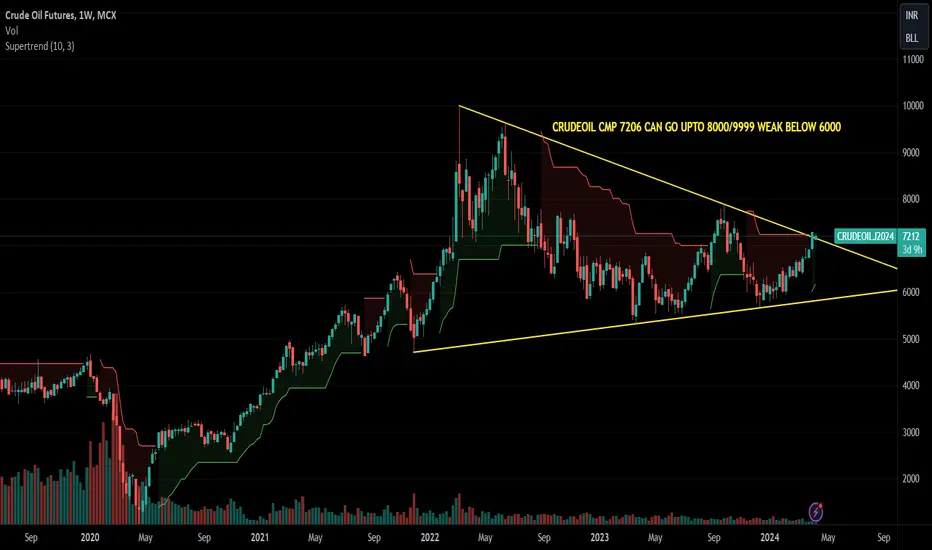
Crude Oil : Strong Uptrendcrude oil is consolidating and heading to 7450.
If it closes above 7825 for more than 3 days it will head towards 10000.
Put Stoploss on closing basis.
(In Trading Time it may go above/below stoploss But closing price is most important).
These are levels are generated on the basis on Fibonacci Series
Disclaimer:- Please always do your own analysis or consult with your financial advisor before taking any kind of trades. Please understand Risk in trading before taking any trade with your financial consult. I am only sharing my knowledge it may be right or sometimes wrong so I am not liable for any loss.
Dear traders, If you like my work then do not forget to hit like and follow me, and guy's let me know what do you think about this idea in comment box, i would be love to reply all of you guy's.
Thank you.

CRUDEOIL - Technicals and world affairs aligning for a move Broken out of the trendline. Weekly supertrend signalling a buy as well , EMAs compressing around 63-6400.
Iran threatiening to close Strait of Hormuz
War escalations all around the world (middle east)!
34% would just be the beginning.
Will be adding on dips upto 6760 MCX:CRUDEOIL1!
SL weekly close below 6263

Crudeoil Update | MCX | Apr 10thToday, there were no trades in crude oil. I anticipated an upward movement, but it reversed instead.
According to the chart, if crude remains below 7100, it may be considered bearish.
A bullish signal is only confirmed if it rises above 7150.

Crude Oil: Bullish Momentum ContinuesCrude Oil (MCX)
Current Market Price: Approximately 7005
We have observed a significant bullish trend in crude oil over the past few weeks. Unfortunately, due to certain reasons, we were unable to provide updates during this period. Nevertheless, it is never too late to analyze the market.
We remain optimistic about crude oil's prospects today. Crude oil has recently experienced a notable breakout, leading us to believe that it may reach levels of 7260 and 7590 in the coming days.
For the time being, we will set our stop-loss at 6670, and upon reaching the levels of 6900-6910, we may consider adding positions.
Stay tuned for further updates as the market progresses.

Crude Analysis and projection for 05/04/2024 eveningCrude has made the double top and it has rejected from that level. Now if it break 7202 then there is possibility of price trying to fill the gap below. I have consider the candle stick pattern and trend analysis.

crude oil intraday levels for tradingMCX:CRUDEOIL1! watch crude below 7155 for short trade till 7102 zone

CRUDE OIL 20 APR WEEKLY MCX FUT/OPTIONS LEVELS 📊 CRUDE OIL 20 APR WEEKLY FUT LEVELS
🎯 Weekly Range: 404.00
📉 Buy at: 7141.67
🎯 Buy Target 1: 7533.67
🎯 Buy Target 2: 7688.00
📉 Average Position: 7094.00
🛑 Buyer Stoploss: 7007.00
📉 Sell at: 7046.33
🎯 Sell Target 1: 7034.33
🎯 Sell Target 2: 6880.00
🛑 Seller Stoploss: 7181.00

crdue mcx or spot update education purposecrude gap dwn open now looking short covring here yes if gap fill thna mkt abv 7160 looks 7250-7400++++ where support 7111 only break blw thna more other wise if hold abv support mkt up side only buy on dips with supporting sl

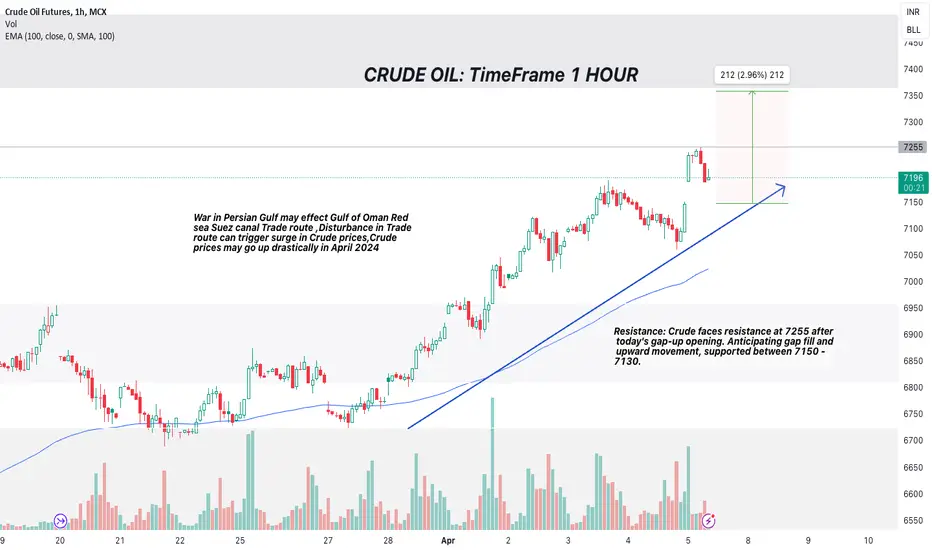
#CrudeOil update | MCX | 5- 7th April Timeframe: 1 Hour
Crude oil opened with a gap-up today, indicating bullish momentum.
The price faces resistance at the 7255 level, a significant barrier observed in historical price action.
Anticipation of a gap fill suggests a potential retracement to fill the void created by the gap-up opening.
Support is identified between the 7150-7130 zone, where buying interest is expected to emerge.
Trend Analysis:
In the short term, crude oil is exhibiting bullish momentum, supported by the gap-up opening.
However, the resistance at 7255 suggests a potential reversal or consolidation.
Technical Indicators:
Moving Averages: The 50-day and 200-day moving averages may act as dynamic support levels, reinforcing the overall bullish bias if the price remains above them.
Relative Strength Index (RSI): Currently, the RSI indicates overbought conditions, suggesting a potential pullback or consolidation in the near term.
Trading Strategy:
Long Opportunity: Traders may consider entering long positions if the price successfully breaks above the 7255 resistance level, targeting higher price levels.
Short Opportunity: Alternatively, a short position could be initiated if the price fails to sustain above the resistance level and breaks below the support zone of 7100.