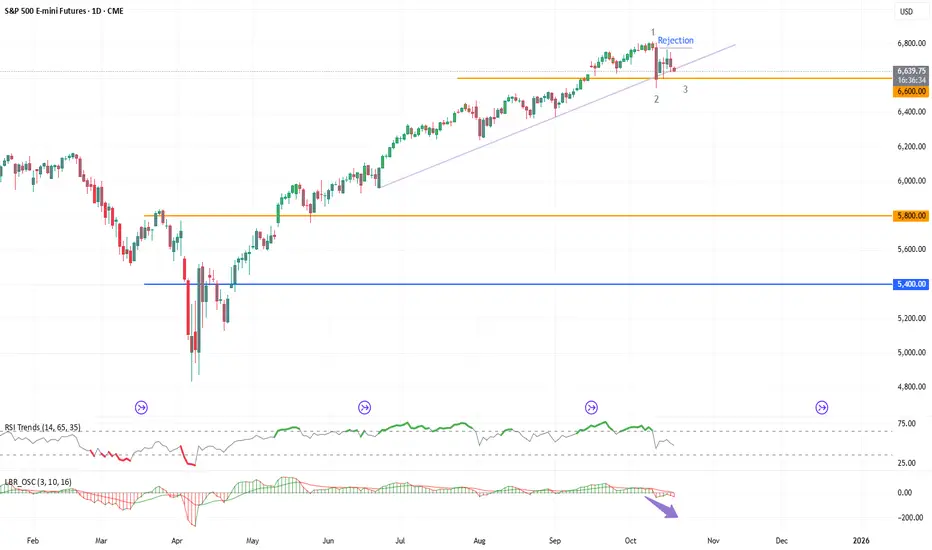
S&P on verge on fall. Change on short term trendS&P after a 3% fall recovered and is consolidating.
We can expect a fall to 6300, as upside level of 6800 is rejected.
Short at 6640. Keep SL of 6800
Expect 6300.
Related futures
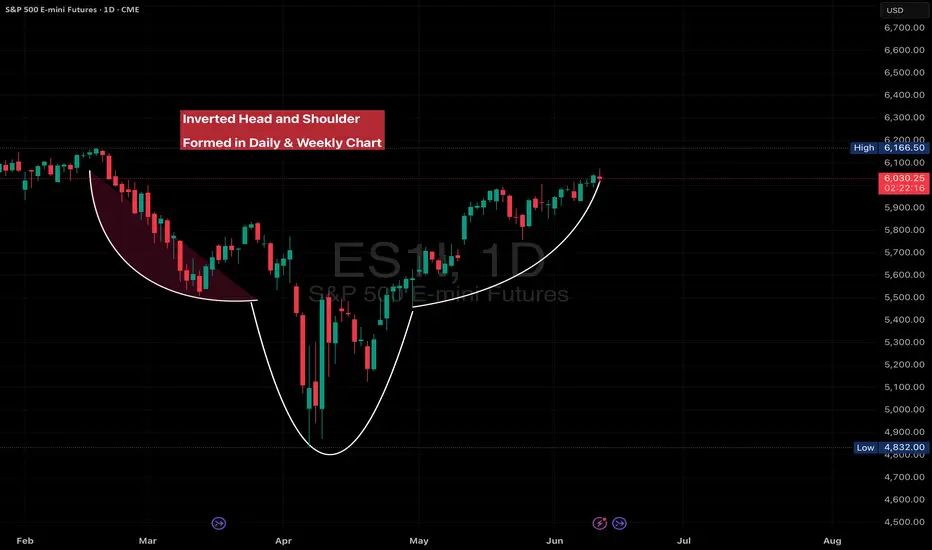
S&P 500 rally is ripe now. Can fall to 6600 first and then 6400S&P rally is ripe for a fall now.
low volume in upside.
+
extended run from liberation day
= is perfect combo for a lower level in S&P 500.
We have seen Rsi and linda Raschke's momentum indication in divergence to the rally in index.
Cummulative all technical indicator like trend line break + div

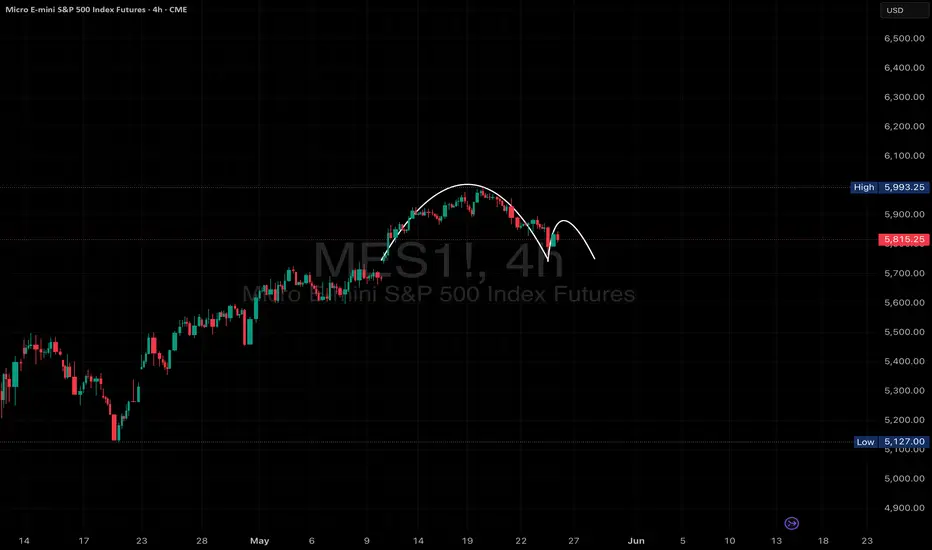
ES1- Reversal After Extended SelloffPrice has experienced a clean, directional drop with consistent Sell signals and EMA slope confirmation.
Current Buy signal has appeared near potential support, offering a short-term reversal watch.
EMAs still show downward pressure, so caution is warranted until breakout confirmation occurs.
🔍 E

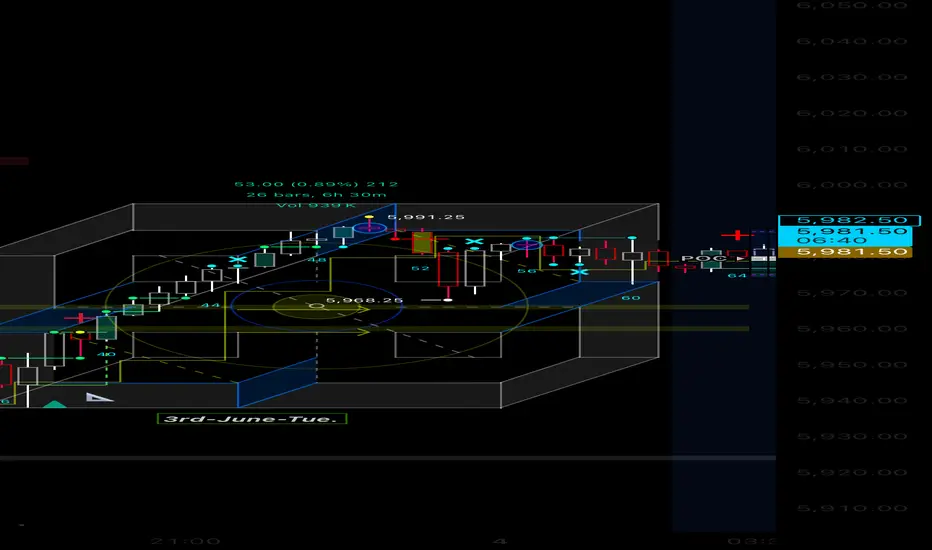
New tool for market structure and forecastingThis tool has Notting to do with trading
However it’s got everything to do with
Advancing your knowledge about price time grid system .
Presented by
Grid-_-Work’s.
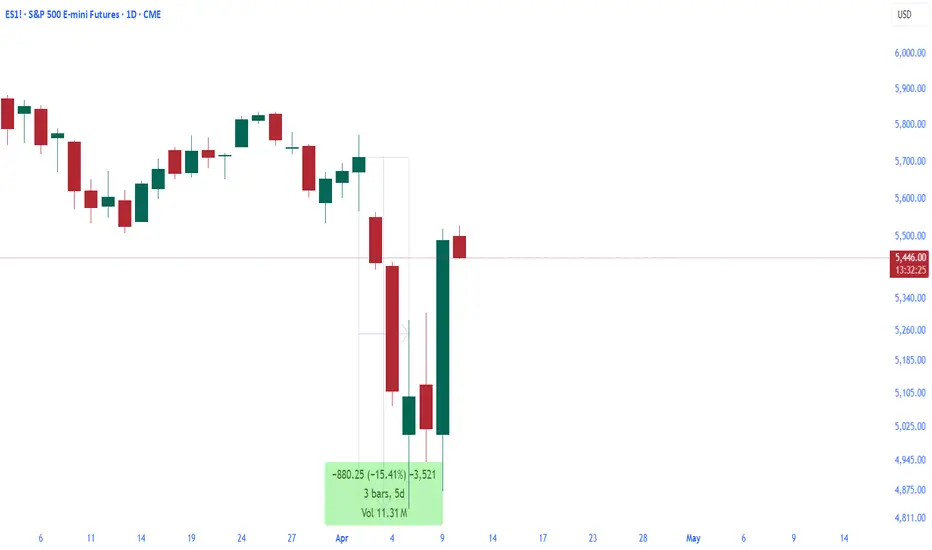
Tariffs and a Wild S&P 500 Ride: A Trader’s View on the ChaosA Horrible 8 Days for Traders:
The last 8 days have been a nightmare for traders and investors. Portfolios crashed hard, battered by uncertainty in the market—all thanks to tariff news from a U.S. leader with a business background and his ultra-wealthy advisor. The S&P 500 took a wild ride, and I’v
ES Monthly chart - how to time the marketBackground:
-I look for trends in everything, PA and indicators
-Monthly charts are very helpful for timing long term investments
-momentum matters; RSI is the only true leading indicator that I have found
What's on this chart:
-macd
-PA
-rsi
-bottoming volume bars
What can be learned from this

ES1 Support and Resistance For the E-mini S&P 500 Futures (ES1!) on a 1-hour timeframe, here are the key support and resistance levels:
Support Levels: 4,100, 4,050, 4,000
Resistance Levels: 4,150, 4,200, 4,250

Are we ready for retracement of S&P E-mini about 25%?
Based on Fibonacci retracement 1st level at 4950
CCI indicator shows divergence at the peak of recent bullish up trend

See all ideas
A representation of what an asset is worth today and what the market thinks it will be worth in the future.
Displays a symbol's price movements over previous years to identify recurring trends.