S&P on verge on fall. Change on short term trendS&P after a 3% fall recovered and is consolidating.
We can expect a fall to 6300, as upside level of 6800 is rejected.
Short at 6640. Keep SL of 6800
Expect 6300.
Related futures
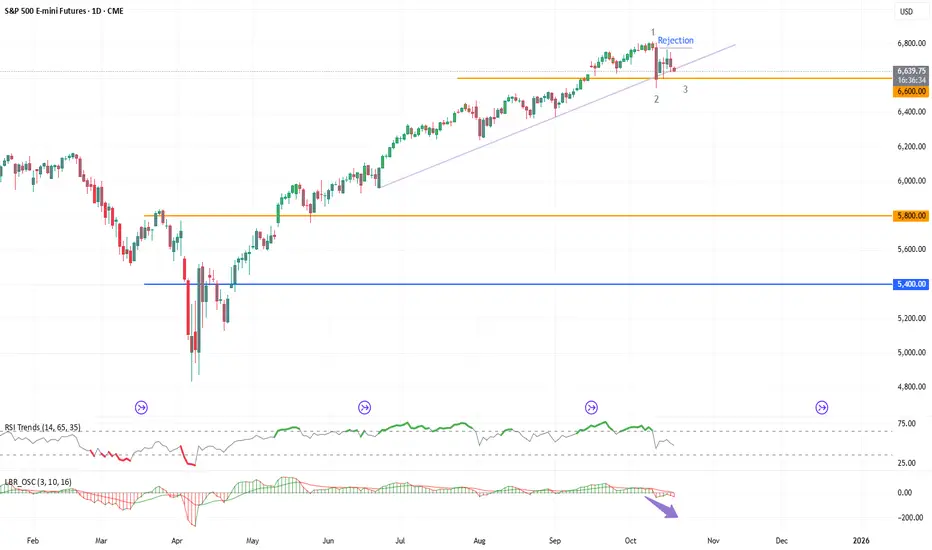
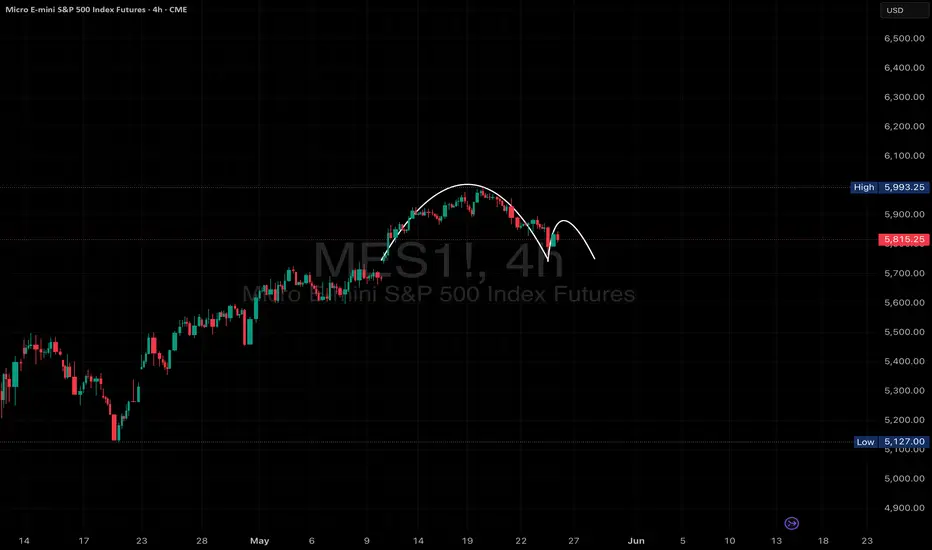
S&P 500 rally is ripe now. Can fall to 6600 first and then 6400S&P rally is ripe for a fall now.
low volume in upside.
+
extended run from liberation day
= is perfect combo for a lower level in S&P 500.
We have seen Rsi and linda Raschke's momentum indication in divergence to the rally in index.
Cummulative all technical indicator like trend line break + div

ES1- Reversal After Extended SelloffPrice has experienced a clean, directional drop with consistent Sell signals and EMA slope confirmation.
Current Buy signal has appeared near potential support, offering a short-term reversal watch.
EMAs still show downward pressure, so caution is warranted until breakout confirmation occurs.
🔍 E

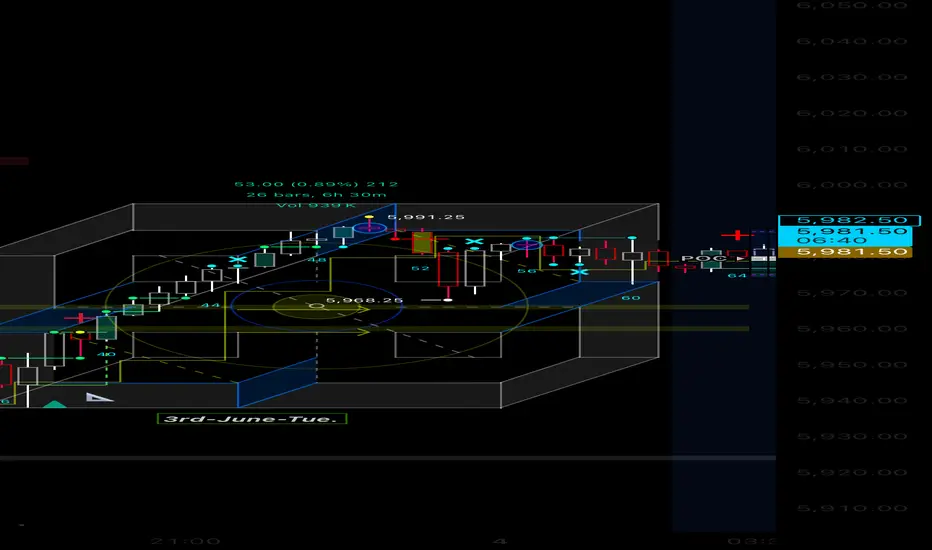
New tool for market structure and forecastingThis tool has Notting to do with trading
However it’s got everything to do with
Advancing your knowledge about price time grid system .
Presented by
Grid-_-Work’s.
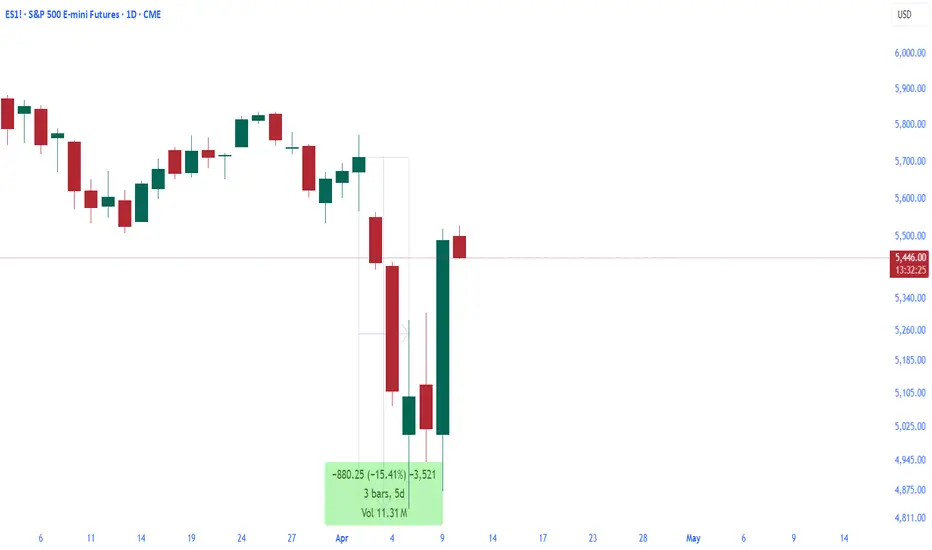
Tariffs and a Wild S&P 500 Ride: A Trader’s View on the ChaosA Horrible 8 Days for Traders:
The last 8 days have been a nightmare for traders and investors. Portfolios crashed hard, battered by uncertainty in the market—all thanks to tariff news from a U.S. leader with a business background and his ultra-wealthy advisor. The S&P 500 took a wild ride, and I’v
ES Monthly chart - how to time the marketBackground:
-I look for trends in everything, PA and indicators
-Monthly charts are very helpful for timing long term investments
-momentum matters; RSI is the only true leading indicator that I have found
What's on this chart:
-macd
-PA
-rsi
-bottoming volume bars
What can be learned from this

ES1 Support and Resistance For the E-mini S&P 500 Futures (ES1!) on a 1-hour timeframe, here are the key support and resistance levels:
Support Levels: 4,100, 4,050, 4,000
Resistance Levels: 4,150, 4,200, 4,250

Are we ready for retracement of S&P E-mini about 25%?
Based on Fibonacci retracement 1st level at 4950
CCI indicator shows divergence at the peak of recent bullish up trend

See all ideas
Summarizing what the indicators are suggesting.
Neutral
SellBuy
Strong sellStrong buy
Strong sellSellNeutralBuyStrong buy
Neutral
SellBuy
Strong sellStrong buy
Strong sellSellNeutralBuyStrong buy
Neutral
SellBuy
Strong sellStrong buy
Strong sellSellNeutralBuyStrong buy
A representation of what an asset is worth today and what the market thinks it will be worth in the future.
Displays a symbol's price movements over previous years to identify recurring trends.
Frequently Asked Questions
The current price of E-mini S&P 500 Futures (Mar 2027) is 7,085.00 USD — it has risen 0.71% in the past 24 hours. Watch E-mini S&P 500 Futures (Mar 2027) price in more detail on the chart.
Track more important stats on the E-mini S&P 500 Futures (Mar 2027) chart.
The nearest expiration date for E-mini S&P 500 Futures (Mar 2027) is Mar 19, 2027.
Traders prefer to sell futures contracts when they've already made money on the investment, but still have plenty of time left before the expiration date. Thus, many consider it a good option to sell E-mini S&P 500 Futures (Mar 2027) before Mar 19, 2027.
Open interest is the number of contracts held by traders in active positions — they're not closed or expired. For E-mini S&P 500 Futures (Mar 2027) this number is 1.00. You can use it to track a prevailing market trend and adjust your own strategy: declining open interest for E-mini S&P 500 Futures (Mar 2027) shows that traders are closing their positions, which means a weakening trend.
Buying or selling futures contracts depends on many factors: season, underlying commodity, your own trading strategy. So mostly it's up to you, but if you look for some certain calculations to take into account, you can study technical analysis for E-mini S&P 500 Futures (Mar 2027). Today its technical rating is buy, but remember that market conditions change all the time, so it's always crucial to do your own research. See more of E-mini S&P 500 Futures (Mar 2027) technicals for a more comprehensive analysis.