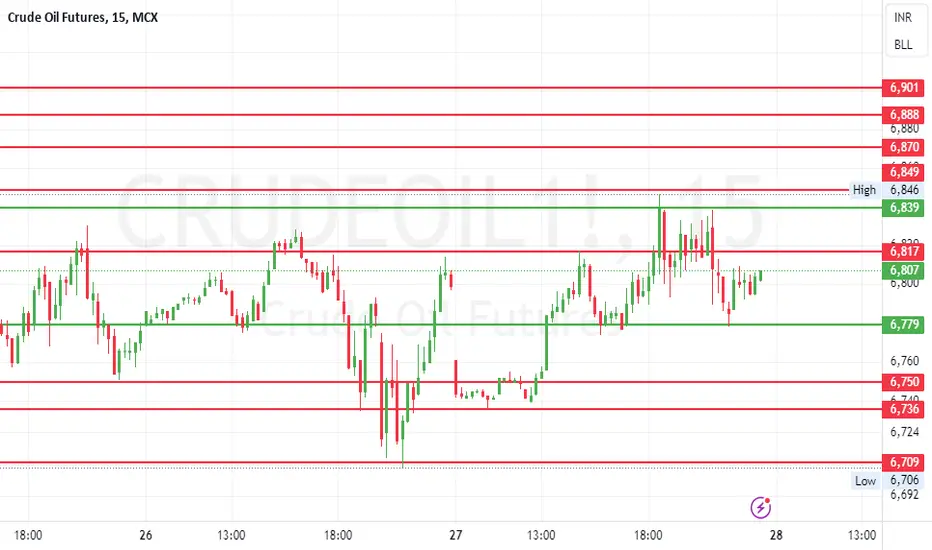
Crude sell given at 6950 , 6923 near low trail sl 6820 hold sellDisclaimer -
This information is only for educational purposes, this is not for any buy or sell recommendations .
On Our Harmonic pattern indicator
based trade setup take trade as explained below :-
ENTRY -
When price breaks 30% retracement Which is D points then take Entry on Buy or Sell Trade
SL -
SL is (-3%) Which is mentioned in Chart . our SL is just above or below of Recent high or Low .
TARGET -
Target 1- (T1 : 61.8 %)
Target 2- (T2 : 88.6 %)
Target 3- (T3 : 127.2 %)
Target 4- (T4 : 161.8 %)
Please note:-
It's working on news based and volitile market very well so exit if SL hit
NOLV2025 trade ideas

CRUDEOIL | MCX | Wedge Watch! (July 16, 2024)
Crude Oil trapped in a falling wedge pattern.
Key Levels:
Downside: Below 6835 (potential drop)
Targets:
1st: 6805
2nd: 6785
3rd: 6760
Upside: Above 6860 (potential breakout)
Both scenarios could see significant swings (around 60 points).
Stop-Loss: Minimum 10 points below entry (adjust based on risk tolerance)
Disclaimer: This information is for educational purposes only and should not be considered financial advice.

Crude Oil MCX Future Intraday Technical Chart Analysis 15 JulyCrude Oil MCX Future Technical Chart Analysis
📊 Range Trigger Point: 6890
📉 Day Range: 108
Buy Above: 6947
Average Position: 6934
Target 1: 6957
Target 2: 6998
Stoploss: 6911
SaleBelow: 6921
Target 1: 6823
Target 2: 6782
Stoploss: 6957
✨ Follow and engage for more insightful updates. Your engagement fuels our dedication to providing top-notch content! 🚀❤️
#CrudeOil #MCX #OilFutures #Commodities #Trading #TechnicalAnalysis #StockMarket #Investment #TradingTips #MarketAnalysis

Crude Oil MCX Future Weekly Technical Chart Analysis 15-19 July📈 Crude Oil MCX Future Technical Chart Analysis
📊 Range Trigger Point: 6890
📉 Weekly Range: 234
📅 Level Type: Weekly
📅 Valid For: 15 to 19 July, 2024
📈 Buy Above: 6899
💼 Average Position: 6871
🎯 Buy Target 1: 7035
🎯 Buy Target 2: 7124
🛑 Stoploss: 6821
📉 Sale Below: 6843
🎯 Sale Target 1: 6745
🎯 Sale Target 2: 6656
🛑 Stoploss: 6921
✨ Follow and engage for more insightful updates. Your engagement fuels our dedication to providing top-notch content! 🚀❤️
#CrudeOil #MCX #Commodities #Trading #TechnicalAnalysis #StockMarket

Crude Oil - 1 hour timeframe (July 12, 2024)Current Situation: Crude Oil is currently trading above the key level of 6950, indicating short-term bullish momentum.
Entry
Long Above 6990 (Breakout Entry)
Target Prices
Target 1: 7020 (Initial Target)
Target 2: Open (Depending on Momentum)
Stop Loss
Stop-Loss: 6940 (Below Key Support)
Analysis:
Crude Oil has been trending upwards in the 1-hour timeframe.
A breakout above 6990 could signal further upside potential.
Target prices are set at 7020 and potentially higher depending on momentum.
Stop-loss is placed at 6940 to mitigate risk in case of a reversal below key support.
Disclaimer: This information is for educational purposes only and should not be considered financial advice.

Crude Oil MCX Fut Technical Chart Analysis 11 July, 2024📈 Crude Oil MCX Future Technical Chart Analysis
📉 Leve Type: Intraday - 11 July, 2024
📊 Range Trigger Point: 6858
📉 Day Range: 145
📈 Buy Above: 6844
💼 Average Position: 6827
🎯 Buy Target 1: 6948
🎯 Buy Target 2: 7003
🛑 Stoploss: 6795
📉 Sale Below: 6809
🎯 Sale Target 1: 6768
🎯 Sale Target 2: 6713
🛑 Stoploss: 6858
✨ Follow, and engage for more insightful updates. Your engagement fuels our dedication to providing top-notch content! 🚀❤️
#CrudeOil #MCX #Commodities #Trading #TechnicalAnalysis #EnergyTrading #StockMarket #Finance

CRUDEOIL Chart suggesting breakout from CUP & Handle PatternCRUDEOIL weekly Chart suggesting breakout from CUP & Handle Pattern.
Possible 30% upside in coming few months.
LTP - 6895
Targets - 9000+
Timeframe - 6/9 Months.

Crude Oil (USO) - 1 hour timeframe (July 10, 2024) 1 hour timeframe || Walling wedge pattern spotted
Breakout Above 6835
Target Prices
Target 1: 6860
Target 2: 6880
Stop Loss
Stop-Loss: 6810
Analysis
Price action is currently above the entry level of 6835, indicating a potential long opportunity.
Target prices are set at 6860 and 6880, offering potential profit areas.
Stop-loss is placed at 6810 to mitigate risk in case of price reversal.
Disclaimer: This information is for educational purposes only and should not be considered financial advice.

CRUDE OIL CHART ANALYSIShello,
Crude oil chart Analysis as per chart, red mark as no trade zone, wait for break out, green line mark as support & resistance.
wait for proper break out.

Crude Oil (USO) | Update | July 09, 2024
Timeframe: 1-hour
Current Situation: Crude Oil is currently trading within the zone it established last week. There's an unfilled gap on the chart, indicating a potential price move to fill it.
Analysis: For an upside move, bulls need to see Crude Oil sustain above the key resistance level of 6940. This would be a positive sign and could lead to a move towards filling the gap.
Key Levels:
Resistance: 6940 (Break above for potential upside)
Support: 6860
Disclaimer: This analysis is for educational purposes only and should not be considered financial advice.

Crude oil sell near 6960-6970 with Sl 7020 Target 6850, 6790 Disclaimer -
This information is only for educational purposes, this is not for any buy or sell recommendations .
On Our Harmonic pattern indicator
based trade setup take trade as explained below :-
ENTRY -
When price breaks 30% retracement Which is D points then take Entry on Buy or Sell Trade
SL -
SL is (-3%) Which is mentioned in Chart . our SL is just above or below of Recent high or Low .
TARGET -
Target 1- (T1 : 61.8 %)
Target 2- (T2 : 88.6 %)
Target 3- (T3 : 127.2 %)
Target 4- (T4 : 161.8 %)
Please note:-
It's working on news based and volitile market very well so exit if SL hit

CrudeoilCrudeoil Seller active at double top on 30m chart - Expected H&S+BAT. Resistance 7037, Supports 6880, 6840, 6800.

Crudeoil analysisClassical double top rejection with Triangle patter. It may lead to Short or long as per the level suggestion. It has also volume profile which suggest more selling pressure.

Crude sold at 6990 , 6915 Target hit sell on rise with 7050 sl Disclaimer -
This information is only for educational purposes, this is not for any buy or sell recommendations .
On Our Harmonic pattern indicator
based trade setup take trade as explained below :-
ENTRY -
When price breaks 30% retracement Which is D points then take Entry on Buy or Sell Trade
SL -
SL is (-3%) Which is mentioned in Chart . our SL is just above or below of Recent high or Low .
TARGET -
Target 1- (T1 : 61.8 %)
Target 2- (T2 : 88.6 %)
Target 3- (T3 : 127.2 %)
Target 4- (T4 : 161.8 %)
Please note:-
It's working on news based and volitile market very well so exit if SL hit

CRUDEOIL CAN buy crudeoil
perfectly retrace of fbi and resverseing from the fbi golden zone
can go long
and place stoploss below the morning star
target - 7100

CRUDEOIL UPDATE | JULY 3 Potential crude oil price movement in a 1-day timeframe
Shooting Star Pattern identified, a bearish reversal candlestick pattern called a "shooting star." This suggests a potential price decline if certain conditions are met.
Key Levels:
Support: 6840 - If the price falls below and sustains under 6840, it could indicate further downward movement.
Resistance: 6950 - A break above 6950 would invalidate the bearish shooting star pattern and suggest a potential price increase.
Predicted Movement:
Downside: If the price closes below 6840, you expect a further 40-50 point decline.
Important Notes:
This analysis is based on a single technical indicator (shooting star) in a 1-day timeframe. It's important to consider other technical indicators and fundamental factors that can influence price movement.
Supporting indicators: Are there other technical indicators that support the bearish signal from the shooting star?

Crude sell holding from 6990 SL 7050 Target mentioned on chart Disclaimer -
This information is only for educational purposes, this is not for any buy or sell recommendations .
On Our Harmonic pattern indicator
based trade setup take trade as explained below :-
ENTRY -
When price breaks 30% retracement Which is D points then take Entry on Buy or Sell Trade
SL -
SL is (-3%) Which is mentioned in Chart . our SL is just above or below of Recent high or Low .
TARGET -
Target 1- (T1 : 61.8 %)
Target 2- (T2 : 88.6 %)
Target 3- (T3 : 127.2 %)
Target 4- (T4 : 161.8 %)
Please note:-
It's working on news based and volitile market very well so exit if SL hit

CRUDEOIL - Confirmed breakout or false dawn?Bulls Charge, But Bears Lurk Below
Support: 6890 (New!)
Resistance: Watch for 7025
Long: Above 6960 (SL below 6890)
Wait: Confirmation of uptrend (Price, Volume, Indicators)
Short (Aggressive): Below 6890 (High Risk)
#OilTrading #CrudeOil #Breakout
Disclaimer: Educational only. Not financial advice.

Consolidation Before Breakout! Big Move ComingCRUDE OIL FUTURES
✅it is consolidating before a breakout from a long-term descending trendline, signaling a potential strong upward move.
✅Strong support around 6500 levels due to the ascending trendline. The breakout above the resistance around 6900 suggests a potential move towards 8000+ levels.
✅indicators are showing bullish momentum, supporting the breakout scenario. Volume increase confirms strong buying interest and bullish sentiment, backing up the breakout scenario.

Crude Oil MCX Future Weekly Technical Chart Analysis 1-5 July📈 Crude Oil MCX Future Technical Chart Analysis
📆 Weekly Levels: 1-5 July
📊 Range Trigger Point: 6805
📉 Weekly Range: 199
📈 Buy Above: 6823
💼 Average Position: 6800
🎯 Buy Target 1: 6928
🎯 Buy Target 2: 7004
🛑 Buyer Stoploss: 6757
💰 Sale Below: 6776
🎯 Sale Target 1: 6682
🎯 Sale Target 2: 6606
🛑 Seller Stoploss: 6842
✨ Boost, follow, and engage for more insightful updates. For detailed analysis and live discussions, check out our community channels. Your engagement fuels our dedication to providing top-notch content! 🚀❤️
#CrudeOil #CrudeOption #CrudeFuture #MCX #MCXLevels #OilFuture

Crude oil sell below 6800 downtrend starting soon Disclaimer -
This information is only for educational purposes, this is not for any buy or sell recommendations .
On Our Harmonic pattern indicator
based trade setup take trade as explained below :-
ENTRY -
When price breaks 30% retracement Which is D points then take Entry on Buy or Sell Trade
SL -
SL is (-3%) Which is mentioned in Chart . our SL is just above or below of Recent high or Low .
TARGET -
Target 1- (T1 : 61.8 %)
Target 2- (T2 : 88.6 %)
Target 3- (T3 : 127.2 %)
Target 4- (T4 : 161.8 %)
Please note:-
It's working on news based and volitile market very well so exit if SL hit

Crude Oil Intraday Technical Chart Analysis for 28 June, 2024
Here’s the script for the Crude Oil MCX Future Technical Chart Analysis:
📈 Crude Oil MCX Future Technical Chart Analysis
📆 Levels for 28 June, 2024:
📊 Range Point: 6804
📉 Day Range: 110
📈 Buy Above: 6804
💼 Average At: 6791
🎯 Buy Target 1: 6872
🎯 Buy Target 2: 6914
🛑 Buyer Stoploss: 6767
💰 Sale Below: 6778
🎯 Sale Target 1: 6736
🎯 Sale Target 2: 6694
🛑 Seller Stoploss: 6815
✨ Boost, follow, and engage for more insightful updates. For detailed analysis and live discussions, check out our community channels. Your engagement fuels our dedication to providing top-notch content! 🚀❤️
#Crude #CrudeOil #CrudeOption #CrudeFuture #MCX #MCXLevels #OilFuture

crude oil Analysis of 28 june 24Hello,
Crude oil analysis, Wait for green line break out, Red line mark as support & Resistance.
This Analysis Based on price action, no any indicator used.
please comment if you like it.