Part 1 Candle Stick Pattern Understanding Option Trading
Option trading is a segment of financial markets that allows investors to buy or sell the right to buy or sell an underlying asset at a predetermined price within a specific time frame. Unlike traditional stock trading, options provide leverage, flexibility, and risk ma
Related commodities

Part 1 Ride The Big Moves1. Introduction to Options
An option is a financial contract that gives the buyer the right, but not the obligation, to buy or sell an underlying asset at a predetermined price, called the strike price, before or on a specified expiration date. Unlike stocks, options do not represent ownership in a

Part 3 Learn Institutional Trading 1. Definition
Options are financial derivatives that give the buyer the right, but not the obligation, to buy or sell an underlying asset at a specified price within a specified time.
2. Types of Options
Call Option – Right to buy the underlying asset.
Put Option – Right to sell the underlying a

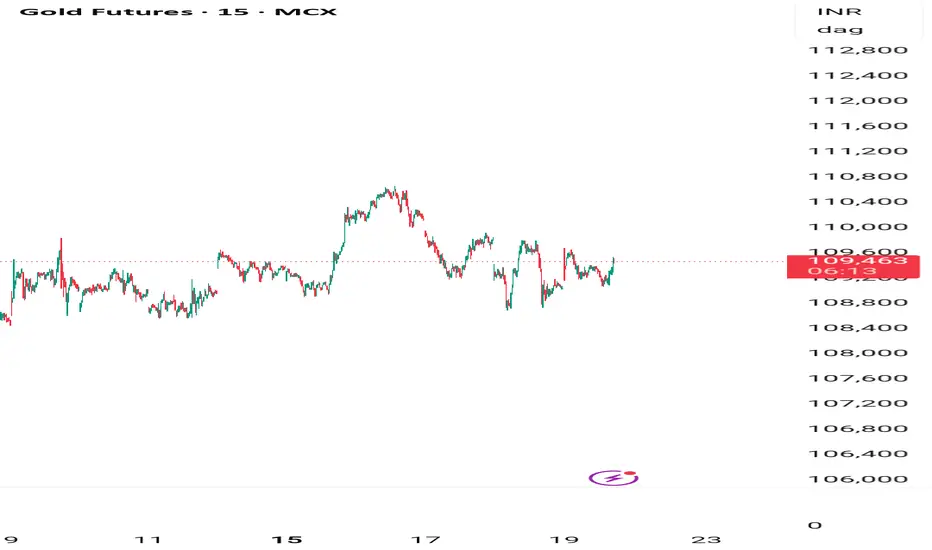
Gold ShortGold appears to be facing selling pressure as it is encountering strong resistance around the 113,200 level.
On the downside, there is a possibility of it moving lower towards the 111,700–111,100 range over the next 1–2 days.

Gold mcx we are holding buy from 113700 ,1600 points profit runnWe are holding buy trade from 113700 from Friday closing , upside target 3855,3910 on comex
How My Harmonic pattern projection Indicator work is explained below :
Recent High or Low :
D-0% is our recent low or high
Profit booking zone ( Early / Risky entry) : D 12.3% -D 16.1 % is
range if

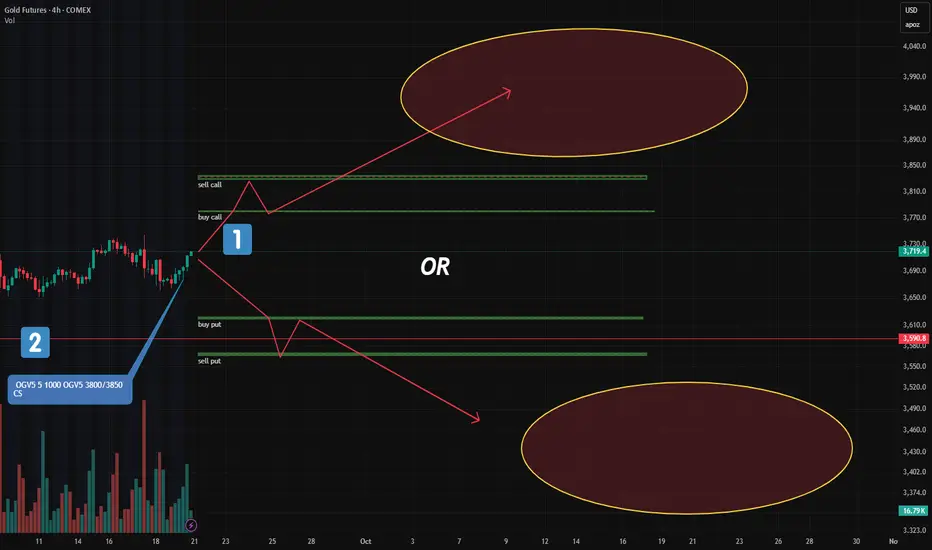
Gold: Major New Option Portfolios Signal Strong Moves AheadFriday’s CME report showed a surge in large option blocks in gold — two of them stand out.
🔹 1. "Long Condor" on December Futures (GCZ24)
This is the most significant structure added:
Targets a move below $3,620 or above $3,780
In other words: a breakout is expected, not consolidation
📌 Key point
Gold – Reversals to TrendsOur system thrives on dual strength — catching reversals at the turn and riding the trend that follows.
MCX:GOLDM1! has been the perfect example.
Precision entries on reversals, disciplined trailing on momentum.
This edge has delivered multiple double-digit “R” trades.
Risk stays small, reward

Gold start sell on rise until 3705 nit break on comex Gold mcx start sell on rise until 3705 not break on gold comex , if gold comex break 3615 then short term downtrend will start .
3560,3515, 3480 downside target
Comex and mcx price may differ because of USDINR price movement
XAUUSD - 19/09/25 - BEP1. Breakout happened during Asian session
2. Expected price to retarce during the Asian session
3. Support confirmed during London session
4. Entered on BPCH
5. Candle flipped to red after my entry
6. Closed 70% of the position during flip
7. Remaining 30% closed at 1:1

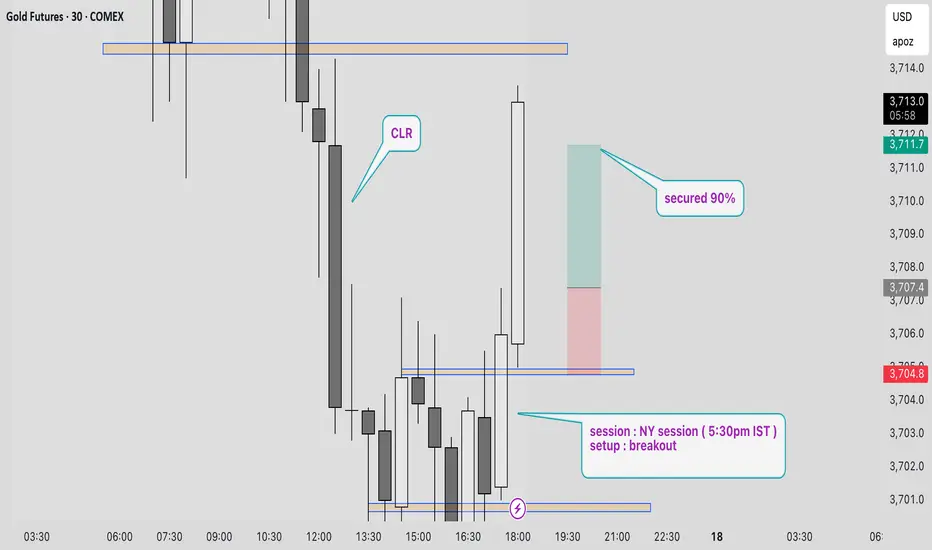
XAUUSD : Sept 17th - TP HIT1. Planned a reversal trade
2. Clean range is present to the left side
3. Breakout happened at NY session above resistance
4. Anticapated volume push during NY session
5.Secured 90% partials at 1:1.5
See all ideas
Displays a symbol's price movements over previous years to identify recurring trends.