Gold mcx AI Tool report showing upmove, holding buy @121600 Parameters Data
Asset Name : Price 🟩 Gold MCX (Feb '26) : 1,24,101
Price Movement 🟩 Upmove will continue to 1,24,500, 1,25,500 if break 1,25,500 then breakout Until 1,22,000 not break if break then 1,21,800, 1,19,250 possible.
Reason 🟩 Technical Reversal & Analyst View: Strong buying interest ne
Contract highlights
Related commodities

Gold Bullish Till 127000Gold have pending liquidity above 127000
after that it may fall towards 110000

GOLD next move 83000 to 85000 as per technical breakout gold can be going up near 83000 and 85000 trade on your own analysis , trade with stoploss , share and like,

Gold mcx hold buy trade for Monday upmove will continue 🔑 Key Highlights
- Price Action: Gold trading at ₹124,090, holding firm above ₹124,000.
- Trend: Active Long Build‑Up confirmed.
- Supports: ₹124,000 / ₹123,600 / ₹123,200.
- Resistances: ₹124,300 / ₹124,700 / ₹125,200.
- Bias: Bullish continuation if above ₹124,000; corrective pullback risk

Part 2 Candle Stick PatternsThe Role of Time in Options
Time value is one of the most important elements.
Unlike stocks, options lose value as they approach expiry. This is known as time decay (theta).
Option BUYERS are hurt by time decay.
Option SELLERS benefit from it.
This is one reason why selling options is a common

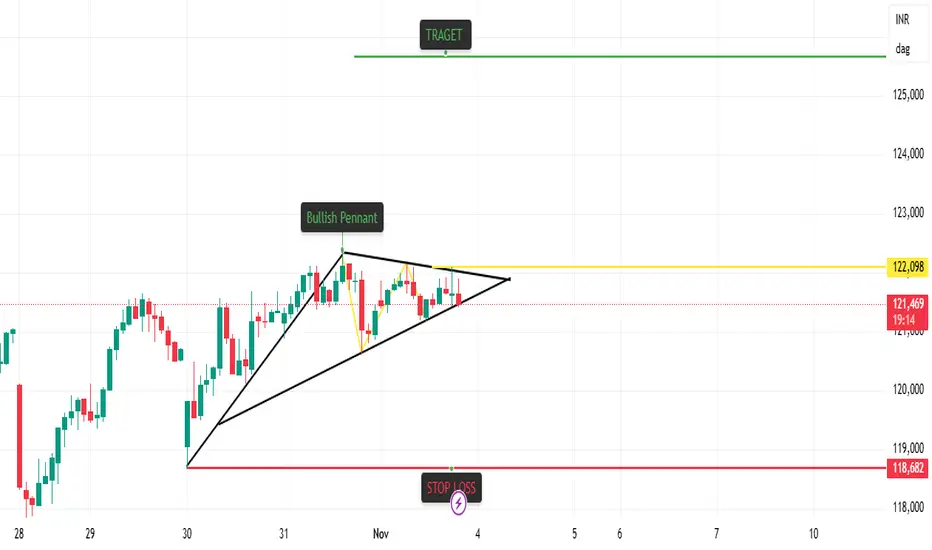
Bullish Pennant Breakout Strategy in GoldBullish Pennant Breakout in Gold MCX
📊 Pattern Overview:
A Bullish Pennant pattern has formed after a strong upward move, signaling a potential continuation of the trend. The pattern is characterized by converging trendlines during consolidation, followed by a breakout to the upside.
📈 Strategy S
Gold mcx AI tool report showing upmove will continue buy on dip🔑 Key Highlights
- Price Action: Gold is holding firm above ₹124,000, showing steady bullish momentum.
- Trend: Long Build‑Up (Price↑ + OI↑), indicating accumulation by institutions.
- Supports: ₹123,700 / ₹123,200 / ₹122,600.
- Resistances: ₹124,500 / ₹125,000 / ₹125,600.
- Bias: Bullish co
Advanced-level Chart PatternWhy Chart Patterns Matter
Chart patterns help traders:
Identify trend reversal zones
Recognize trend continuation signals
Determine breakout points
Set entry, stop-loss, and target levels
Understand market behavior and crowd psychology
Most importantly, chart patterns simplify complex market

GOLD 1ST TGT DONE 83000 NOW READY FOR 85000gold 1st tgt 83000 was done, ready for next tgt 85000
please check my previous post

Gold Futures – Bearish Continuation Developing 🟡⬇ Gap-down open = breakdown continuation
Price below 9 EMA and 21 EMA
Evening Star pattern confirmed
RSI falling → momentum weakening
MACD below signal → bearish pressure
📌 Short Setup:
Below 121,800–121,900
🎯 Targets: 117,500 → 116,000
🛑 Stoploss: 123,650
Weak trend until gold closes back
See all ideas
A representation of what an asset is worth today and what the market thinks it will be worth in the future.
Displays a symbol's price movements over previous years to identify recurring trends.
Frequently Asked Questions
The nearest expiration date for Gold Futures (Oct 2017) is Oct 27, 2017.
Traders prefer to sell futures contracts when they've already made money on the investment, but still have plenty of time left before the expiration date. Thus, many consider it a good option to sell Gold Futures (Oct 2017) before Oct 27, 2017.