Part 8 Trading Master Class With ExpertsHow Option Premium Is Determined
The option premium is influenced by several factors, collectively known as the “Greeks.” These include:
Intrinsic Value – The actual value if exercised immediately (difference between market price and strike price).
Time Value – Extra premium paid for the time left before expiration.
Volatility (Vega) – The higher the market volatility, the higher the option premium.
Delta – Measures how much the option’s price changes with a change in the underlying price.
Theta – Indicates how much the option’s value erodes as time passes (time decay).
Rho – Measures sensitivity to interest rate changes.
For example, an option closer to expiry loses time value faster due to Theta decay.
Trade ideas

Pattern Unfolding Hello Friends I just explained what i am looking the in Gold Futures
I request you to take notes as study materials and analyze before taking live trade
This is education content
Good luck

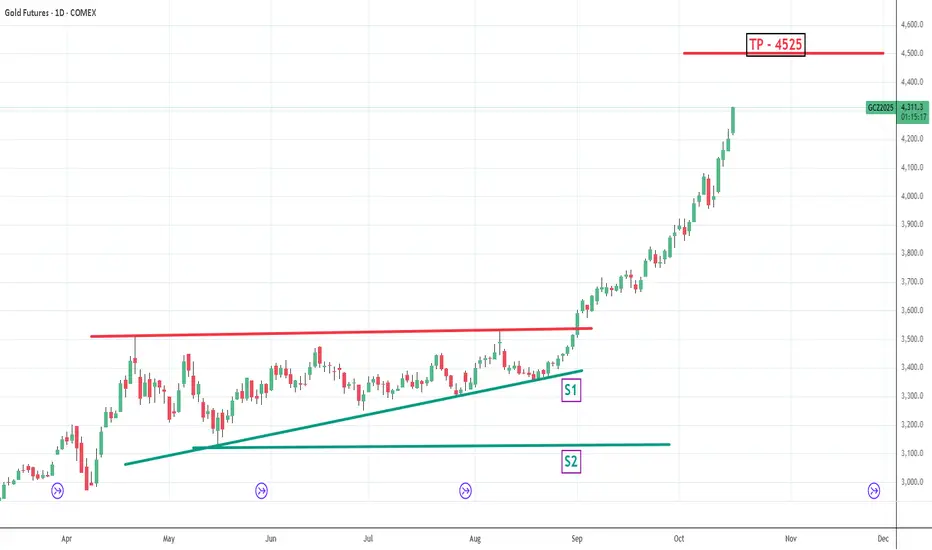
Gold mcx sell on rise until 4050 not break in comexGold sell on rise until 4050 not break on comex
How My Harmonic pattern projection Indicator work is explained below :
Recent High or Low :
D-0% is our recent low or high
Profit booking zone ( Early / Risky entry) : D 13.2% -D 16.1 % is
range if break them profit booking start on uptrend or downtrend but only profit booking, trend not changed
SL reversal zone (Safe entry ) : SL 23.1% and SL 25.5% is reversal zone if break then trend reverse and we can take reverse trade
Target : T1, T2, T3, T4 and .
Are our Target zone
Any Upside or downside level will activate only if break 1st level then 2nd will be active if break 2nd then 3rd will be active.
Total we have 7 important level which are support and resistance area
Until , 16% not break uptrend will continue if break then profit booking will start.
If break 25% then fresh downtrend will start then T1, T2,T3 will activate
1,3,5,10,15,20 minutes are short term levels.
30 minutes 60 minutes , 2 hours,3 hours, ... 1 day and 1 week chart positional and long term levels
Gold looking bullish in 1HGold is taking support near its support zone and clearly making triangle pattern if it sustain and gave a breakout it will be great opportunity
Entry:-121700
Profit -1:- 122823
Profit -2:- 124220
Stoploss:- 120270

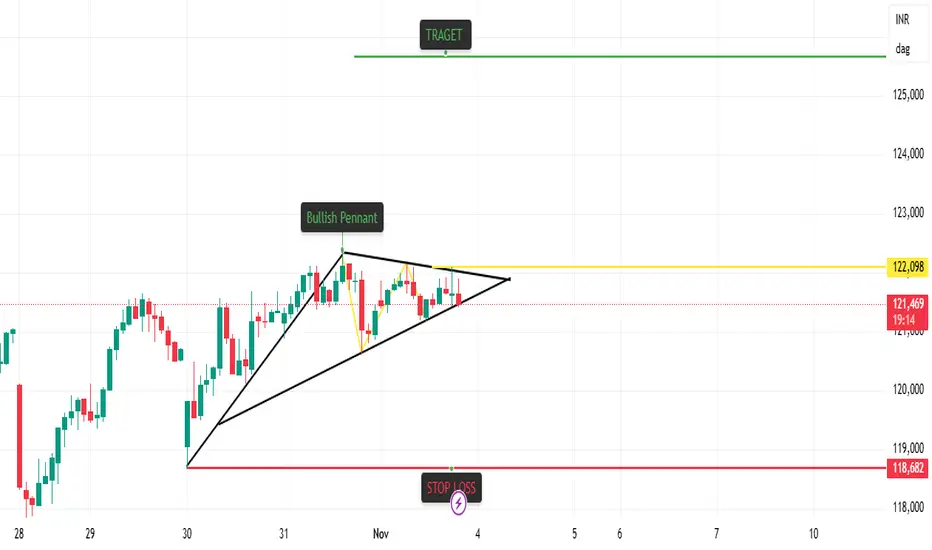
Bullish Pennant Breakout Strategy in GoldBullish Pennant Breakout in Gold MCX
📊 Pattern Overview:
A Bullish Pennant pattern has formed after a strong upward move, signaling a potential continuation of the trend. The pattern is characterized by converging trendlines during consolidation, followed by a breakout to the upside.
📈 Strategy Setup:
Pattern: Bullish Pennant
Breakout Confirmation: Price closing above pennant resistance line
Entry Zone: Near breakout candle close
Target (T1): ₹125,635
Stop Loss (SL): ₹118,682
Risk–Reward Ratio: Approximately 1:2
📊 Indicator Confluence:
T-K Cross: Bullish Cross
Price vs Kijun: Bullish
Cloud Trend: Up
VWMA: Up
RSI: Up
VWAP: Up
SuperTrend: Down (short-term resistance, to be monitored)
🧠 Trading Logic:
The Bullish Pennant indicates a temporary consolidation within an existing uptrend. A confirmed breakout with indicator support (Ichimoku, RSI, VWMA, and VWAP in alignment) strengthens the bullish momentum. Traders may look for sustained candles above the upper trendline with volume confirmation.
⚠️ Disclaimer:
This content is shared for educational purposes only and does not constitute investment or trading advice. Market conditions can change rapidly — always conduct your own analysis and use proper risk management before making any trading decisions.
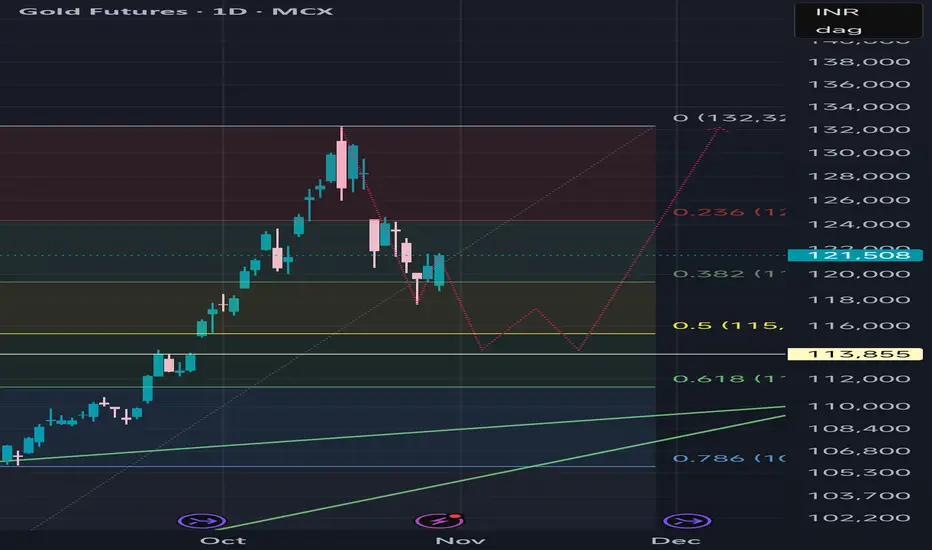
Gold Futures MCX-2H — A Possible Double Zigzag at PlayThe decline from 132,294 unfolded into a clean 5-wave impulse, with Wave 3 extending 1.618 × Wave 1 and Wave 5 measuring nearly equal to Wave 1 — a classic Fibonacci rhythm confirming the completion of Wave W at 117,628.
The ongoing rebound appears corrective, unfolding as an A-B-C structure for Wave X. A move toward the 124–125 k zone could complete Wave C, setting the stage for another 5-3-5 leg lower as Wave Y — potentially mirroring Wave W.
Gold might just be correcting a bit more before it gleams brighter.
Disclaimer: This analysis is for educational purposes only and does not constitute investment advice. Please do your own research (DYOR) before making any trading decisions.

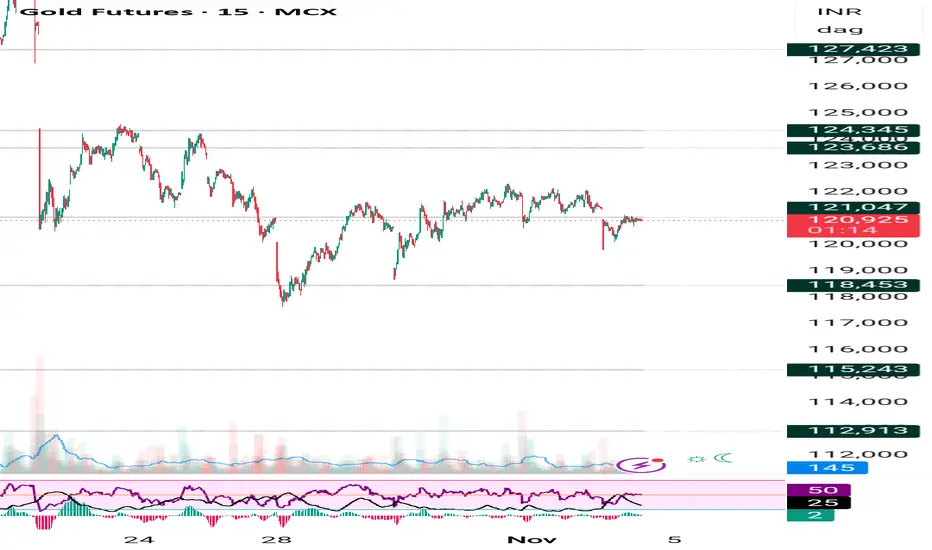
Gold today booked 2000 points on sell and 800 points on buy sideGold mcx Sold yesterday at 120900 today booked at 118880 , 2000 points
Again bought at 120100 and booked 120950
How My Harmonic pattern projection Indicator work is explained below :
Recent High or Low :
D-0% is our recent low or high
Profit booking zone ( Early / Risky entry) : D 13.2% -D 16.1 % is
range if break them profit booking start on uptrend or downtrend but only profit booking, trend not changed
SL reversal zone (Safe entry ) : SL 23.1% and SL 25.5% is reversal zone if break then trend reverse and we can take reverse trade
Target : T1, T2, T3, T4 and .
Are our Target zone
Any Upside or downside level will activate only if break 1st level then 2nd will be active if break 2nd then 3rd will be active.
Total we have 7 important level which are support and resistance area
Until , 16% not break uptrend will continue if break then profit booking will start.
If break 25% then fresh downtrend will start then T1, T2,T3 will activate
1,3,5,10,15,20 minutes are short term levels.
30 minutes 60 minutes , 2 hours,3 hours, ... 1 day and 1 week chart positional and long term levels
Gold mcx sell on rise goven until 4160 not break in comex Gold sell on rise recommended until 4160 not break in comex
How My Harmonic pattern projection Indicator work is explained below :
Recent High or Low :
D-0% is our recent low or high
Profit booking zone ( Early / Risky entry) : D 13.2% -D 16.1 % is
range if break them profit booking start on uptrend or downtrend but only profit booking, trend not changed
SL reversal zone (Safe entry ) : SL 23.1% and SL 25.5% is reversal zone if break then trend reverse and we can take reverse trade
Target : T1, T2, T3, T4 and .
Are our Target zone
Any Upside or downside level will activate only if break 1st level then 2nd will be active if break 2nd then 3rd will be active.
Total we have 7 important level which are support and resistance area
Until , 16% not break uptrend will continue if break then profit booking will start.
If break 25% then fresh downtrend will start then T1, T2,T3 will activate
1,3,5,10,15,20 minutes are short term levels.
30 minutes 60 minutes , 2 hours,3 hours, ... 1 day and 1 week chart positional and long term levels

Gold start buying on dip again if comex break 4060 then 4150-80 Gold mcx start buying on dip if comex break 4060 the. 4150-4180 will come
How My Harmonic pattern projection Indicator work is explained below :
Recent High or Low :
D-0% is our recent low or high
Profit booking zone ( Early / Risky entry) : D 13.2% -D 16.1 % is
range if break them profit booking start on uptrend or downtrend but only profit booking, trend not changed
SL reversal zone (Safe entry ) : SL 23.1% and SL 25.5% is reversal zone if break then trend reverse and we can take reverse trade
Target : T1, T2, T3, T4 and .
Are our Target zone
Any Upside or downside level will activate only if break 1st level then 2nd will be active if break 2nd then 3rd will be active.
Total we have 7 important level which are support and resistance area
Until , 16% not break uptrend will continue if break then profit booking will start.
If break 25% then fresh downtrend will start then T1, T2,T3 will activate
1,3,5,10,15,20 minutes are short term levels.
30 minutes 60 minutes , 2 hours,3 hours, ... 1 day and 1 week chart positional and long term levels

Silver Mcx After the sharp decline from the October highs, silver has been holding its October low and is now consolidating within a tight range. A breakout and close above this consolidation box would indicate that the next leg of the uptrend may resume. The October closing low is acting as key support. If the breakout holds, price can attempt to move toward the rising trendline resistance zone, which is currently around 135,000 in the coming weeks.

Explain: Candle PatternWhat is a Candlestick Pattern?
A candlestick pattern represents the price movement of an asset (like a stock) during a specific time frame. It shows open, high, low, and close prices in one candle.
Structure of a Candle
Each candle has:
Body: The range between open and close price.
Wick (or shadow): The lines above and below the body showing high and low prices.
Color: Green (bullish – price up) or Red (bearish – price down).

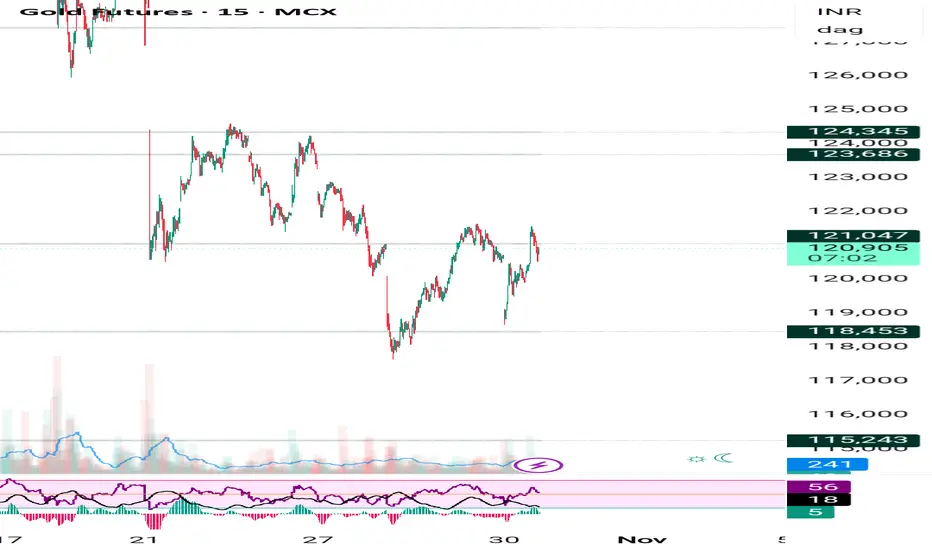
Gold 2150 points booked sell on rise until comex not break 4150Gold mcx sel on rise until 4150 not break on comex , today we booked 2150 points profit
How My Harmonic pattern projection Indicator work is explained below :
Recent High or Low :
D-0% is our recent low or high
Profit booking zone ( Early / Risky entry) : D 13.2% -D 16.1 % is
range if break them profit booking start on uptrend or downtrend but only profit booking, trend not changed
SL reversal zone (Safe entry ) : SL 23.1% and SL 25.5% is reversal zone if break then trend reverse and we can take reverse trade
Target : T1, T2, T3, T4 and .
Are our Target zone
Any Upside or downside level will activate only if break 1st level then 2nd will be active if break 2nd then 3rd will be active.
Total we have 7 important level which are support and resistance area
Until , 16% not break uptrend will continue if break then profit booking will start.
If break 25% then fresh downtrend will start then T1, T2,T3 will activate
1,3,5,10,15,20 minutes are short term levels.
30 minutes 60 minutes , 2 hours,3 hours, ... 1 day and 1 week chart positional and long term levels
Derivative Trading Secrets: The Power of Financial Instruments1. Understanding Derivatives: The Foundation of Trading
At its core, a derivative is a financial instrument whose value depends on the price of an underlying asset. This underlying asset could be a stock, commodity, currency, interest rate, or even another derivative. Derivatives allow traders to speculate on price movements, hedge existing positions, and optimize portfolios.
The most common types of derivatives include:
Futures Contracts: Agreements to buy or sell an asset at a predetermined price at a specific future date. Futures are standardized and traded on exchanges.
Options Contracts: Contracts that give the buyer the right, but not the obligation, to buy (call option) or sell (put option) an underlying asset at a specified price before or on a specific date.
Swaps: Agreements to exchange cash flows or other financial instruments between parties, often used for interest rates or currencies.
Forwards: Similar to futures but are customized contracts traded over-the-counter (OTC) instead of on an exchange.
Secret Insight #1: The true power of derivatives lies not in the instruments themselves but in understanding their relationship with the underlying asset. Every option or futures contract is essentially a tool to manage risk or leverage opportunity—but misuse can magnify losses.
2. Leverage: A Double-Edged Sword
One of the most enticing aspects of derivatives is leverage. By putting down a fraction of the asset’s value, traders can control large positions. For instance, with a futures contract, you might control $100,000 worth of stock by investing just $10,000 as margin.
However, leverage is a double-edged sword. While profits can multiply, losses do too. Understanding the margin requirements, initial margin, and maintenance margin is critical. Secretly successful derivative traders treat leverage as a tool for precision, not speculation.
Secret Insight #2: The best traders use leverage conservatively and adjust it dynamically based on market volatility, rather than maximizing exposure blindly.
3. Hedging: Risk Management is the Hidden Key
While derivatives are often associated with speculation, professional traders primarily use them to hedge risk. Hedging involves taking a position in a derivative to offset potential losses in the underlying asset.
Example: A portfolio manager holding a large number of tech stocks may buy put options to protect against a market downturn. If stocks fall, the profit from the put options offsets the loss.
Cross-Hedging: Traders sometimes hedge using derivatives of a correlated asset when a direct hedge is unavailable.
Secret Insight #3: The most powerful secret in derivative trading is that you don’t always need to predict market direction to profit. Proper hedging ensures survival, which is the real foundation of consistent trading success.
4. Options: The Playground of Strategic Trading
Options offer unmatched flexibility, and understanding advanced options strategies separates amateurs from pros. Some commonly used strategies include:
Covered Call: Holding the underlying stock and selling call options to earn premiums while slightly limiting upside.
Protective Put: Buying a put option to protect an existing long position.
Straddles and Strangles: Betting on volatility rather than direction, buying calls and puts simultaneously to profit from big price swings.
Spreads: Using multiple options with different strike prices or expirations to limit risk while maintaining potential profit.
Secret Insight #4: Options are not just instruments for speculation; they are precision tools to tailor your risk-reward profile. Successful traders often combine multiple strategies to create synthetic positions that mimic market exposure while controlling risk.
5. Timing and Volatility: The Invisible Forces
A critical, often underappreciated, aspect of derivative trading is timing. Unlike stocks, the value of options and futures is heavily influenced by time decay (theta) and implied volatility (IV).
Time Decay: Options lose value as expiration approaches, a phenomenon most novice traders underestimate.
Implied Volatility: Options pricing depends on expected future volatility. Traders who anticipate shifts in IV can profit even if the underlying price remains steady.
Secret Insight #5: Mastering derivatives is largely about mastering the clock and the market’s emotional state. High volatility periods are opportunities for premium collection, while calm markets favor directional bets.
6. Arbitrage and Mispricing: The Professional Edge
Arbitrage opportunities arise when derivatives are mispriced relative to their underlying assets. For instance, a futures contract trading below its theoretical fair value creates a cash-and-carry arbitrage opportunity. Similarly, options mispricing can be exploited via synthetic positions.
Secret Insight #6: Most retail traders compete to predict price direction, while professionals often profit from inefficiencies and mispricings. Knowing when the market is wrong can be more profitable than knowing when it is right.
7. The Psychology of Derivative Trading
A secret often hidden in textbooks is that derivative trading is as much psychological as technical. The leverage and speed of derivatives amplify emotions—fear and greed can lead to catastrophic losses. Successful traders exhibit:
Discipline: Strict adherence to trading plans and risk limits.
Patience: Waiting for high-probability setups rather than chasing the market.
Adaptability: Adjusting positions dynamically based on market conditions rather than stubbornly sticking to predictions.
Secret Insight #7: Emotional intelligence is a derivative trader’s secret weapon. The market always offers opportunities, but controlling yourself ensures survival and long-term profitability.
8. Risk Management: Protect First, Profit Later
Perhaps the most critical secret in derivative trading is risk management. Traders often focus on potential profit while neglecting potential losses. Key principles include:
Position Sizing: Never risk more than a small percentage of total capital on a single trade.
Stop Losses: Automated or mental exit points prevent small losses from becoming catastrophic.
Portfolio Hedging: Diversifying exposure across different assets, sectors, or derivative types.
Margin Monitoring: Avoid over-leverage, which can trigger margin calls in volatile markets.
Secret Insight #8: The goal is not to win every trade but to avoid ruin. Derivative trading secrets favor survival and compounding small wins over chasing high-risk “big wins.”
9. Insider Tools and Data: The Market Edge
Advanced traders gain an edge by leveraging tools that provide insight into market positioning:
Open Interest and Volume Analysis: Tracking changes in futures and options can reveal market sentiment.
Implied Volatility Surfaces: Understanding IV across strikes and expirations helps spot mispricing.
Correlation and Greeks Analysis: Delta, gamma, theta, vega, and rho metrics allow traders to quantify sensitivity to market changes.
Secret Insight #9: Successful derivative traders treat data as fuel. Knowing how the market is positioned can help anticipate moves before they happen.
10. Continuous Learning: The Lifelong Secret
Derivatives are dynamic; markets evolve, instruments get more complex, and strategies shift with regulatory and economic changes. Traders who stay ahead are lifelong students, constantly refining:
Market models
Pricing techniques
Strategy combinations
Risk management rules
Secret Insight #10: The single most reliable secret of derivative trading is humility. Accepting that the market can always surprise you ensures you remain flexible and avoid catastrophic losses.
11. Practical Takeaways for Aspiring Traders
Start Small: Begin with simulated or small-size trades to master instruments.
Focus on One Market: Specialize in one type of derivative—options, futures, or swaps—before diversifying.
Document Every Trade: Learn from successes and failures to refine strategies.
Avoid Over-Leverage: Leverage magnifies losses as much as gains; control it carefully.
Master Volatility: Understand how time decay and implied volatility impact pricing.
Hedge Thoughtfully: Protecting capital is more important than chasing profits.
Conclusion
Derivative trading is not just about predicting market direction. It is about mastering risk, timing, leverage, and psychology. Professionals profit by understanding mispricings, managing exposure, and exploiting volatility intelligently. The secrets of derivatives lie in subtlety—small edges, disciplined risk management, and continuous learning compound over time into substantial returns.
Success in derivative trading is less about luck and more about precision, patience, and protection. Those who master these principles can unlock the true potential of derivatives—an opportunity to control risk, amplify gains, and thrive in even the most volatile markets.
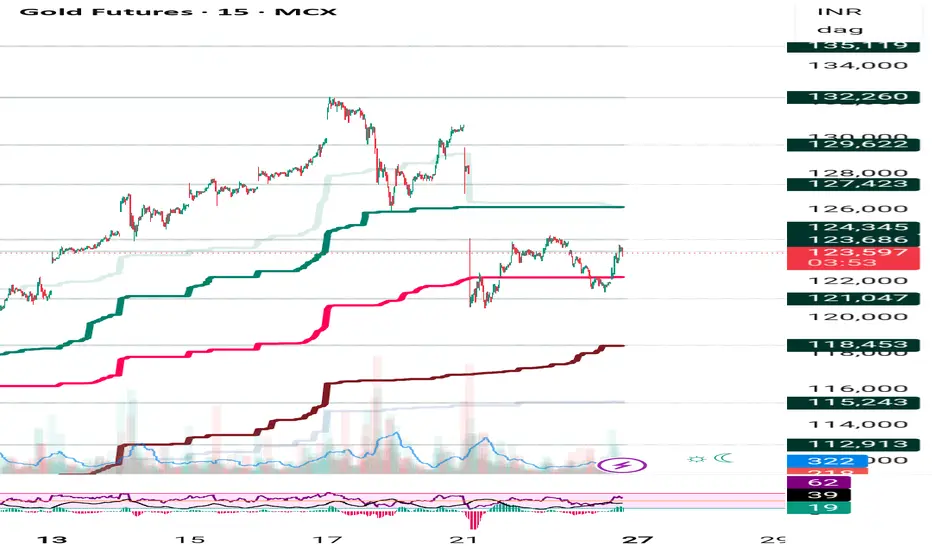
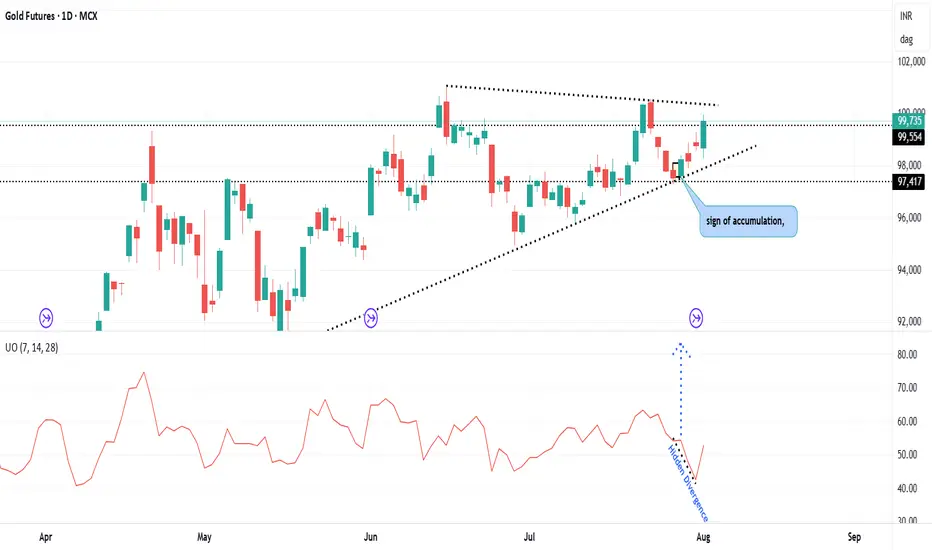
Gold all set for breakout ?Gold 99735 - pattern suggests a breakout in near terms. Volume indicates accumulation and indicator suggests hidden divergence add value to possibilities for a breakout.
[MCX] Gold Short IdeaThe expected short of last time in Gold never triggered as the low never broke.
Now we have an inside bar.
Note -
One of the best forms of Price Action is to not try to predict at all. Instead of that, ACT on the price. So, this chart tells at "where" to act in "what direction. Unless it triggers, like, let's say the candle doesn't break the level which says "Buy if it breaks", You should not buy at all.
=======
I use shorthands for my trades.
"Positional" - means You can carry these positions and I do not see sharp volatility ahead. (I tally upcoming events and many small kinds of stuff to my own tiny capacity.)
"Intraday" -means You must close this position at any cost by the end of the day.
"Theta" , "Bounce" , "3BB" or "Entropy" - My own systems.
=======
I won't personally follow any rules. If I "think" (It is never gut feel. It is always some reason.) the trade is wrong, I may take reverse trade. I may carry forward an intraday position. What is meant here - You shouldn't follow me because I may miss updating. You should follow the system I share.
=======
Like -
Always follow a stop loss.
In the case of Intraday trades, it is mostly the "Day's High".
In the case of Positional trades, it is mostly the previous swings.
I do not use Stop Loss most of the time. But I manage my risk with options as I do most of the trades using derivatives

Gold - Book Profits and stay safeprice is nearing 5th wave completion and good change for correction or else mad price moves on either direction
MGC _16/10/25_TP Hit Anticipation trade
Entry not taken hence as this trade occurred during non volume times
FYI .....
High Volume times ( all in IST hours )
Asian session - 530am to 7:30am
London session - 1130am to 2pm
NY session - 4pm to 8pm
London close - 930pm to 11pm

Gold buy on dip given near 121100 near now at 128000 book profitGold buy recommended at 121100 near now at 128000 book profit and wait for dip then again buy
How My Harmonic pattern projection Indicator work is explained below :
Recent High or Low :
D-0% is our recent low or high
Profit booking zone ( Early / Risky entry) : D 13.2% -D 16.1 % is
range if break them profit booking start on uptrend or downtrend but only profit booking, trend not changed
SL reversal zone (Safe entry ) : SL 23.1% and SL 25.5% is reversal zone if break then trend reverse and we can take reverse trade
Target : T1, T2, T3, T4 and .
Are our Target zone
Any Upside or downside level will activate only if break 1st level then 2nd will be active if break 2nd then 3rd will be active.
Total we have 7 important level which are support and resistance area
Until , 16% not break uptrend will continue if break then profit booking will start.
If break 25% then fresh downtrend will start then T1, T2,T3 will activate
1,3,5,10,15,20 minutes are short term levels.
30 minutes 60 minutes , 2 hours,3 hours, ... 1 day and 1 week chart positional and long term levels

XAUUSD: 15/10/25_ TP HitOver all Trend is bullish
1. Entered on a fakeout setup
2. Entered when candle retraced 50% of the fakeout candle
3. next candle took deep liquidity ( Fuelcandle has formed )
4. Waited for TP to hit

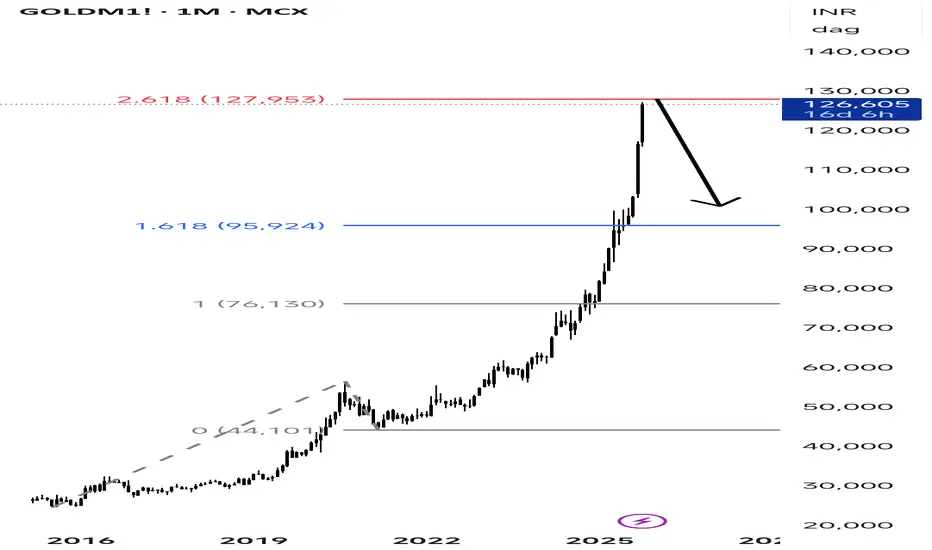
Gold positional target reachedGOLDM1 (MCX) Monthly Fibonacci Extension Analysis The current price of GOLDM1 is around ■126,690. Using Fibonacci extension levels, we identify major resistance and reversal zones. The
1.618 Fibonacci level at ■95,924 has already been breached strongly, indicating strong bullish
momentum. However, the price is now approaching the 2.618 level at ■127,953, which ishistorically considered an exhaustion point in trending markets. At this stage, gold is likely to face
selling pressure or profit booking from major market participants. If the price fails to break above
■128,000 convincingly, a downward correction towards ■100,000 is highly probable, which aligns
with the previous Fibonacci support zone. Conclusion: GOLDM1 is in a parabolic rise but has
entered a high-probability reversal zone. A short-term correction towards ■100,000 may occur
unless ■128,000 is broken with high volume.
XAUUSD : 14/10/24 _ TP HIT1. Trend is bullish- Daily
2. Support confirmed in 30 min during NY session
3. Entered on opening of next candle
4. Anticipated previous canlde wickfull
5. Closed full after wick fill

Part 2 Candle Stick PatternUnderstanding Call and Put Options
There are two basic types of options: Call Options and Put Options.
Call Option:
A call option gives the holder the right, but not the obligation, to buy an underlying asset at a specific price (called the strike price) before a specific date (called the expiry date).
Put Option:
A put option gives the holder the right, but not the obligation, to sell an underlying asset at a specific strike price before expiry.
