Gold mcx this week we booked 5500 points profit, holding buy nowParameter Data
Asset Name Gold (GC) MCX Feb 2026 Futures
Price Movement 🟥 Bearish Intraday / Bullish Macro (LTP: ₹1,33,772 | -0.56%)
Current Trade 🟨 WAIT & WATCH (Seek reversal near S1/S2 levels)
SMC Structure 🟩 Bullish Order Flow (Deep pullback into internal demand zone)
Trap/Liquidity Zones 🟥 Bull
Gold (Mini) Futures (Aug 2027)
No trades
Related commodities

A Complete Guide to Professional Trading MasteryTrade Like a Pro
Trading like a professional is not about making quick money or taking random bets in the market. It is a disciplined, structured, and highly skill-based approach that combines knowledge, psychology, risk management, and consistency. Professional traders treat trading as a business,

mcx gold update after breakoutgold mcx above 134700 gvn short term breakout looks 135280--400 or above 135500 sustain than looks 137--139000 soon. where support 134300@ below down only expect 134-133900+++

MCX GOLD: Wave 5 Begins - Target ₹1,57,000The Macro View:
Gold has successfully bounced from the Wave 4 correction zone. The structure on the Daily timeframe confirms we are initiating Wave (5) of the Grand Super Cycle.
Technical Observations:
Support Held: The price respected the 126,134 base (Wave 2 low), confirming the bullish str

Gold comex be ready for downmove heavy fall AI data showsParameter Data
Asset Name 🟨 Gold Futures (COMEX / GC - Feb '26)
Price Movement 🟩 Strong Bullish ($4,357.90 / +0.73% Today)
Current Trade 🟩 BUY ON DIPS (Targeting $4,398 ATH & $4,425)
SMC Structure 🟩 Bullish Order Flow (Strong acceptance above 4300 shelf)
Trap/Liquidity Zones 🟥 Liquidity Sweep: Below

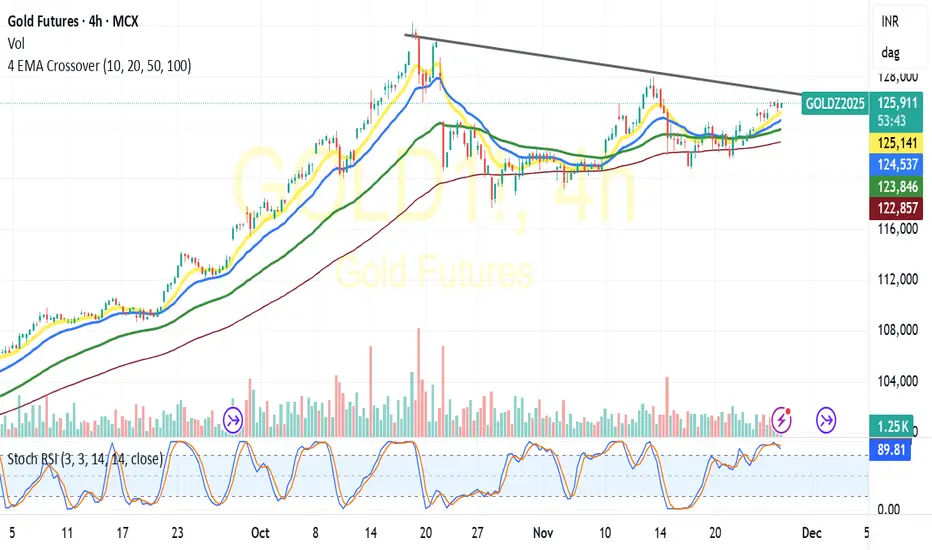
MCX GOLD: All set for yet another Golden Rally? Likely C&S B-OUTGOLD: After a brief consolidation seems its all set for another GOLDEN Rally.
Formed Cup&Handle pattern in Hourly charts.
Going by the pattern the logical targets would be 1,27,000-1,28,000-1,30,000 with 1,20,000-1,24,000 acting as the support.
(For educational purpose only)
GOLD MCX VIEWGold now 5wave ,Gold price 135390 above sustain Stop loss
Wave A 131500
Wave B 134500
Wave c 128000

Gold today booked 1200 points profit friday booked 1800 pointsParameter Data Data
Asset Name Gold Futures (MCX)
Price Movement 🟩 Strong Bullish/Momentum (₹134,685 / +0.8% Live)
Current Trade 🟩 BUY WITH MOMENTUM (Target next extension level)
SMC Structure 🟩 Strong Bullish Order Flow (Clear Higher Highs and Higher Lows)
Trap/Liquidity Zones 🟥 Supply/Trap Zone at

Gold mcx profit booking recommended again start buy on dipParameter Data Data
Asset Name Gold Futures (MCX)
Price Movement 🟩 Strong Bullish (₹1,32,469 / +2.06% from Prev. Close)
Current Trade 🟩 BUY ON DIPS/Maintain Long (Target ₹1,34,000)
SMC Structure 🟩 Bullish Order Flow (Higher Highs/Higher Lows - Strong trend continuation)
Trap/Liquidity Zones 🟥 Potent

gold mcx or spot gold update after new breakout mcx trader in gold no if and but-- above 132000 gold looks 135--137000+++ yes buy on dips good way for long term --- spot gold above 4260$ hold no worry for bulls in spot gold -- silver already given .spot gold son 4296--4320 than after new break possible . where now support 4220$ only sustain blow

See all ideas
Summarizing what the indicators are suggesting.
Neutral
SellBuy
Strong sellStrong buy
Strong sellSellNeutralBuyStrong buy
Neutral
SellBuy
Strong sellStrong buy
Strong sellSellNeutralBuyStrong buy
Neutral
SellBuy
Strong sellStrong buy
Strong sellSellNeutralBuyStrong buy
A representation of what an asset is worth today and what the market thinks it will be worth in the future.
Displays a symbol's price movements over previous years to identify recurring trends.
Frequently Asked Questions
The current price of Gold (Mini) Futures (Aug 2027) is 4,768.25 USD — it has risen 0.80% in the past 24 hours. Watch Gold (Mini) Futures (Aug 2027) price in more detail on the chart.
Track more important stats on the Gold (Mini) Futures (Aug 2027) chart.
The nearest expiration date for Gold (Mini) Futures (Aug 2027) is Jul 28, 2027.
Traders prefer to sell futures contracts when they've already made money on the investment, but still have plenty of time left before the expiration date. Thus, many consider it a good option to sell Gold (Mini) Futures (Aug 2027) before Jul 28, 2027.
Buying or selling futures contracts depends on many factors: season, underlying commodity, your own trading strategy. So mostly it's up to you, but if you look for some certain calculations to take into account, you can study technical analysis for Gold (Mini) Futures (Aug 2027). Today its technical rating is strong buy, but remember that market conditions change all the time, so it's always crucial to do your own research. See more of Gold (Mini) Futures (Aug 2027) technicals for a more comprehensive analysis.