REVERSAL IN COPPER?
Sell Call on Copper
Copper has formed a clear rejection near the 5.10–5.17 zone after an extended upside move. The price is struggling to sustain above the recent breakout area, indicating that the rally may have exhausted in the short term.
Volumes on the recent candles show distribution, and the momentum indicator (CCI) has started turning down from overbought territory, hinting at a possible short-term correction.
A clean break below 5.08 can open the gates for a move toward 4.87–4.90, which coincides with the previous demand zone and the start of the last impulsive leg.
Recommendation:
• Action: Sell below 5.08
• Stop Loss: 5.17
• Targets: 4.90 / 4.87
• View: Short-term (3–5 trading sessions)
The structure favors a mean reversion move rather than a continuation of the uptrend. The risk–reward setup is attractive with limited upside risk and meaningful downside potential.
Trade ideas

Let’s Ride the Copper Rebound!
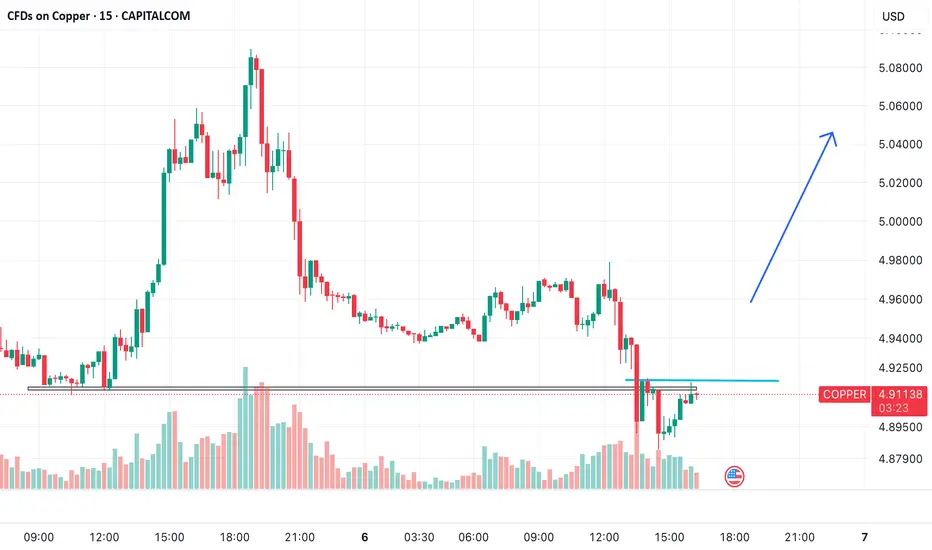
Current Price: $4.912
Direction: BUY
Technical Justification:
• Support Reclaim: Price has bounced off a previously respected horizontal support zone (around $4.89–$4.90), forming a potential double bottom.
• Volume Confirmation: Buying volume is increasing near the support zone—an early signal of accumulation.
• Breakout Anticipation: Price is testing a short-term resistance zone (~$4.92). A confirmed breakout above this level could trigger a strong upward move.
• Bullish Target: $5.04 (previous high and liquidity zone).
• Stop Loss: Below $4.89 (to invalidate the bounce setup).
Trade Plan:
• Entry: On breakout and sustained close above $4.922 (confirmation on strong candle + volume).
• Targets:
• T1: $4.96
• T2: $5.04
• Stop Loss: $4.885 (below previous wick low).
• Risk-Reward Ratio: Approx. 1:2.5+
After a corrective pullback, Copper is showing signs of reclaiming strength at key support. If bulls manage to hold above the $4.92 mark, we may be looking at the start of a fresh impulsive move toward $5+. Keep an eye on volume and candle strength for confirmation.
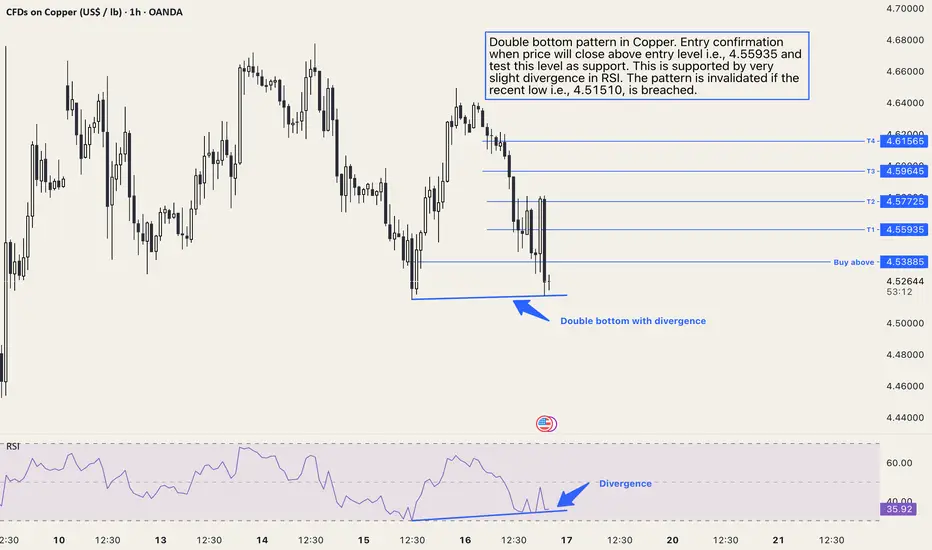
Copper XCUUSD: Double Bottom PatternDouble bottom pattern in Copper. Entry confirmation when price will close above entry level, i.e., 4.55935 and test this level as support. This is supported by a very slight divergence in RSI. The pattern is invalidated if the recent low, i.e., 4.51510, is breached.
The targets are shared on the chart as T1, T2, T3 and T4 respectively.
International CopperThere might be a super rush in all base metals and commodities after this breakout happens
Load up on Industrial metals more than base metals and noble metals

Bearish on Copper - Weekly and Daily viewOn Weekly, The price is trading in a channel/range and looks like it is headed towards the bottom of the channel
On daily, price is displaying corrective structure ABC.
My view: Although it looks like taking support at the trendline on daily, it coud potentially break and go down below.
I am not a SEBI registered Analyst. Views are personal and for educational purpose only. Please consult your Financial Advisor for any investment decisions.

Copper buying opportunity After striking resistance multiples times price broke the resistance , now the previous resistance will become support

Long Copper Hi everyone, Hope you are having a good day.
Let'sdiscuss the trade idea on copper. I use a volatility contraction pattern which is given by Mark Minervini.
I believe before every explosion, there is a contraction or what i better know it as "silence"
Obviously we have to take all the other things under consideration (like prior upmove, uptrend/downtrend, how its peers are performing and so on.
The idea for copper is because of the strong basing in daily time frame and note that basing is done after a prior upmove and then a retracement. I expect copper to break the highs easily.
here is my trade idea. ps:- i kept writing and it has started moving already.
Long COPPER 4.1373
Sl -4.0877
Targeting 4.2 atleast
Thanks
RaW^

Copper Looks short term downsideAs per chart its moving in a channel....Downside possible for 2-3 days....after consolidation it will start again its upward journey as per Hourly chart since its above trend line

Copper daily chart comes long Copper taking support on daily chart
Trendline support :Low of feb 24 ,,June 24 and , 16 July 24
Likely to bounce from here on
Massive rally on the cards


Copper at Important levelCopper should respect the green line which is Fib 0.5 level and falling wedge
#mcx #trading #nifty #crudeoil #stockmarket #nse #crude #bse #sharemarket #india #commodity #gold #nationalstockexchange #marketnews #zerodha #profit #business #forex #commodities #market #commoditytips #nyse #stockmarkets #sigsauer #trader #silver #rakeshjhunjhunwala #airsoft #intraday #intradaytrading

COPPER AnalysisAs we can see from Dec to Feb price touch 3.93 level 3 times and fail. 1st time it create a bearish engulfing second time bearish harami. third time shooting start.
if price break and close below 3.719 level then we can see a target of 3.5598.
resistance 1: 3.93025
resistance 2: 3.96299
Support : 3.55981

Copper Correction?Seems like the FOMC decision has triggered trouble for Copper & Equities alike.
A test of lower levels 3.6/3.5 is possible soon...
View negated if closes above 3.73 (on DCB as well as WCB)

short sell copperThe 200 ma is sloping down which is clear evidence of the downtrend. The 50ma is also below the 200ma further confirming the downtrend. This looks like a bounce in the downtrend. There is a key pivot level which the commodity is approaching now. This will be a good level to sell from a technical perspective.

COPPER ATH ?we can see falling wedge with vcp pattern with consolidation in this script with good divergence, if this resistance is taken out we can see all time high

Long Copper Copper is sitting at the support zone after a steep fall. Good chance that the mean reversion will lead to some rally and also the fact that we have the daily supports here will help that.

copper breaking above a key pivot level makes it a buyCopper has just crossed above a key pivot level on the hourly time frame. This levels has been tested on both sides as support and resistance earlier and hence it is an important level. The next level is roughly 2% away, thus it is logocal to think that we can get a rally of roughly 14 point in copper in mcx from here. The mcx copper is at 731 and hence the target of 745 is on the cards

copper long as it breaks above a key level Copper has just crossed above a key pivot level on the hourly time frame. This levels has been tested on both sides as support and resistance earlier and hence it is an important level. The next level is roughly 2% away, thus it is logocal to think that we can get a rally of roughly 14 point in copper in mcx from here. The mcx copper is at 731 and hence the target of 745 is on the cards

COPPER possible Elliott wave countsHello Friends,
Here we have shared possible Elliott wave counts on 4 hourly chart of COPPER, in which we can say that still selling pressure may continue for some while, because now possibly we are in complex correction phase as wave ((w))-((x))-((y)), in which we had completed ((w))-((x)) and now possibly we are unfolding wave ((y)) in which subdivisions are (a)-(b)-(c) and here also we had completed first two subdivisions as wave (a)-(b) and now we are unfolding wave (c), which can still continue same bearish trend ahead for now some while, where wave (c) would be completed , there wave ((y)) will be done, where wave ((y)) would be done, there wave 2 will be finished and we can say bearishness will be finished with wave 2. wave 2 will not retrace more than 100% of wave 1 so bottom of wave 1 is pegged at $ 3.2410 which should not be crossed as per wave principles, wave (c) can be or may be at equality of wave (a) which level is coming near $ 3.6269, and wave ((y)) can finish near equality with wave ((w)) which level is coming near $ 3.6618.
Well, post wave 2 we can assume fresh impulse ahead as wave 3.
wave (c) can be or may be at equality of wave (a) which level is coming near $ 3.6269
wave ((y)) can finish near equality with wave ((w)) which level is coming near $ 3.6618.
Most investors treat trading as a hobby because they have a full-time job doing something else.
However, If you treat trading like a business, it will pay you like a business.
If you treat like a hobby, hobbies don't pay, they cost you...!
Disclaimer.
I am not sebi registered analyst.
My studies are for educational purpose only.
Please Consult your financial advisor before trading or investing.
I am not responsible for any kinds of your profits and your losses.

Copper Extremely Bullish on monthly chartsOn the Monthly charts, I can see copper extremely bullish, targeting at the upper band of the BB. Try to go long on, the lower tf, then keep on trailing stop & taking multiple entry after every profit booking & avoiding shorts at all. Every dip should be used as an opportunity to go long, follow the divergence on the lower tfs. Then take longs following your trading systems. Flag pattern can be seen on the 12d chart & weekly as well.

Elliot wave counts of copper looks bullish post dips (if any)Hello Friends, here we had shared possible Elliot wave counts of copper on hourly time frame chart, in which it is showing that after impulse move as a wave 1 we are unfolding now correction waves as a (w) - (x) and (y), in which we had already finished and completed wave (w) and (x) now possibly we are in wave (y) of one bigger degree wave 2, so wave (y) may give some areas of dips too, which can be an opportunity to go Long at good levels, and an invalidation level is also mentioned on chart. My studies are for educational purpose only, Please Consult your financial advisor before trading or investing. I am not responsible for any kinds of your profits and your losses.
Most investors treat trading as a hobby because they have a full-time job doing something else.
However, If you treat trading like a business, it will pay you like a business.
If you treat like a hobby, hobbies don't pay, they cost you...!
Disclaimer.
I am not sebi registered analyst.
My studies are for educational purpose only.
Please Consult your financial advisor before trading or investing.
I am not responsible for any kinds of your profits and your losses.

BIG SHORTING OPPORTUNITY IN COPPERBig shorting opportunity in COPPER . As per monthly chart of COPPER , 3.8755 USD to 4.3165 USD is strong resistance zone ( supply zone) . From this zone sharp selling should come. 1.9915 USD & 1.2780 USD should be the two important targets downside. First target of 1.9915 USD will come till April 2024 & second target of 1.2780 will come till February 2025. As a trader one can find out shorting opportunities in COPPER in lower timeframes such as Daily & H4 .

