Doge Short Bearish Divergence Expecting Soon Doge Decending Channel, Bearish Divergence, Expected next in few hours
Trade ideas

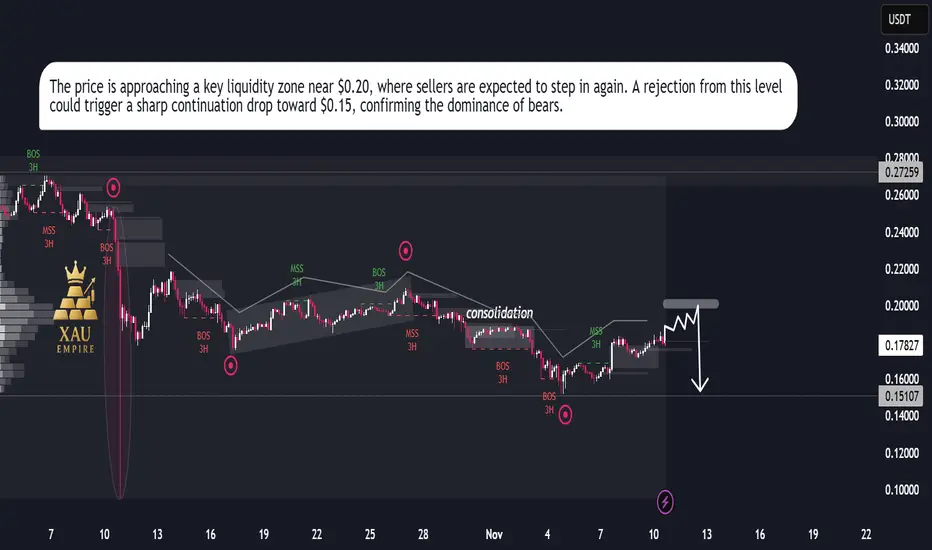
DOGEUSDT – Bearish Setup Toward $0.15DOGEUSDT – Bearish Setup Toward $0.15 📉
Dogecoin remains under strong bearish pressure, following multiple Breaks of Structure (BOS) and Market Structure Shifts (MSS) on the 3H timeframe. After a brief consolidation phase, price continues to respect the descending trend, indicating a lack of bullish strength.
Currently, DOGEUSDT is attempting a minor upward correction, likely to retest the $0.20 supply zone — a region that could act as a liquidity grab before the next major downside move. If price fails to hold above that zone, the market may trigger a sharp drop toward the $0.15 level, confirming continuation of the broader bearish trend.
Momentum remains weak, and sellers continue to dominate short-term rallies — suggesting further downside pressure in the coming sessions.
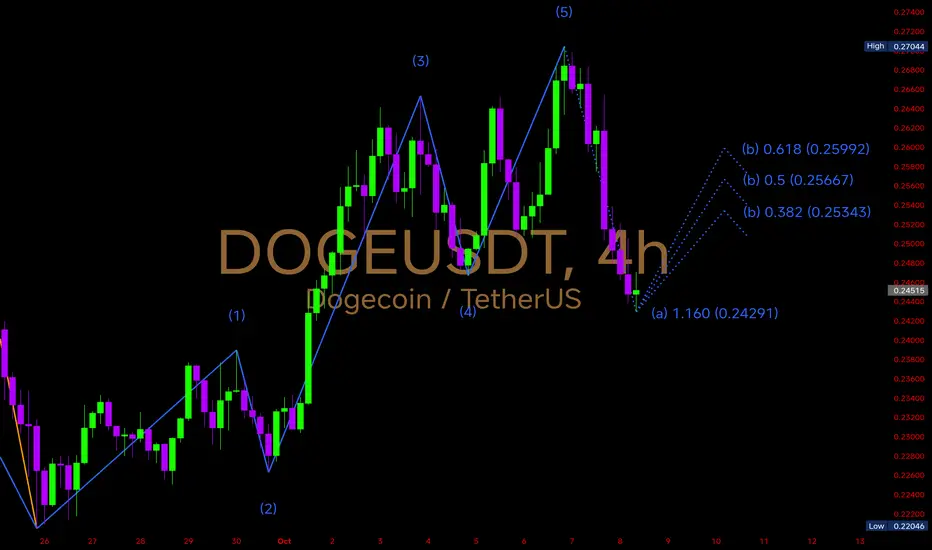
$DOGE just completed a clean 5-wave impulsive structure CRYPTOCAP:DOGE just completed a clean 5-wave impulsive structure on the 4H chart, peaking near 0.2704, and is now entering a corrective (ABC) phase.
The first leg of correction, wave (a), has extended down to 0.2429, aligning with the 1.160 Fibonacci extension, marking a potential local bottom.
Wave (b) retracement zones are likely between:
🔹 0.2534 (0.382 Fib)
🔹 0.2566 (0.5 Fib)
🔹 0.2599 (0.618 Fib)
If #DOGE finds strength at these retracement levels and forms a higher low, the next bullish impulse (wave (c)) could trigger a rebound toward 0.265 – 0.27 once again.
⚠️ However, if 0.2429 support fails, we might see a deeper correction toward 0.235 – 0.228 before any recovery.
This is a critical turning zone — bulls must hold 0.2429 to maintain momentum for the next wave up 🚀
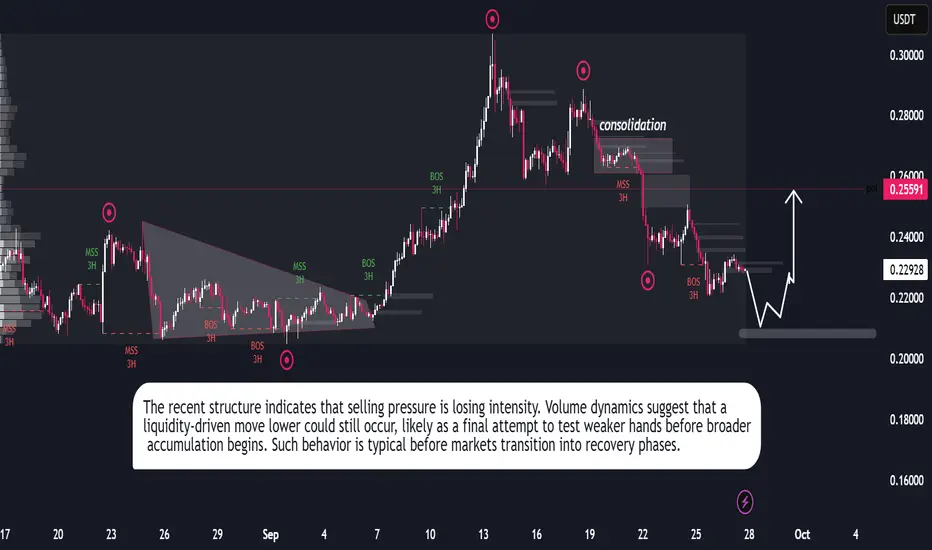
DOGEUSDT Forecast: Correction Near EndDogecoin has cycled through an aggressive expansion phase followed by distribution and a clear corrective sequence. The strong rally earlier in September reached exhaustion after buyers failed to sustain momentum, leading to a controlled decline. This retracement phase has pushed price back toward levels where market participants are reassessing risk and value.
Recent flows highlight reduced seller dominance, with price beginning to display characteristics of absorption. Market behavior suggests that liquidity is being tested, creating conditions where a potential recovery phase could emerge. Historical Dogecoin cycles often show this pattern: rapid expansions, corrective cooling, then renewed accumulation before the next impulse.
DOGEUSDT Market Report – From Correction to ExpansionDOGEUSDT has completed an impulsive upward cycle, followed by a controlled corrective structure. The earlier surge reflected aggressive positioning from buyers, while the subsequent retracement highlights the market’s need to neutralize inefficiencies and rebalance liquidity.
Price action now reflects a shift from short-term exhaustion into consolidation, where both sides of the market are being tested. The recent structural breaks and measured pullbacks are evidence of liquidity engineering — a common precursor to directional continuation.
The broader market context indicates that this phase is not a reversal but part of a higher-timeframe accumulation process. With order flow stabilizing and volatility compressing, DOGEUSDT is preparing for its next expansionary leg. If momentum sustains, the setup favors a bullish continuation cycle in the coming sessions.

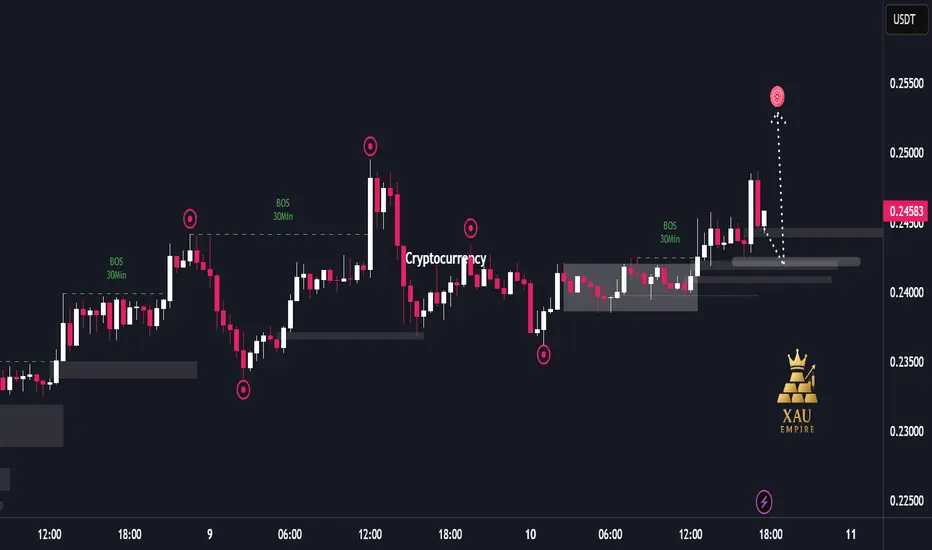
Institutional Flow Driving DOGE Upside Liquidity Hunt📊 Report-Based Analysis
Market Structure:
The chart shows multiple “Break of Structure (BOS)” events, indicating that institutional orders are driving the market direction. Frequent upside BOS suggests that the bullish trend is currently dominant.
Liquidity Movements:
Price has repeatedly hunted liquidity around major highs and lows (sharp wicks and sudden moves triggering stop losses) before returning to its intended direction. This behavior reflects strong institutional control over market flow.
Price Action Dynamics:
First, the market expanded upward with strong bullish momentum.
A sharp correction followed, creating volatility.
Afterwards, price entered a consolidation phase, which later broke to the upside.
Despite a recent rejection, the bullish structure remains intact.
Current Situation:
Price is trading around the 0.245 area. A large bullish candle was followed by a quick rejection, but the broader structure continues to lean bullish. Projections on the chart suggest a potential push higher as liquidity targets remain above.
Market Bias:
Short-term bias remains bullish. The consistent BOS and formation of higher lows show that the market is more likely to continue seeking upside liquidity in the near term.
Will Dogecoin hit $2 in Coming rally ?DOGE/USDT – Technical Analysis Update
CRYPTOCAP:DOGE is maintaining a solid structural support above the $0.150 key demand zone, with price action showing consistent defense of this level. As long as this zone remains protected on higher timeframes, bullish market structure remains intact for the current bull cycle and altseason.
Accumulation Zone: $0.230 – $0.180
This range aligns with prior demand imbalances and marks an optimal spot entry zone for long-term positioning.
A sustained hold and breakout from this accumulation range could open the path toward higher liquidity targets.
Upside Targets:
Target 1: $0.50 (mid-cycle resistance & liquidity pool)
Target 2: $1.00 (psychological level)
Target 3: $2.00 (macro cycle extension)
Bias: Bullish – Favoring spot accumulation within range
Invalidation: Daily close below $0.150 would shift bias to neutral/bearish
Price structure suggests CRYPTOCAP:DOGE is coiling for a high-momentum breakout once key liquidity levels are breached.
NFA & DYOR

Clear W Pattern in DogecoinDogecoin is making W Pattern in Weekly time frame💰💰
SL😓, Target🎯 and Entry😁 Points are Mentioned in chart.
After completion of W Pattern, the Coin is Likely to make a big Cup and Handle Pattern too😱😱
Note: This analysis is for Educational Purpose Only. Please invest after consulting a professional financial advisor.

DOGE/USD NOT BEARSIH , ITS JUST RETESTING ,STILL BULLISHDOGE IS A VERY STRONG MEME COIN , AFTER A STRONG BULL RUN ITS JUST RE-TESTING HERE
SOME PREDICTIONS FOR NEXT WEEK :
Bull Case: Break above $0.29 THEN $0.4
Base Case: Consolidation around $0.25 – $0.29
Bear Case: Drop toward $0.22 – $0.23
this coin have just retested and now want to fly to moon .
just make eye on doge coin
thanks

DOGE Long Swing Setup – Institutional Narrative Heating UpThe Dogecoin narrative is back in focus! Bit Origin ( NASDAQ:BTOG ) is raising $500M to build one of the world’s largest DOGE treasuries—becoming the first U.S.-listed company to treat CRYPTOCAP:DOGE as a core asset. With institutional interest rising, DOGE could see renewed momentum. Our last trade surged 50%—here’s the next entry:
📌 Trade Setup:
• Entry Zone: $0.20 – $0.21
• Take Profit Targets:
o 🥇 $0.23 – $0.24
o 🥈 $0.27 – $0.28
• Stop Loss: Daily close below $0.18
#crypto #DOGE #BTOG

$DOGE 1Hr Elliott Wave Outlook
#DOGE is currently forming the 5th impulse wave on the hourly chart, indicating a potential bullish continuation.
Completed Waves (1), (2), (3), and (4).
Now Wave (5) is in progress.
Potential move towards -
1.0 Fib : $0.2246
1.618 Fib : $0.2448
Bullish Confirmation - Sustained breakout above $0.2136
Invalidation Level - Any clear move below $0.1950 invalidates this bullish scenario.
Watch for volume-backed momentum above $0.2136 to confirm bullish continuation.

DTF H&S DOGE Ah, the classic Head and Shoulders—and I’m guessing you’re not talking about shampoo this time 😄
In trading, the Head and Shoulders pattern is a powerful reversal signal. It typically forms at the end of an uptrend and suggests a potential shift to a downtrend. Here's how it breaks down:
- Left Shoulder: Price rises, then dips.
- Head: Price rises again, reaching a higher peak, then dips.
- Right Shoulder: Price rises once more, but not as high as the head, then falls again.
- Neckline: A support line connecting the two dips. When price breaks below this line, it confirms the pattern.
There’s also an Inverse Head and Shoulders, which signals a potential reversal from a downtrend to an uptrend.
Since you’re diving deep into technical patterns, this one’s a must-have in your toolkit. Want to walk through a real chart example or explore how to trade it with entry, stop-loss, and target strategies? I’ve got you covered.

DOGE COIN he double bottom is a classic bullish reversal pattern in technical analysis. It resembles the letter "W", forming after a downtrend when the price hits a support level twice before breaking out upwards.
Key Features:
- Two distinct lows at roughly the same price level.
- A peak (neckline) between the two lows.
- Breakout confirmation when the price moves above the neckline.
Trading Strategy:
- Entry: Traders often enter a long position once the price breaks above the neckline.
- Stop-loss: Placed below the second bottom to manage risk.
- Target price: Typically measured by the distance between the neckline and the bottoms, projected upwards.
Would you like an example of how this pattern plays out in real market conditions?

130 UPSDIE MOVE $$$$It looks like you meant Fibonacci Retracement, a popular tool in technical analysis used to identify potential support and resistance levels based on the Fibonacci sequence. Traders use key retracement levels—23.6%, 38.2%, 50%, 61.8%, and 100%—to anticipate price corrections within a trend.

DOGEUSDT IN THE DANGER ZONE - SELLERS IN CONTROL?Symbol - DOGEUSDT
DOGEUSDT is encountering sustained selling pressure. Following a distribution phase characterized by a sharp upward move, the price has entered a correction phase and is now approaching a critical support area - often referred to as the 'panic zone'. A decisive breakdown below this level could accelerate the decline and trigger a more pronounced bearish trend.
DOGEUSDT has effectively relinquished the upward momentum accumulated during late April and early May. The distribution phase concluded around the 0.2600 level, after which the coin transitioned into a corrective decline. At present, DOGEUSDT is testing the pivotal support zone near 0.2140.
The focal point now is the base of the triangle formation near 0.2140 - a critical zone of support. A breakdown below this level would likely result in the liquidation of long positions and may prompt increased selling activity, thereby fueling bearish momentum.
Resistance levels: 0.2220, 0.2307
Support levels: 0.2145, 0.2135
The prevailing scenario anticipates a continuation of the downward trend. The primary trigger for further decline would be a confirmed breakdown below the 0.2135 support level, accompanied by price consolidation beneath this threshold.
Important Note: This bearish outlook would be invalidated if the price reverses and establishes sustained consolidation above 0.2220, A confirmed move above 0.2300 would strengthen bullish sentiment, at which point a renewed upward outlook would be considered.

XAU/USD - Mirror Concept Move PredictionBest opportunity for Traders?
This analysis covers the potential upside move that OANDA:XAUUSD can make over the next couple of days.
Applying the age old - Mirror Market Concept to the Gold chart, it is extremely clear that the potential levels that Gold will react to for sure are as follows:
1. Interim Resistance - $3434
2. Strong Resistance - $3480-$3500 (ATH)
3. Strong Support - $3200
Mirror Market Concept basically tells us that - whatever has already happened in the markets, will eventually happen again, with a few volume bursts here and there. Markets often tend to mirror their already existing moves but traders hardly take it seriously. It's all infront of your eyes traders! All the time. Try to take advantage of it.
Gold is at a very important support zone right now and is creating a similar structure, exactly like the previous upside move it just made in the first week of May , let's all hope that it gets enough volume to push prices upwards from here on, at least to the All Time High once again. Even if Gold has to fall, it has to sweep the sellers side liquidty created at the ATH and fall from there on, creating a Double Top structure.
What do you guys think? Let me know in the comments. Open to discussion :)
Trade Safe & don't over-leverage your positions!
Cheers!

Doge is set for a Rally 1. Current Price and Market Context
Recent Price Levels: As of May 11, 2025, DOGE trades at ~$0.24, with a market cap of ~$30.51B.
I believe the bottom is set, and a rally is imminent.
Chart for reference.

DOGEUSDT AT CROSSROADS - BULL TRAP OR BREAKOUT?Symbol - DOGEUSDT
DOGEUSDT is currently testing a key liquidity and resistance zone within the context of a prevailing downtrend, following a news-driven market rally. The critical question remains: Can this upward momentum be sustained, or will the market revert to a broader sell-off?
The overall downtrend persists. Recent market activity has been characterized by a corrective phase spurred by positive news flow, during which Bitcoin experienced a temporary strengthening, subsequently lifting altcoins such as DOGE. However, the sustainability of this upward movement is in question, as bearish sentiment remains dominant and no significant fundamental improvements have emerged to support long-term growth. Should Bitcoin resume its decline, DOGEUSDT is likely to follow suit.
From a technical perspective, the price is exhibiting signs of a potential false breakout above the resistance zone at 0.1570–0.1622, A consolidation below this range would suggest continued downside momentum, potentially driving the price toward the next key support area around 0.1364
Key Resistance Levels: 0.1570, 0.1622
Key Support Levels: 0.1364, 0.1277, 0.1154
A retest of the trend resistance remains possible. However, a sustained consolidation beneath the identified resistance zone would serve as a strong indication of seller dominance, increasing the likelihood of further declines. On the weekly timeframe, a critical trigger lies at 0.1421, breaching this level to the downside may open the path toward the support range between 0.1277 and 0.1025

DOGE - Next target will be huge$0.50 – Here’s Why
Dogecoin (DOGE), the meme coin that started as a joke but turned into a powerhouse in the crypto market, is showing strong signs of a major rally. With increasing adoption, improved market conditions, and strong technical indicators, DOGE is primed to reach $0.50 in the coming months. Let’s analyze why this price target is not just speculation but a probable scenario.
1. Strong Technical Rebound
Looking at the technical chart, DOGE has found solid support around the $0.15 - $0.17 range, which has acted as a key accumulation zone in past bull cycles. The price has started rebounding, forming a higher low structure, a strong indication of bullish momentum.
Key indicators supporting this move:
- Moving Averages: The price is attempting to reclaim the short-term moving average, which historically signals trend reversals.
- RSI Recovery: Relative Strength Index (RSI) is bouncing from oversold levels, indicating that selling pressure is fading and a bullish wave is incoming.
- Previous Price History: DOGE has followed a pattern of consolidating at key levels before explosive moves. A similar setup is emerging now.
2. Market Sentiment is Turning Bullish
Crypto market sentiment plays a massive role in DOGE’s price movement. Several factors indicate that bullish sentiment is returning:
- Bitcoin’s Bull Run: Historically, when Bitcoin enters a strong uptrend, altcoins like DOGE follow with significant gains.
- Increased Social Media Hype: DOGE remains one of the most discussed cryptocurrencies on social media, and its viral nature often leads to parabolic rallies.
- Whale Accumulation: Large holders have been steadily accumulating DOGE, suggesting confidence in an upcoming breakout.
3. Adoption and Real-World Use Cases
DOGE’s growth is no longer just about memes; real adoption is happening:
- Elon Musk and Tesla Support: Tesla accepts DOGE for merchandise, and Musk has hinted at potential deeper integration into his businesses, including X (formerly Twitter).
- Retail Adoption: More merchants and payment processors are integrating DOGE, increasing its use as a digital currency.
- Layer 2 Scaling Solutions: Ongoing developments in improving Dogecoin’s transaction speed and efficiency are making it more practical for everyday transactions.
4. The Next Big Breakout: $0.50 is the Target
Based on historical price movements and technical structure, a breakout above $0.25 could lead to a rapid move toward $0.50. The projected price path aligns with previous Dogecoin cycles, where strong rallies have taken place after accumulation periods.

Doge push to downPlease I request follow me for idea about any token or coin . There are no suggestions any investment so please trade wisely and learn from the trade.
Sellers control the doge but some buyer and seller fight for control market but all Market negative sentiment so next target where buyer interested larger

DOGE/USDT – Prime Accumulation Zone & Bullish OutlookDOGE/USDT – Prime Accumulation Zone & Bullish Outlook 🚀
Current Status : Trading at $0.15-$0.20 support zone, a strong accumulation area. DOGE is currently 64% down from its ATH, presenting an attractive risk-reward setup.
Key Levels:
Support: $0.15 - $0.20 (Accumulation Zone)
Targets: $0.60 / $1.50 / $2 / $2.50
Why Bullish?
Technical Perspective: DOGE is holding key support and could see a breakout on volume expansion.
Catalyst: Elon Musk’s continued backing makes it a strong contender for long-term gains.
Strategy: Any major dip is a buying opportunity for long-term holders. Keep an eye on volume surges and market sentiment!
Note: NFA & DYOR

$doge long idea as per elliot wave doge in 5th wave as final wave. as per count it will give 7x profit from here

Will the Doge trend down?If Doge falls below 0.32440 between 06-01-2025 and 12-01-2025, the direction will be negative and our first support will be 36400. If it passes the 0.39439 resistance level above, 0.4239 is an important resistance level.
When I look at the ligation map, it is between 0.3373 (321,500M) and 0.4299 (209,45M) for 7 days, but the Longs are seen to have increased.
I would be happy if you comment on my analysis :)
