DOT Price Levels Up by 427.19% Since InceptionPolkadot performed a positive momentum on Thursday’s trading session
Polkadot price is $20.92, which is up by 19.56% in the last 24-hour time-frame and 29.53% up from the previous week
DOT/BTC pair is positive with a loss of 2.10% in Thursday’s trading session (0.00054151)
themarketperiodical.com
DOTUSD.P trade ideas

DOT PRICE WEEKLY LOSS SURGES ABOVE -10.00%Polkadot performed a negative momentum on Monday’s trading session
Polkadot coin price is $16.28, which is down by 1.75% in the last 24-hour time-frame and 12.27% down from the previous week
DOT/BTC pair is negative with a loss of 2.79% in Monday’s trading session (0.00047384)
www.thecoinrepublic.com

DOT Projects For Positive BounebackPolkadot performed a positive momentum on Saturday’s trading session
Polkadot coin price is $16.49, which is up by 2.03% in last 24 hour time-frame and 8.91% down from the previous week
DOT/BTC pair is negative with a loss of 1.69% in Saturday’s trading session (0.00048233)
themarketperiodical.com

DOT Projects Uptrend While Surging $16.66Polkadot performed a positive momentum on Thursday’s trading session
Polkadot coin price is $16.41, which is up by 1.35% in last 24 hour time-frame and 2.55% down from the previous week
DOT/BTC pair is positive with a gain of 3.33% in Thursday’s trading session (0.00052614)
themarketperiodical.com

Polkadot Current Price Struggles to Breach $18.45Polkadot current price is up by 8.65% on Saturday's trading session. The price is struggling to break out from the resistance of $18.45. If it breaks and sustains above the resistance, one can further expect a bullish trend in the coin till the next resistance level of $20.89.
Resistance: $18.45, $20.89
Support: $10.59

Polkadot Regaining Bullish Momentum Amid Negative Trend Polkadot coin price is up by 0.74% on Friday's trading session. The price may consolidate for a while. If it sustains above both the EMA, it can move towards the resistance, and one can further expect a bullish trend in the coin till the resistance level of $18.24.
Resistance: $18.24
Support: $10.56

Polkadot Coin Price Gradually Projects Bullish Momentum On IntraPolkadot coin price is down by 8.18% on Thursday's trading session. The price may soon move towards the resistance level of $18.24. If it sustains above the resistance, one can further expect a bullish trend in the coin.
Resistance: $18.24
Support: $14.77

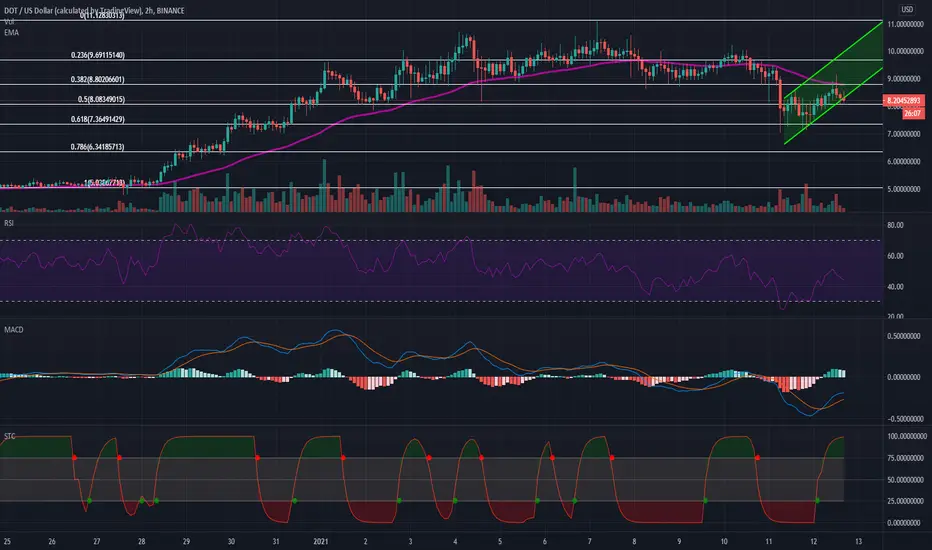
Polkadot Price Potential For Positive Breakout Above 50-EMAThe technical chart reflects on the positive bounce back made by the price levels of Polkadot after touching the critical support area of $7.00 due to a downtrend from the past couple of trading sessions. A positive breakout above the 0.382fib level can surely be a bullish indication for the crypto asset for upcoming market sessions. On the contrary, a negative breakout from the falling channel pattern might indicate the existence of the bears.
The Relative Strength Index (RSI) looked to regain bullish levels after suffering negative breakouts to the oversold region while standing at 47.65.
The Schaff Trend Cycle (STC) has indicated a buying signal during the current market session indicating potential positive momentum for the coin.
The Moving Average Convergence & Divergence (MACD) has formed a bullish crossover and the levels will be looking for a positive breakout above the histogram line.
Polkadot (DOT) Analysis: DOT Consolidates Between R&SOn the weekly chart, Polkadot is reflecting a bearish trend. The price went up to $10.63 on Jan 7, 2021, with the help of heavy buying. After breaking down the support zone, the price fell $8.86 on Jan 8, 2021, providing an overall loss of -16.65% to its investors within a day. The DOT/BTC pair is in the positive trend with a value of 0.00023292 BTC (1.60%)

Polkadot Analysis: Drops From The Pattern;Suspected to Climb $10The weekly technical chart of Polkadot highlights a robust bullish trend built by the coin, which is followed by reasonable price corrections at regular intervals. DOT was trading in the symmetrical triangle pattern and fell below the pattern reflecting a bearish movement. The price currently trades at $9.56 below its resistance zone of $10.11 and the following support zone of $9.58. If it breaks above the current resistance, we might expect the revival of bulls.
If we dive into the weekly chart's 30-minute time frame, a bullish engulfing candle is formed, which indicates a buying signal in the coin.
Concerning the Relative Strength Index (RSI), 41 indicates that the coin is in a neutral phase. After forming a descending parallel channel from Jan 7 and going down from the overbought to a neutral zone.
Meanwhile, the Moving Average Convergence Divergence (MACD), had a bearish crossover signal line on Jan 7, 2021, trading session indicating a selling signal in the coin. The trend remains negative due to the overall market conditions.
The Schaff Trend Cycle Indicator (STC) of 0.13 displays a selling sign in the coin on Friday's trading session and can shortly indicate a buy-in in the upcoming market session.

Polkadot DOT Can Slip Below Its Daily Support LevelThe weekly technical chart of Polkadot highlights a positive trend built by the coin. We can see a sudden spike in price movements on Thursday's trading session. The price is currently sitting at $9.96, with the resistance zone placed at $10.11 with the following support zone of $9.85. The price is testing the support trajectory. One can see a bullish trend soon if the price reaches above its resistance zone.
Meanwhile, the Relative Strength Index (RSI) with a value of 49 indicates that the coin is performing downward and forms a descending parallel channel on the index.
The Moving Average Convergence Divergence (MACD) had a bearish crossover signal line on January 7, 2021, indicating a potential of negative retracement in the coin. The histogram also started to form red bars after the crossover.
The Schaff Trend Cycle (STC) indicator shows a selling signal for the coin with the value of 16, stipulating Polkadot can fall below its given support and soon be in an oversold region.
