Markets Are Warning Again: Dollar Up, Risk Down-Inflation Next?Right now we are seeing something very important in the markets.
Silver is falling.
Crypto is falling.
Equity markets are falling.
At the same time, the DXY (US dollar) is rising.
This usually means big money is moving out of risky assets and going into cash and safety. When the dollar becomes str
U.S. Dollar Index
No trades
About U.S. Dollar Index
The U.S. Dollar Index tracks the strength of the dollar against a basket of major currencies. DXY was originally developed by the U.S. Federal Reserve in 1973 to provide an external bilateral trade-weighted average value of the U.S. dollar against global currencies. U.S. Dollar Index goes up when the U.S. dollar gains "strength" (value), compared to other currencies. The following six currencies are used to calculate the index:
Euro (EUR) 57.6% weight
Japanese yen (JPY) 13.6% weight
Pound sterling (GBP) 11.9% weight
Canadian dollar (CAD) 9.1% weight
Swedish krona (SEK) 4.2% weight
Swiss franc (CHF) 3.6% weight
Euro (EUR) 57.6% weight
Japanese yen (JPY) 13.6% weight
Pound sterling (GBP) 11.9% weight
Canadian dollar (CAD) 9.1% weight
Swedish krona (SEK) 4.2% weight
Swiss franc (CHF) 3.6% weight
Related indices

DXY : Decisive Move ComingDXY is stuck in a range for long and ascending triangle type formation can be seen on weekly charts. Any break either upside or downside can bring a big move and sharp move

$DXY | Macro Breakdown Continues | Target 80Timeframe: Monthly / 6M
Bias: Bearish
DXY has confirmed a multi-decade structural breakdown on higher time frames.
This is not a pullback — it’s a cycle shift.
Previous support flipped into resistance
Failed reclaim = continuation signal
Similar structure last seen pre-2008
🎯 Target: 80
❌ Invalidati

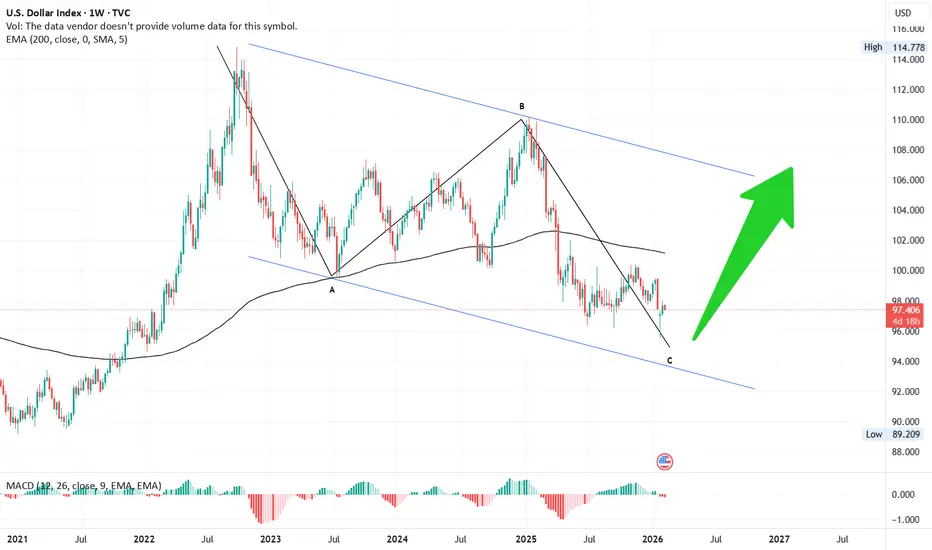
#DXY📊 DXY Technical Outlook 💵
On 26 Sep 2022, the Dollar Index (DXY) began a weekly correction. What followed was a clear 5-wave decline, bottoming at 99.75 on 17 Jul 2023 — marking the completion of Wave A.
From there, the index rallied in 3 waves, reaching a high of 110 on 23 Dec 2024, forming W
Dominate Event Markets: Your Edge in Every EventUnderstanding Event Markets
An event market is any market environment where price action is primarily driven by a known or unknown catalyst. These catalysts disrupt equilibrium. Liquidity thins, volatility expands, and traditional correlations often break down. The key difference between regular ma

DXY Breaks a Multi-Year SPT — A Structural Shift in the Dollar📉 Why the U.S. Dollar Is Falling – The Bigger Picture Behind DXY
The recent weakness in the U.S. Dollar (DXY) is not a random move or just a short-term reaction. It’s a result of a deeper shift in market expectations and global capital flows.
Markets are now pricing in a slower U.S. economy and a

A New World without the US Dollar at the helm?Civilizations halt.
Empires fall.
New worlds and new world orders are built on the ruins of older greats.
Is this the slow decline of the largest empire known to mankind?
Whatever happens, I wish it happens over the next 50 years so I can be here to witness the shift in awe.
Technically speaking, U

Part 2 Support and ResistanceOption Pricing and the Greeks
Option prices are influenced by factors such as the underlying price, time to expiration, volatility, interest rates, and dividends. These factors are measured using Greeks, including:
Delta: Sensitivity to price changes in the underlying asset.
Gamma: Rate of change

Derivatives Explained: Meaning, Types, Uses, and Its ImpactsWhat Are Derivatives?
A derivative is a financial contract between two or more parties that derives its value from the price movement of an underlying asset. The contract itself has no independent value; instead, its worth depends entirely on how the underlying asset performs in the market. For exa

Part 10 Trade Like Institutions Single-Leg Strategies
A. Long Call
Buy call when expecting uptrend.
B. Long Put
Buy put when expecting downtrend.
C. Covered Call
Sell call against stocks you own.
D. Cash-Secured Put
Sell put when you want to buy stock at a lower price.

See all ideas
Summarizing what the indicators are suggesting.
Oscillators
Neutral
SellBuy
Strong sellStrong buy
Strong sellSellNeutralBuyStrong buy
Oscillators
Neutral
SellBuy
Strong sellStrong buy
Strong sellSellNeutralBuyStrong buy
Summary
Neutral
SellBuy
Strong sellStrong buy
Strong sellSellNeutralBuyStrong buy
Summary
Neutral
SellBuy
Strong sellStrong buy
Strong sellSellNeutralBuyStrong buy
Summary
Neutral
SellBuy
Strong sellStrong buy
Strong sellSellNeutralBuyStrong buy
Moving Averages
Neutral
SellBuy
Strong sellStrong buy
Strong sellSellNeutralBuyStrong buy
Moving Averages
Neutral
SellBuy
Strong sellStrong buy
Strong sellSellNeutralBuyStrong buy
Displays a symbol's value movements over previous years to identify recurring trends.
Frequently Asked Questions
The current value of U.S. Dollar Index is 96.882 USD — it has fallen by −0.88% in the past 24 hours. Track the index more closely on the U.S. Dollar Index chart.
U.S. Dollar Index reached its highest quote on Feb 25, 1985 — 164.720 USD. See more data on the U.S. Dollar Index chart.
The lowest ever quote of U.S. Dollar Index is 70.698 USD. It was reached on Mar 17, 2008. See more data on the U.S. Dollar Index chart.
U.S. Dollar Index value has decreased by −0.37% in the past week, since last month it has shown a −2.11% decrease, and over the year it's decreased by −10.37%. Keep track of all changes on the U.S. Dollar Index chart.
U.S. Dollar Index is just a number that lets you track performance of the instruments comprising the index, so you can't invest in it directly. But you can buy U.S. Dollar Index futures or funds or invest in its components.