DYDX could be one of the biggest 10x plays this cycle DYDX is finally showing strong reversal signals after months of downtrend.
What’s happening?
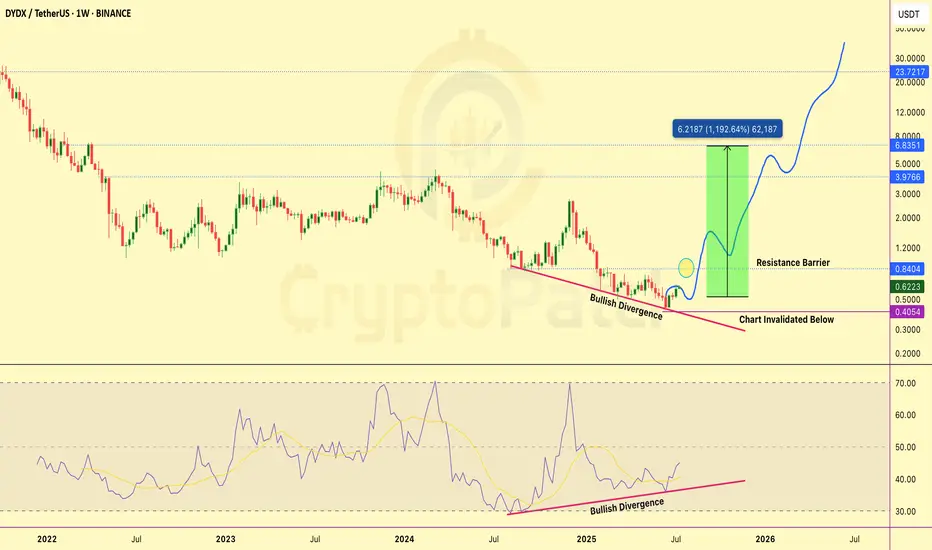
We’ve spotted a clear Bullish Divergence on both the price chart and RSI. While the price made lower lows, RSI is printing higher lows — a classic signal that selling pressure is weakening and buyers are st
Key data points
No news here
Looks like there's nothing to report right now


DYDX Bulls on the Move! 🐂 Keep an Eye on the Breakout 📈💎 DYDX is currently displaying a bullish market structure and forming a cup and handle pattern, which suggests an increased likelihood of a bullish move.
💎If DYDXUSDT breaks above the resistance area, we can anticipate a bullish movement towards the next resistance level. In the event of a pullback

dydx expected to go bigdydx seems to be going big as total cash inflow has surged and the chart shows a bull flag breakout , also the recent trends suggest that defi tokens/coins are getting attention after a rally of AI based coins .
If btc doesn't dump and the BTC dominance decrease os consolidates then we can see dydx

DYDXUSDT Long Setup: Targeting Key LevelsWe're examining the DYDXUSDT pair for a potential long position, guided by technical analysis on the daily chart. The price action has settled into a consolidation pattern, making a strong base around the 2.979 entry point. This area has acted as a springboard, sending price action upwards with incr


DYDX/USDT 500% Potential From HereDYDX/USDT Chart Overview
The chart signals a bullish trend with a potential breakout in the green box zone. If you missed it, don't worry – I'm eyeing every significant dip for potential buy opportunities.
On the higher time frames (HTF), there's a promising Bull Flag formation. Things could get s


DYDX long-term picture1/ CRYPTOCAP:DYDX - solid consolidation in a long-term bullish falling wedge. Not quite ripe, needs more months of consolidation.
Weekly RSI shows promising bullish divergence. 🚀
Chart suggests best buy zones at 0.7 to 1.5 USD. Mega bullish breakout expected Q1-Q2 2024.
Fundamentals strong,

See all ideas
Summarizing what the indicators are suggesting.
Oscillators
Neutral
SellBuy
Strong sellStrong buy
Strong sellSellNeutralBuyStrong buy
Oscillators
Neutral
SellBuy
Strong sellStrong buy
Strong sellSellNeutralBuyStrong buy
Summary
Neutral
SellBuy
Strong sellStrong buy
Strong sellSellNeutralBuyStrong buy
Summary
Neutral
SellBuy
Strong sellStrong buy
Strong sellSellNeutralBuyStrong buy
Summary
Neutral
SellBuy
Strong sellStrong buy
Strong sellSellNeutralBuyStrong buy
Moving Averages
Neutral
SellBuy
Strong sellStrong buy
Strong sellSellNeutralBuyStrong buy
Moving Averages
Neutral
SellBuy
Strong sellStrong buy
Strong sellSellNeutralBuyStrong buy
Displays a symbol's price movements over previous years to identify recurring trends.
Frequently Asked Questions
The current price of DYDX / TetherUS (DYDX) is 0.6102 USDT — it has risen 1.18% in the past 24 hours. Try placing this info into the context by checking out what coins are also gaining and losing at the moment and seeing DYDX price chart.
DYDX / TetherUS price has fallen by −11.50% over the last week, its month performance shows a 27.19% increase, and as for the last year, DYDX / TetherUS has decreased by −51.92%. See more dynamics on DYDX price chart.
Keep track of coins' changes with our Crypto Coins Heatmap.
Keep track of coins' changes with our Crypto Coins Heatmap.
DYDX / TetherUS (DYDX) reached its highest price on Sep 30, 2021 — it amounted to 27.8570 USDT. Find more insights on the DYDX price chart.
See the list of crypto gainers and choose what best fits your strategy.
See the list of crypto gainers and choose what best fits your strategy.
DYDX / TetherUS (DYDX) reached the lowest price of 0.4136 USDT on Jun 22, 2025. View more DYDX / TetherUS dynamics on the price chart.
See the list of crypto losers to find unexpected opportunities.
See the list of crypto losers to find unexpected opportunities.
The safest choice when buying DYDX is to go to a well-known crypto exchange. Some of the popular names are Binance, Coinbase, Kraken. But you'll have to find a reliable broker and create an account first. You can trade DYDX right from TradingView charts — just choose a broker and connect to your account.
Crypto markets are famous for their volatility, so one should study all the available stats before adding crypto assets to their portfolio. Very often it's technical analysis that comes in handy. We prepared technical ratings for DYDX / TetherUS (DYDX): today its technical analysis shows the sell signal, and according to the 1 week rating DYDX shows the sell signal. And you'd better dig deeper and study 1 month rating too — it's sell. Find inspiration in DYDX / TetherUS trading ideas and keep track of what's moving crypto markets with our crypto news feed.
DYDX / TetherUS (DYDX) is just as reliable as any other crypto asset — this corner of the world market is highly volatile. Today, for instance, DYDX / TetherUS is estimated as 5.80% volatile. The only thing it means is that you must prepare and examine all available information before making a decision. And if you're not sure about DYDX / TetherUS, you can find more inspiration in our curated watchlists.
You can discuss DYDX / TetherUS (DYDX) with other users in our public chats, Minds or in the comments to Ideas.