Dollar seems Bearish for Long termDollar index(DXY) seems to entering the bearish setup for an Target of 94.500.
As per wave analysis one can go for shorting the Dollar for the above target.

DXY MULTI TIMEFRAME ANALYSIS Hello traders , here is the full multi time frame analysis for this pair, let me know in the comment section below if you have any questions , the entry will be taken only if all rules of the strategies will be satisfied. wait for more price action to develop before taking any position. I suggest yo

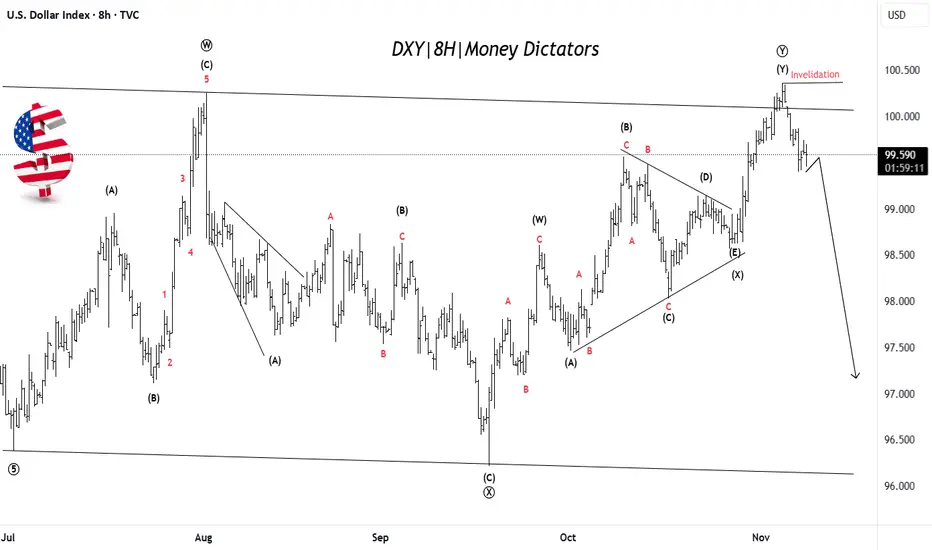
US Dollar Weakness Likely After Final Push UpDXY has completed a complex corrective W–X–Y pattern, with the final leg (Y) recently topping near the 100.50 zone. Price has failed to break above the invalidation level, suggesting the uptrend is losing strength. This signals that the dollar may have finished its corrective phase and could now sta
DXY Weekly Outlook 10/11/2025 - 14/11/2025Wassup Lads!
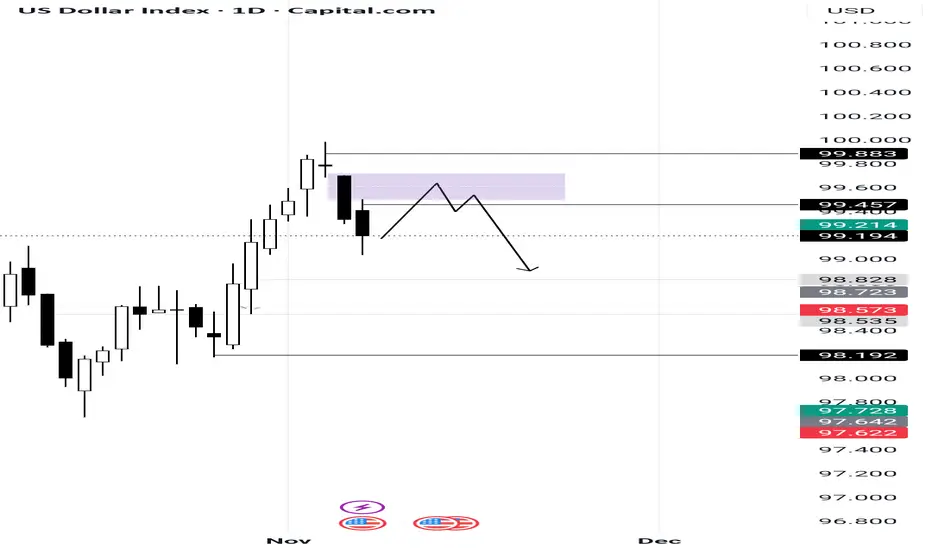
The dollar index has closed sharply into the weekly range and has formed a daily swing point and a strong rejection candle on the weekly time frame. I am expecting dollar to retrace to the bearish daily fair value gap and continue lower.
I recommend you to -
1. Maintain your risk
2. S
DOLLAR INDEX MAY PUSH DOWN GOLDDollar Index looks strong
1 -- Strong on 1D and 12H.
2 -- A Big Rounding Bottom under manufacturing.
3 -- Buy on Dips type setup .
4 -- RSI and MACD also supportive .
If Dollar index rise then Gold may give corrective move. Gold also in consolidation after
correction. but gold can give further d

technical analysis of the chart you shared (U.S. Dollar IndexCurrent Price: 100.112
Bias: Bullish short-term
Timeframe: 15-min
The chart shows a clear bullish structure with higher highs and higher lows forming. The price recently bounced from a minor support zone around the 100.00 level and is showing momentum to the upside.
📊 Key Levels
Support Level:

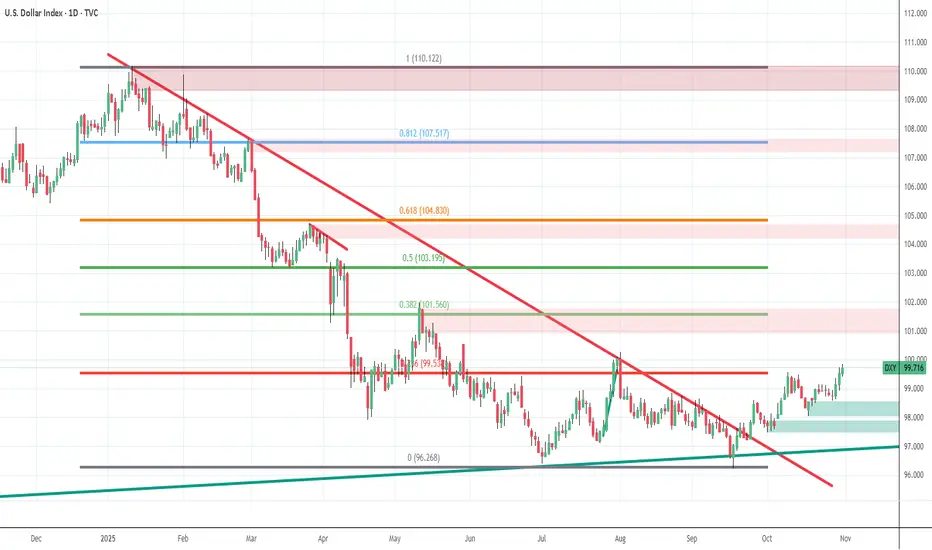
$ Index - view and analysis$ Indec has clearly taken monthly month trend line support and slowly moving up.
Its could be just technical move and i am not aware of any reason for US dollar and this index to move up. Only solution for US Govt to stop shut down is only lifting limit and print more fiat currency. After the news

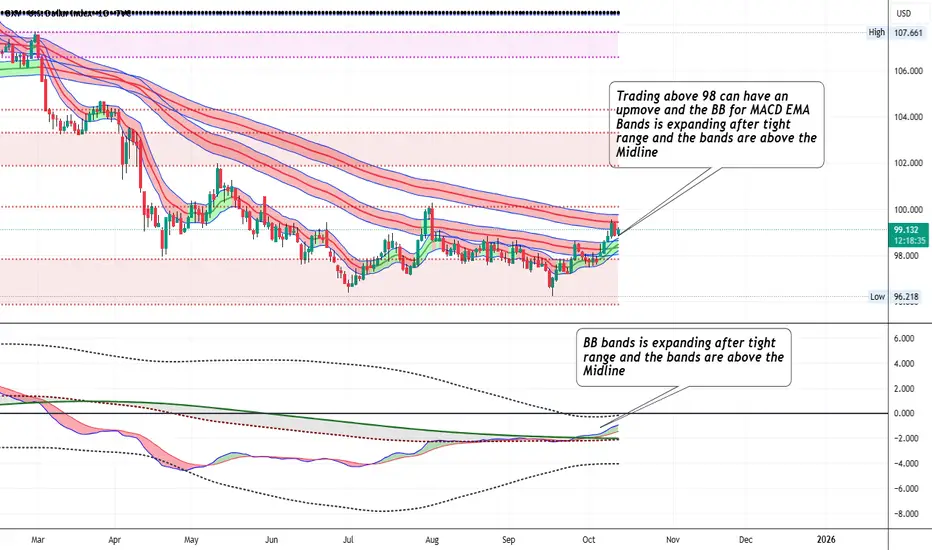
DXY - Trading above 98 can have an upmoveTrading above 98 can have an upmove and the BB for MACD EMA Bands is expanding after tight range and the bands are above the Midline
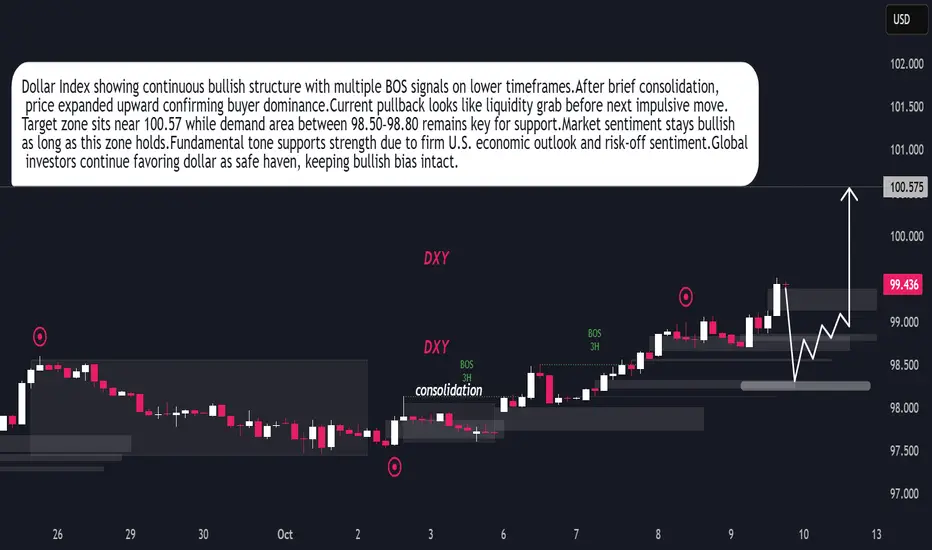
DXY Ready for Next Bullish Leg After Liquidity SweepDollar Index maintaining bullish structure after recent BOS on 3H timeframe.Market formed consolidation phase early October before expansion.Buyers showing control pushing price towards 100.57 objective.Current retracement indicates liquidity grab before next bullish impulse.Demand zone 98.50–98.80
See all ideas
Displays a symbol's price movements over previous years to identify recurring trends.
Frequently Asked Questions
USD Index (USX) / US Dollar reached its highest quote on Sep 28, 2022 — 114.743 USD. See more data on the USD Index (USX) / US Dollar chart.
The lowest ever quote of USD Index (USX) / US Dollar is 89.163 USD. It was reached on Jan 6, 2021. See more data on the USD Index (USX) / US Dollar chart.
USD Index (USX) / US Dollar is just a number that lets you track performance of the instruments comprising the index, so you can't invest in it directly. But you can buy USD Index (USX) / US Dollar futures or funds or invest in its components.