EGLDUSDT: Breakout Imminent or Breakdown Risk?Yello, Paradisers! Is EGLDUSDT gearing up for a big breakout or are we in for another setback? Let’s dive into the technicals to see what's at play.
💎EGLDUSDT has recently formed a descending triangle pattern accompanied by bullish divergence, showing promising signs with a W-shaped bounce from the support zone. But here’s the key: if EGLDUSDT can break above the resistance trendline of this descending triangle and breach the immediate resistance zone, the probability of a significant bullish move rises sharply.
💎However, we can’t ignore the possibility of a retracement. In such a case, it’s wise to watch for a bounce from the support zone. To confirm this potential move, keep an eye out for a bullish I-CHoCH (internal change of character) in lower time frames—this will increase the odds in our favor. It’s also essential to monitor BTC’s price action for added context and better strategic decisions.
💎On the flip side, should the price break down and closes candle below the support zone, it would invalidate our bullish thesis. In this scenario, patience is key—it’s best to step back and wait for clearer price action before re-entering.
🎖 Remember, disciplined analysis and strategy make all the difference. Stay sharp, Paradisers!
MyCryptoParadise
iFeel the success🌴
EGLDUST.P trade ideas

Bullish Momentum Building with Inverse Head and Shoulders💎 EGLD has formed an inverse head and shoulders pattern within a support zone, aligning with its overall bullish trend. Additionally, CHoCH (Change of Character) and BOS (Breakout Sign) signals have been observed on the price chart, further enhancing the likelihood of a bullish move following a breakout above the resistance level or the neckline of the inverse head and shoulders pattern.
💎A pullback to the Bullish OB level could serve as a potential bounce point, particularly as it aligns with the Fibonacci 0.618 level.
💎However, if EGLDUSDT falls below the support zone, it would signify a bearish structure, potentially leading to downward movement in the price

Imbalance $65 | Short BiasOn day chart
ELGD has created imbalance around $65. Besides, ELGD's in consolidation phase $48 - 60
The previous signal when ELGD closed below $55 that is signal for reversing if price can't close above $73
So I think ELGD pullback to higher then drop to Golden Ratio at $40
Wait for next move

Crypto Chart EGLDTHis is Giving Breakout and chart Lookin
g Bullish and For this You Can Enter Here
with the Price of 46.95
You need to make SL of 41
WIth Target of 49 - 52- 55- 60
Take Risk as per Your Capital U can Take This into Spot or Either Leverage on Crypto Exchanges
#CRYPTO # egld #SWINGTRADING

EGLD Price PredictionEGLD Price should go around 160 by April 2024, As per Falling wedge pattern from current price that is 23 it will reach 7x in next 7 months.

EGLD 120 Days PredictionEGLD Price Prediction for next 120 Days, It is creating a falling wedge pattern since January 2021, in a weekly chart.

EGLD/USDT Alert: Wedge Pattern Sparks Bullish Momentum!💎 Hey Paradisers, let's explore EGLD/USDT. Zooming in on the daily chart, a falling wedge pattern has emerged over time. Right now, it's getting closer to a strong support trendline, and a noticeable bullish MACD divergence is in play.
💎 If EGLD/USDT stabilizes on this support line and breaks the 29.82 level, we might be gearing up for an exciting bullish momentum. Potential targets? Our sights are set on resistance at 33.64 and maybe even 36.31. Interestingly, a bounce from the support could catch rookie short traders off-guard. Those who shorted at the previous low might get trapped, and as the price climbs past their entry points, triggering their stop losses, we could witness a bullish surge.
💎Stay alert and trade smart, ParadiseSquad!

LONG EGLDIf BTC Plays well.. we can see this rise easily..
I've dumped some USDT in this. Hope it greens :D


💡Don't miss the great buy opportunity in EGLDUSD @ElrondNetworkTrading suggestion:
". There is a possibility of temporary retracement to the suggested support line (51.34).
. if so, traders can set orders based on Price Action and expect to reach short-term targets."
Technical analysis:
. EGLDUSDT is in an uptrend, and the continuation of the uptrend is expected.
. The price is above the 21-Day WEMA, which acts as a dynamic support.
. The RSI is at 72.
Take Profits:
TP1= @ 56.83
TP2= @ 59.33
TP3= @ 62.51
TP4= @ 66.09
TP5= @ 69.42
SL= Break below S2
❤️ If you find this helpful and want more FREE forecasts in TradingView
. . . . . Please show your support back,
. . . . . . . . Hit the 👍 LIKE button,
. . . . . . . . . . Drop some feedback below in the comment!
❤️ Your support is very much 🙏 appreciated!❤️
💎 Want us to help you become a better Forex / Crypto trader?
Now, It's your turn!
Be sure to leave a comment; let us know how you see this opportunity and forecast.
Trade well, ❤️
ForecastCity English Support Team ❤️

EGLDUSDT GO LONGEGLDUSDT Take Long at Live Price 60.30
Target and Stop Loss given in the chart
Happy Trading


💡Don't miss the great buy opportunity in EGLDUSD @ElrondNetworkTrading suggestion:
". There is a possibility of temporary retracement to the suggested support line (49.43).
. if so, traders can set orders based on Price Action and expect to reach short-term targets."
Technical analysis:
. EGLDUSD is in a range bound, and the beginning of an uptrend is expected.
. The price is above the 21-Day WEMA, which acts as a dynamic support.
. The RSI is at 70.
Take Profits:
TP1= @ 65.47
TP2= @ 74.53
TP3= @ 87.24
TP4= @ 96.06
TP5= @ 103.42
SL= Break below S2
❤️ If you find this helpful and want more FREE forecasts in TradingView
. . . . . Please show your support back,
. . . . . . . . Hit the 👍 LIKE button,
. . . . . . . . . . Drop some feedback below in the comment!
❤️ Your support is very much 🙏 appreciated!❤️
💎 Want us to help you become a better Forex / Crypto trader?
Now, It's your turn!
Be sure to leave a comment; let us know how you see this opportunity and forecast.
Trade well, ❤️
ForecastCity English Support Team ❤️

Trade setup In EGLDUSDTAscending Channel Type Formed in EGLD/USDT on 1hr Timeframe.
Sell Setup- After Breakdown Of the channel by red candles, after some red candles if any green candle forms and which will be followed by more red candle breaking the low of previous green candle, that will be the point of our SHORT Entry.

Intraday ShortEGLD USDT Buy at Cmp 92.80
Target 98.25
Stop Loss 89.80
Leverage 10x
Investment 625 USDT

Egld Analysis with falling wedge pattern in 4 hr TFEgld Analysis with falling wedge pattern in 4 hr TF, its a neutral pattern that's mean it will break any side,.

💡Don't miss the great buy opportunity in EGLDUSD @ElrondNetwork
Trading suggestion:
". There is a possibility of temporary retracement to the suggested support line (157.72).
. if so, traders can set orders based on Price Action and expect to reach short-term targets."
Technical analysis:
. EGLDUSD is in a range bound, and the beginning of an uptrend is expected.
. The price is below the 21-Day WEMA, which acts as a dynamic resistance.
. The RSI is at 59
Take Profits:
TP1= @ 171.38
TP2= @ 182.99
TP3= @ 196.86
TP4= @ 214.65
TP5= @ 231.65
SL= Break below S2
❤️ If you find this helpful and want more FREE forecasts in TradingView
. . . . . Please show your support back,
. . . . . . . . Hit the 👍 LIKE button,
. . . . . . . . . . Drop some feedback below in the comment!
❤️ Your support is very much 🙏 appreciated! ❤️
💎 Want us to help you become a better Forex / Crypto trader ?
Now, It's your turn !
Be sure to leave a comment; let us know how you see this opportunity and forecast.
Trade well, ❤️
ForecastCity English Support Team ❤️

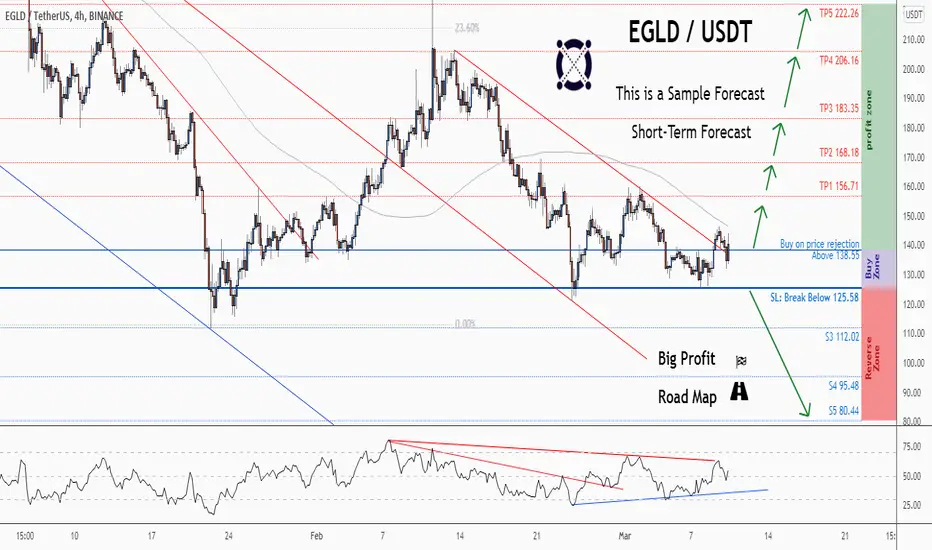
💡Don't miss the great buy opportunity in EGLDUSD @ElrondNetwork
Trading suggestion:
". There is a possibility of temporary retracement to the suggested support line (138.55).
. if so, traders can set orders based on Price Action and expect to reach short-term targets."
Technical analysis:
. EGLDUSD is in a range bound, and the beginning of an uptrend is expected.
. The price is below the 21-Day WEMA, which acts as a dynamic resistance.
. The RSI is at 55.
Take Profits:
TP1= @ 156.71
TP2= @ 168.18
TP3= @ 183.35
TP4= @ 206.16
TP5= @ 222.26
SL= Break below S2
❤️ If you find this helpful and want more FREE forecasts in TradingView
. . . . . Please show your support back,
. . . . . . . . Hit the 👍 LIKE button,
. . . . . . . . . . Drop some feedback below in the comment!
❤️ Your support is very much 🙏 appreciated! ❤️
💎 Want us to help you become a better Forex / Crypto trader ?
Now, It's your turn !
Be sure to leave a comment; let us know how you see this opportunity and forecast.
Trade well, ❤️
ForecastCity English Support Team ❤️
💡Don't miss the great buy opportunity in EGLDUSD @ElrondNetwork
Trading suggestion:
". There is a possibility of temporary retracement to the suggested support line (145.02).
. if so, traders can set orders based on Price Action and expect to reach short-term targets."
Technical analysis:
. EGLDUSD is in a range bound, and the beginning of an uptrend is expected.
. The price is above the 21-Day WEMA, which acts as a dynamic support.
. The RSI is at 63.
Take Profits:
TP1= @ 160.15
TP2= @ 183.35
TP3= @ 206.16
TP4= @ 222.26
TP5= @ 254.37
SL= Break below S2
❤️ If you find this helpful and want more FREE forecasts in TradingView
. . . . . Please show your support back,
. . . . . . . . Hit the 👍 LIKE button,
. . . . . . . . . . Drop some feedback below in the comment!
❤️ Your support is very much 🙏 appreciated! ❤️
💎 Want us to help you become a better Forex / Crypto trader ?
Now, It's your turn !
Be sure to leave a comment; let us know how you see this opportunity and forecast.
Trade well, ❤️
ForecastCity English Support Team ❤️

EGLD LONG EASY 40% PROFITBroke falling wedge and at strong resistance closing above 181 long target mentioned.
RSI,MACD STOCHASTIC RSI ALL BULLISH.
[ BINANCE:EGLDUSDTPERP

SUCCESFULL BREAKOUT ???????EGLD just break the descending triangle in the 1 hourly time frame ang got rejection from the previous resistance point ,after the retest it will again try to break the resistance area . if this will happen, EGLD WILL REACH THE $160 AREA.

IT" DOUBLE BOTTOM..... $160 ???In the 4 hourly chart, EGLD formed double bottom pattern..
no. 1 - BREAK the $134 area.
no. 2,3,4 - RETEST multiple time.
no. 5 - got REJECTION from previous resistance.
if egld price is above the $142 area then we will see EGLD near aprox the $160 otherwise it again retest the $136 area in the immediate short term......
