ETHUSD Harmonic Pattern AnalysisPattern Analysis
• The chart identifies a possible harmonic pattern (likely a Bat or Gartley) with labeled points X, A, B, C, and a projected D.
• Crucial level noted at USD, referred to as “Eye of the Harmonic,” representing a significant support/resistance.
• The chart suggests, “Harmonic D can be Tested if pt B Breaks,” implying bearish potential if the price drops below point B.
• Current ETHUSD price is 4,336, with a recent decline of about 3.88%, and visible moving averages providing trend context.
Key Technical Points
• Swing trading setup: Uses harmonic pattern recognition for potential entry/exit decisions.
• Resistance & Support zones: Eye of the Harmonic ( USD) and potential future support region near projected point D ( USD).
• Indicators: The chart overlays zone levels, moving averages, and pattern ratios (e.g., 0.523, 0.785, 1.194, 1.419), which are standard in harmonic pattern calculations.
Potential Scenario
• If price breaks below point B, traders may target the level indicated by point D for possible support or reversal opportunities.
• The scenario implies caution for long positions until the price confirms support above crucial harmonic levels.
Trade ideas

ETH HnSA Head N Shoulder is being made in ETH in 4hr tf. It is also break a rising trendline support.
Entry- 4395-4400
SL- 4550
Target- One can look to book after one is to one or can also target the recent low it made that is 4200.
Disclaimer- This is just for educational purpose. Please take advice before making any decision.
Jai Shree Ram.

ETHUSD is ready to reach 4640 nowAs price analysis ETHUSD is ready to reach 4640 with in hours from now as per research on its bottom made at 4311 .
This not a trading advise. Only for education purpose.

ETH Buy at perfect zone.ETH Buy scenario at perfect zone. ETH is creating a perfect scenario for buy on 4H TF.
1. Price is at support, FVG and OB confluence in premium zone at OTE.
2. Also showing rejection in price action.
3. Trend line is faked out.
P.S. - it is just analysis not any trade recommendation.

ETH short trade plan on 15 minEth is down, Fell good during NY session, a small bounce inviting Cheap buyers to get in and get a higher fill for shorts.
when 50 ema is trending all bounces towards the 50 ema + failure should be considered shorts
For long: let it cross + dip + continuation then buy

Bearish Trade Setup for ETH/USDOverview:
The setup for this trade is based on a bearish outlook for Ethereum (ETH) against the US Dollar (USD) on the 1-hour chart. The entry, stop loss, and take profit levels are carefully defined to provide a balanced risk-to-reward ratio. Here's why this setup is a solid trade idea:
1. Trade Entry:
Entry Price: 4574.87
The entry point is set based on a recent price retracement within the prevailing downtrend. The price has shown signs of rejection from key resistance levels, and the trade is positioned to capitalize on further downside momentum.
2. Target Price:
Target Price: 4241.87
The target level is derived from technical analysis, where price is expected to move toward previous support levels, presenting a logical exit point for profits.
3. Stop Loss:
Stop Loss Price: 4741.37
The stop loss is placed above recent swing highs, ensuring the trade has enough room to breathe while minimizing the risk of false breakouts. This level is a protective measure to ensure that a reversal or unexpected price movement does not lead to unnecessary losses.
4. Risk-to-Reward Ratio:
RRR: The trade has an acceptable risk-to-reward ratio, where the potential reward outweighs the risk by more than 1:1. This is crucial for maintaining profitability over the long term.
5. Trend Analysis:
The market is currently in a bearish phase, as seen in the price action and the overall downtrend. The setup capitalizes on this momentum with a proper risk management strategy.
The use of indicators like moving averages can further confirm the downtrend, though they are not displayed here, they should align with the bearish trend.
6. Volume Confirmation:
The volume should ideally be decreasing during the retracement phase and increase during the move towards the target price, confirming the bearish continuation.
7. Conclusion:
This trade is well-positioned to take advantage of a continuation of the bearish trend. The entry, stop loss, and target are all logically placed based on key price levels and risk management principles. As always, ensure to monitor the trade, and be ready to adjust if market conditions change unexpectedly.

LONG ETH for 5000$ETH showing signs of Inside bar on daily timeframe. LONG here for a 5000$+ target.

ETHUSD | Technical Analysis 25/08/2025Hi,
ETH can form inverted head and should and go upside upto 5100+. Time period can be 4 to 5 days.
Disclaimer: This is only for educational purpose.
Thanks

ETH BigBOEntry- 4555-4545
Targets- All time High
SL- 4465 (FIb Levels)
Reason- After a big volume candle near all time high ETH made a retracement and from here it can continue its upside journey towards all time high and 5050 Levels. Entry is being made in Fib Golden zone level which has been made in bigger tf that is daily tf and entry in taken in the shorter tf that is 1 hr tf.
Disclaimer- This is just for educational purpose.
Jai Shree Ram

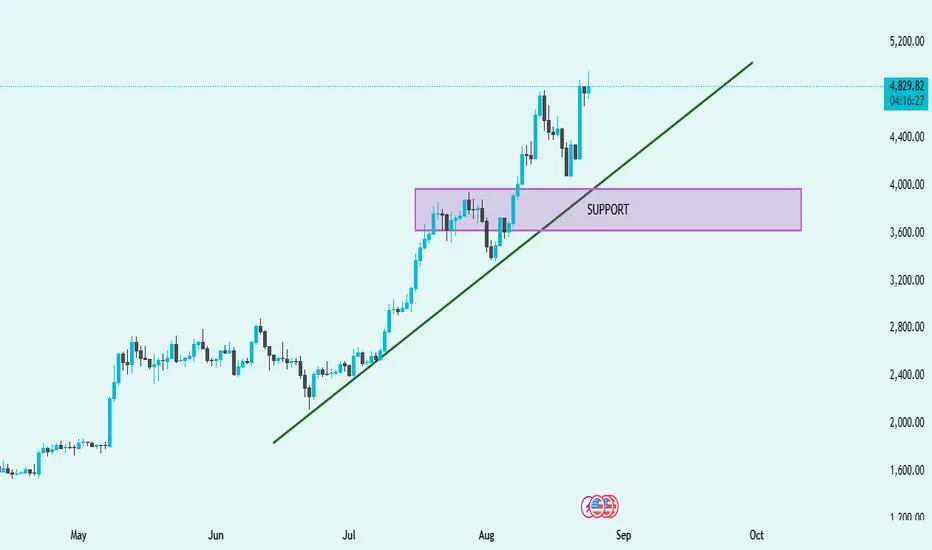
ETH/USD Technical Analysis – Strong Uptrend with Key Support📈 ETH/USD Technical Analysis – Strong Uptrend with Key Support
Trend Direction ➡️
The chart shows a clear bullish trend supported by an upward sloping trendline (green). Price action is consistently forming higher highs and higher lows, confirming strong upward momentum.
Support Zone 🟪
The highlighted support area (3,600 – 4,000) has been tested successfully. Price bounced strongly from this zone, showing buyers are actively defending this level.
Breakout & Momentum 🚀
After retesting support, ETH broke above the recent consolidation and is now trading around 4,843, pushing towards new highs. This signals bullish continuation if volume supports the move.
Trendline Confirmation 📐
The trendline has acted as a dynamic support multiple times. As long as ETH trades above it, the bullish trend remains intact.
Outlook 🔮
If ETH stays above 4,800, the next potential target could be 5,200+.
If price breaks below the trendline and the 3,600 support zone, bearish correction may begin.
✅ Summary: ETH is in a strong bullish trend 🚀, supported by both the trendline and key support zone. Short-term outlook remains bullish as long as 4,800 holds.
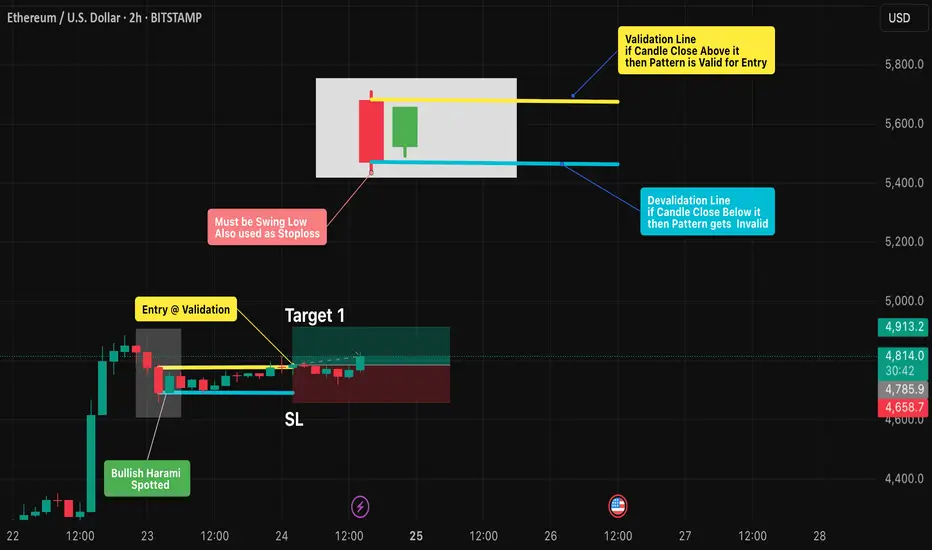
Bullish Harami Pattern: Spotting Reversals with DisciplineIntro / Overview
The Bullish Harami is a candlestick reversal pattern that often forms at the end of a downtrend.
It signals a possible shift where sellers weaken and buyers begin to step in.
The first candle’s low must be a swing low , and this level can also be used as a stop-loss reference.
To trade it effectively, spotting the formation is not enough — strict validation and invalidation rules are key to avoid false signals.
✨ Concept
A Bullish Harami is a two-candle pattern:
- First candle (Red🔴): A strong bearish candle showing seller dominance (swing low).
- Second candle (Green🟢): A smaller bullish candle whose body is fully inside the prior red candle’s body (wicks ideally inside).
This forms the “harami” structure, where the green candle looks like it is “inside the red candle,” suggesting a pause in bearish pressure and potential reversal.
📖 How to Use
1️⃣ Identify the pattern: Look for a large red candle followed by a smaller green candle contained within it.
2️⃣ Validation Point: The setup is validated if price closes above the open of the red candle within the next few candles.
3️⃣ Invalidation Point: The setup is invalidated if price closes below the close of the red candle before validation occurs.
4️⃣ Stop-Loss & Targets:
- Stop-loss (SL): Place at or just below the swing low (first red candle low).
- Target (TP): 1x, 2x, or more times the distance between entry and stop-loss.
5️⃣ Enhance Reliability: Combine with support levels, trendlines, moving averages, or other candlestick signals to filter out weak setups.
📊 Chart Explanation – Step by Step
✔ The Bullish Harami pattern was spotted after a clear downtrend.
✔ The following candle closed above the red candle’s open → Validation confirmed ✅ .
✔ A long entry was taken on the same candle.
✔ The Bullish Harami pattern has also been drawn and highlighted on the chart.
🔍 Observation
- If Target 1 is achieved → book 2 lots , and trail the remaining position with a stop-loss.
- Harami is only a potential reversal → confirmation is necessary.
- Breakout above the red candle’s open = buyers in control 🟢.
- Breakdown below the red candle’s close = setup failure ❌.
- Patience is key — wait for confirmation before entering.
📌 Why It Matters?
The Bullish Harami helps traders by:
- Reducing false reversal trades with strict rules.
- Providing clear entry/exit levels with discipline.
- Enforcing risk management via pre-defined SL & TP.
✅ Conclusion
The Bullish Harami becomes powerful when traded with discipline.
By marking the open and close of the red candle, traders can clearly separate a valid long trade from a failed setup.
With a stop-loss at the swing low and take-profits at 1x, 2x, or more, while trailing further lots, the Harami offers a structured, rule-based strategy.
⚠️ Always remember: the pattern shows possibility → price confirmation makes it probability .
⚠️ Disclaimer
For educational purposes only · Not SEBI registered · Not a buy/sell recommendation · No investment advice — purely a learning resource
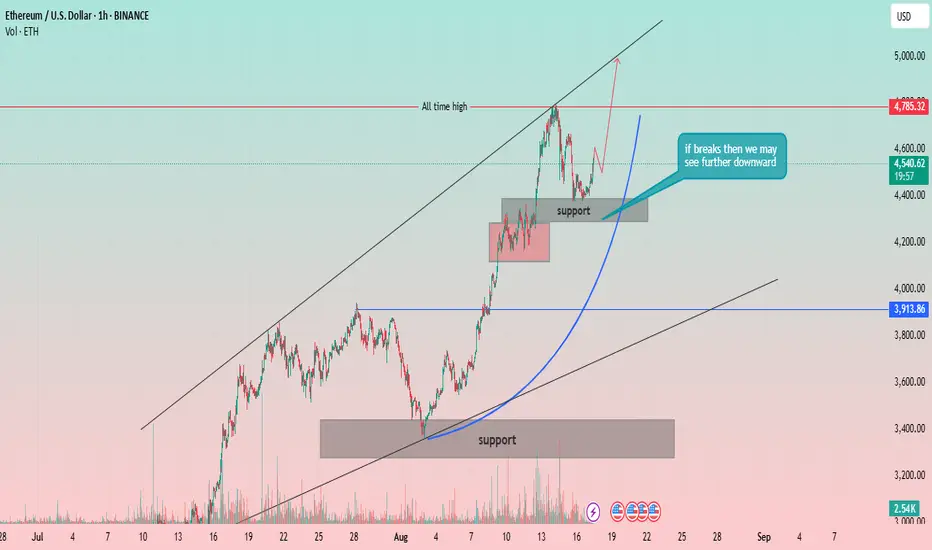
Ethereum (ETH) 1H Chart: Re-testing the All-Time High?Strong Uptrend Channel: The price of Ethereum has been moving within a well-defined ascending channel, indicated by two parallel black trendlines. This strong channel suggests a sustained bullish momentum.
All-Time High: A significant resistance level is marked as the "all-time high" at approximately 4,785.32 USD. The price has recently tested this level.
Support Levels:
Major Support Zone: A broad support zone is identified between approximately 3,300 USD and 3,450 USD. This zone has previously acted as a strong base for a price rally.
Recent Support Zone: A smaller, more recent support zone is marked around 4,200 USD. The price has consolidated within this area after its recent push towards the all-time high.
Price Action and Projections:
The price recently reached a peak near the all-time high and has since pulled back, consolidating within the recent support zone.
A key annotation states, "if breaks then we may see further downward." This highlights the importance of the 4,200 USD support zone. A break below this level could indicate a potential deeper retracement, possibly towards the lower trendline of the channel or the major support zone.
A parabolic arc is drawn (blue line), suggesting a potential trajectory for the price to continue its move higher from the current level, with a goal of re-testing or breaking the all-time high.
Volume: The chart includes a volume indicator, showing significant volume spikes during the major rallies and drops, confirming strong market interest and participation.
Ethereum (ETH/USD) – 4H Chart AnalysisETH is currently trading at $4,717 after a sharp breakout above the descending trendline (red). The move shows strong bullish momentum, taking price back into a critical resistance zone.
Key levels to watch:
🔴 Resistance: $4,718 – $4,879
🟢 Support: $4,098 / $3,900 / $3,700
The RSI (14) stands at 68.76, close to overbought levels, which could suggest short-term exhaustion if buyers fail to sustain momentum.
📌 Bullish Scenario: A breakout and hold above $4,880 could open the door for continuation toward $5,000+.
📌 Bearish Scenario: If resistance holds, ETH may retrace toward $4,100 – $4,000 before attempting another leg up.
⚖️ Outlook: Ethereum has reclaimed strong momentum, but a confirmation above $4,880 is key to validating a bullish continuation.

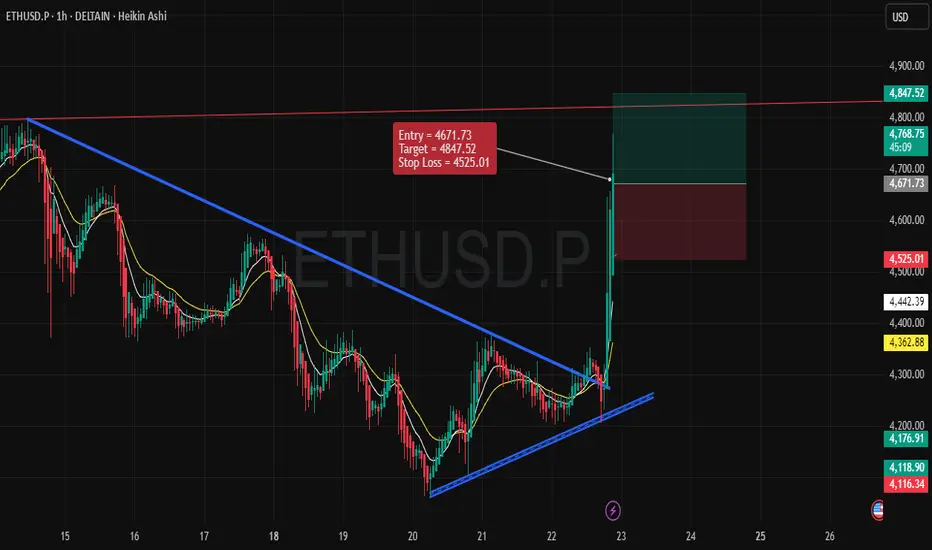
Bullish Scenario for ETH/USD (1-Hour Time Frame)Entry Point: 4671.73
Stop Loss: 4525.01
Target (Take Profit): 4847.52
1. Price Structure and Trend:
The price has been moving within a well-defined downtrend, but there has been a noticeable shift. The recent breakout above the blue trendline signals a potential reversal from a bearish to a bullish trend.
This breakout indicates increased buying interest, suggesting that ETH/USD might continue its upward momentum in the short term.
2. Key Levels:
Support Level: The price has recently bounced off a support zone near 4525, which acts as the stop loss level. A strong bounce from this point further validates the bullish outlook.
Resistance Level: The target price of 4847.52 is placed near a resistance zone, which represents the next major hurdle for ETH/USD.
3. Entry Strategy:
The entry point is placed at 4671.73, just after the breakout above the blue trendline, where the price is gaining upward momentum.
The market seems to have found new buying strength after consolidating, which strengthens the case for a potential move to the target level.
4. Risk-to-Reward Ratio (RRR):
The risk-to-reward ratio for this trade is favorable, with a potential gain of around 175 points (4847.52 - 4671.73) against a risk of approximately 146.72 points (4671.73 - 4525.01). This results in a solid 1:1.2 RRR, which is a reasonable expectation for this bullish trade.
5. Indicators and Confirmation:
The chart features moving averages (yellow and white lines) indicating a shift from a bearish trend to a bullish phase.
The price action shows strong buying pressure, especially with the recent candlestick pattern, confirming the breakout and trend continuation.
6. Conclusion:
With a confirmed breakout, an entry at 4671.73 offers a great opportunity for a bullish move towards the target of 4847.52. The stop loss is safely placed at 4525.01, considering recent support.
This trade setup appears well-aligned with the current market conditions and technical indicators, making it a logical and worthwhile trade idea.
Eth s targets for sureEthereum 's targets for sure
Logarithmic history has certain basic growth factors , as per the logarithmic growth eth is just starting
Atleast 600% - 630% from the recent deep dip will be there

ETHUSD BUYBUY @4095.17
SL @4062.23
TP @4259.87
If SL hits by a candle sweep and closed above the entry level again buy....
And always risk 1%

Ethereum still more fall possible no buy Signal yet on harmonic Ethereum still sell on rise more downside possible avoid any buy trade at current price.
Support area : 4250-4210 , 4090-4065 , 3915-3860
Resistance area : 4420-4460, 4555-4615, 4780
How My Harmonic pattern projection Indicator work is explained below :
Recent High or Low :
D-0% is our recent low or high
Profit booking zone ( Early / Risky entry) : D 11.8% -D 16.1 % is
range if break them profit booking start on uptrend or downtrend but only profit booking, trend not changed
SL reversal zone (Safe entry ) : SL 23% and SL 25% is reversal zone if break then trend reverse and we can take reverse trade
Target : T1, T2, T3, T4 and .
Are our Target zone
Any Upside or downside level will activate only if break 1st level then 2nd will be active if break 2nd then 3rd will be active.
Total we have 7 important level which are support and resistance area
Until , 16% not break uptrend will continue if break then profit booking will start.
If break 25% then fresh downtrend will start then T1, T2,T3 will activate
1,3,5,10,15,20 minutes are short term levels.
30 minutes 60 minutes , 2 hours,3 hours, ... 1 day and 1 week chart positional and long term levels

ETHUSD Lowers High Formation After Recent Peak Eyes 4010📊 Key Observations:
Trend Shift: After peaking near 4,700, ETH rejected strongly with a caution signal at the top, marking a possible exhaustion zone.
Sell Signals: Multiple sell triggers emerged after the top, showing sellers defending resistance levels.
Liquidity Zone: Price is consolidating under the 4,434 – 4,480 area, which is acting as fresh resistance.
Moving Averages: Short-term averages have crossed downward, aligning with bearish momentum.
📉 Current Setup:
Entry region: Around 4,408 – 4,434 (resistance rejection area).
Target zone: 4,009 – 4,040 (highlighted objective area).
Stop level: Above 4,480 (recent supply zone).
🔎 Reasoning:
Lower highs are forming after the recent peak.
Strong sell presence above 4,400s.
Breakdown structure suggests continuation toward the 4,200 handle, with an extended target closer to 4,009.
Market caution markers confirm a potential trend reversal zone already formed earlier.
✅ETHUSD is in a bearish continuation phase unless bulls reclaim 4,480+. Watching the 4,200 and 4,009 levels as key downside objectives.
⚠️ Disclaimer:
This analysis is for educational purposes only and does not constitute financial advice. Always do your own research and manage risk before making trading decisions.

ETHUSD-Potential Reversal Eyes LongETHUSD declined into a previously tested support zone, triggering a new Buy signal from SignalPro.
Price is currently attempting to reclaim short-term structure but remains under EMA resistance.
The recent Sell signal failed to create a lower low, potentially signaling bearish exhaustion.
🔍 Educational Setup Observation:
Reclaim Zone: Near 3,790.00
Stop Reference: Below 3,744.71 (beneath structural low)
Target Zone: 4,223.47 — aligned with prior imbalance and resistance from previous high-volume node
If price can decisively reclaim above EMAs, momentum shift may accelerate.
⚠️ This analysis is for educational purposes only. It does not constitute financial advice. Always do your own analysis and apply proper risk management.

ETHUSD aiming for next Unbeatable TargetThis is the prediction of ETHUSD crrived on price action based on its daily chart , values considered from 9th April Breakout happened on daily chart., with a base price 1383. This is purely for education purposes. Please note this not a trading advise.

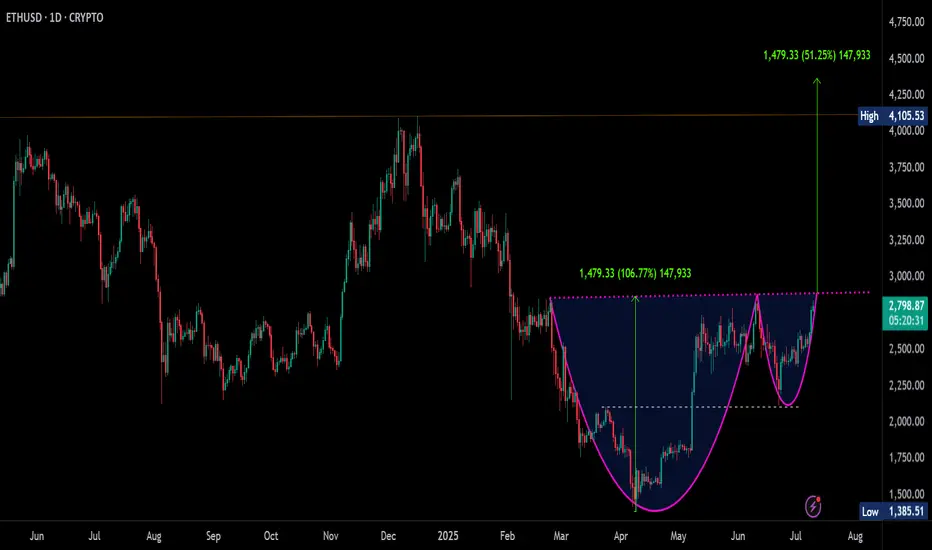
ETH Cup & Handle Pattern near BO - 51% Upside in sight!#ETH corrected from $4,105 and found strong support at $1,385, rebounding to form a classic Cup & Handle Pattern .
Handle Formation: Price retraced back to the breakout zone after the formation of cup.
🔔 Breakout Trigger: Watch for a daily close above $2,887 to confirm the breakout.
🎯 Pattern Target: $4,365, potential 51% upside from the breakout level.
#ETH is gearing up for a major move, breakout confirmation could ignite a strong rally.
#Ethereum #ETH #CupAndHandle #CryptoCharts #Altcoins #TechnicalAnalysis
ETH USDT - BUY PLAN FOR NEXT BIG MOVE🔶 ETHUSDT – The Buy Zone We’re Waiting For
Ethereum (ETH) is still trading above our ideal accumulation range, but smart traders are already preparing for when price enters the zone that offers maximum risk-reward potential.
---
🟢 Ideal Buy Zone (Pending)
Target Buy Range: $2,800 – $2,400
Stop Loss: Below $2,100 (Weekly candle close)
This is where Smart Money Concepts (SMC) align with higher-timeframe demand, creating a strong potential reversal area.
---
🎯 Take Profit Levels
TP1: $4,300
TP2: Trail the position if bullish momentum continues.
---
📊 Why This Matters Now
1. Preparation, Not Prediction: The zone hasn’t been tested yet — but it’s critical to mark it in advance.
2. SMC Logic: Deep discount + demand zone + potential 4H confirmation makes this area high probability.
3. Trade the Reaction: Entry only after 4H bullish confirmation (BOS/displacement from OB).
---
📌 Trading Approach
Watch ETH price action as it approaches the $2,800–$2,400 range.
Wait for lower-timeframe confirmation (4H) before committing capital.
Manage size according to volatility; SL placement below $2,100 keeps risk defined.
---
⚠️ Disclaimer: This is not financial advice. Market conditions can change rapidly — always use risk management.
---
Final Note:
The key here is patience — the market rewards those who prepare before the crowd notices. Mark the zone now and act only when price tells you it’s ready.

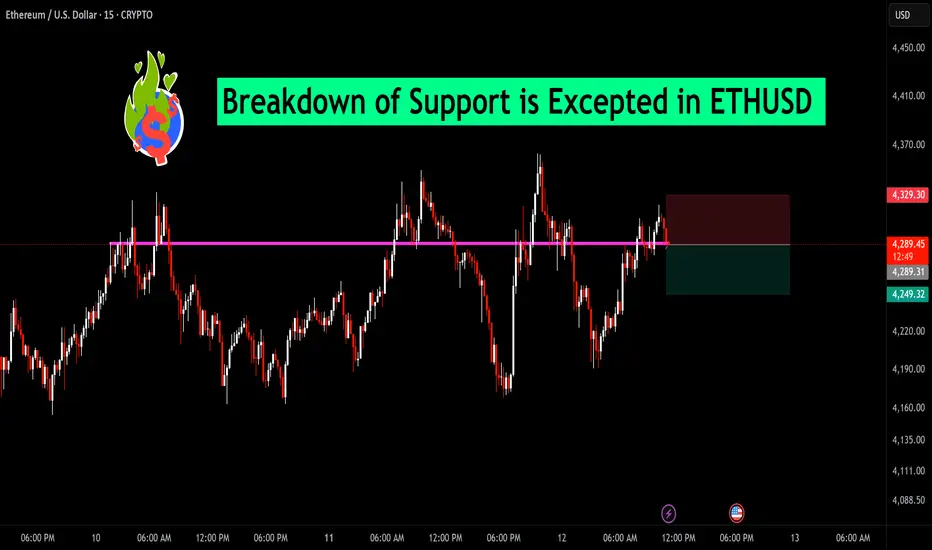
Breakdown of Support is Excepted in ETHUSD Ethereum is currently hovering just above a key horizontal support zone near $4,289. Price has tested this level multiple times, and selling pressure appears to be increasing. A decisive breakdown below this zone could trigger a short-term bearish move toward the next support near $4,249.
Traders should watch for a strong close below this support on the 15-min chart to confirm the breakdown. A tight stop above $4,329 could help manage risk for short positions.
Bias: Bearish below $4,289 | Bullish recovery only above $4,329