ETHUSD-Potential Reversal Eyes LongETHUSD declined into a previously tested support zone, triggering a new Buy signal from SignalPro.
Price is currently attempting to reclaim short-term structure but remains under EMA resistance.
The recent Sell signal failed to create a lower low, potentially signaling bearish exhaustion.
🔍 Educational Setup Observation:
Reclaim Zone: Near 3,790.00
Stop Reference: Below 3,744.71 (beneath structural low)
Target Zone: 4,223.47 — aligned with prior imbalance and resistance from previous high-volume node
If price can decisively reclaim above EMAs, momentum shift may accelerate.
⚠️ This analysis is for educational purposes only. It does not constitute financial advice. Always do your own analysis and apply proper risk management.
Trade ideas

ETHUSD aiming for next Unbeatable TargetThis is the prediction of ETHUSD crrived on price action based on its daily chart , values considered from 9th April Breakout happened on daily chart., with a base price 1383. This is purely for education purposes. Please note this not a trading advise.

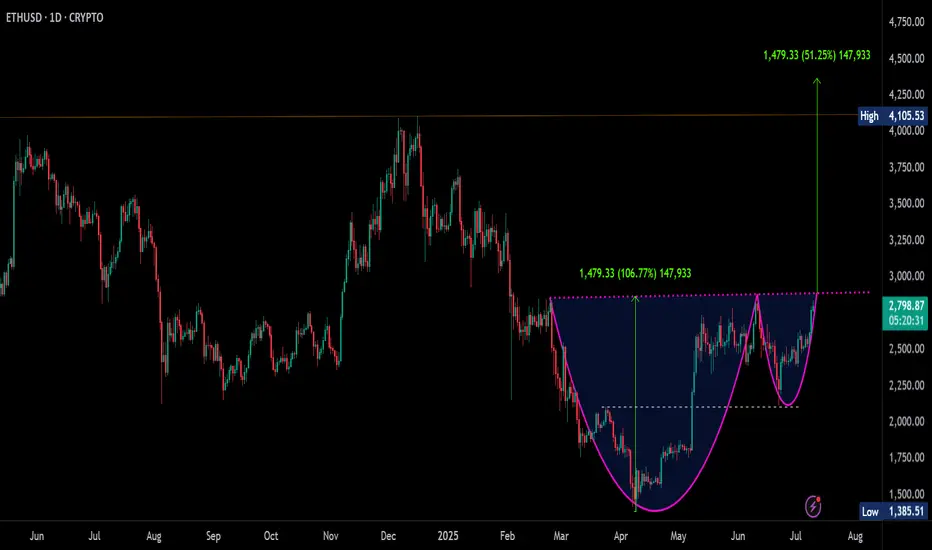
ETH Cup & Handle Pattern near BO - 51% Upside in sight!#ETH corrected from $4,105 and found strong support at $1,385, rebounding to form a classic Cup & Handle Pattern .
Handle Formation: Price retraced back to the breakout zone after the formation of cup.
🔔 Breakout Trigger: Watch for a daily close above $2,887 to confirm the breakout.
🎯 Pattern Target: $4,365, potential 51% upside from the breakout level.
#ETH is gearing up for a major move, breakout confirmation could ignite a strong rally.
#Ethereum #ETH #CupAndHandle #CryptoCharts #Altcoins #TechnicalAnalysis
ETH USDT - BUY PLAN FOR NEXT BIG MOVE🔶 ETHUSDT – The Buy Zone We’re Waiting For
Ethereum (ETH) is still trading above our ideal accumulation range, but smart traders are already preparing for when price enters the zone that offers maximum risk-reward potential.
---
🟢 Ideal Buy Zone (Pending)
Target Buy Range: $2,800 – $2,400
Stop Loss: Below $2,100 (Weekly candle close)
This is where Smart Money Concepts (SMC) align with higher-timeframe demand, creating a strong potential reversal area.
---
🎯 Take Profit Levels
TP1: $4,300
TP2: Trail the position if bullish momentum continues.
---
📊 Why This Matters Now
1. Preparation, Not Prediction: The zone hasn’t been tested yet — but it’s critical to mark it in advance.
2. SMC Logic: Deep discount + demand zone + potential 4H confirmation makes this area high probability.
3. Trade the Reaction: Entry only after 4H bullish confirmation (BOS/displacement from OB).
---
📌 Trading Approach
Watch ETH price action as it approaches the $2,800–$2,400 range.
Wait for lower-timeframe confirmation (4H) before committing capital.
Manage size according to volatility; SL placement below $2,100 keeps risk defined.
---
⚠️ Disclaimer: This is not financial advice. Market conditions can change rapidly — always use risk management.
---
Final Note:
The key here is patience — the market rewards those who prepare before the crowd notices. Mark the zone now and act only when price tells you it’s ready.

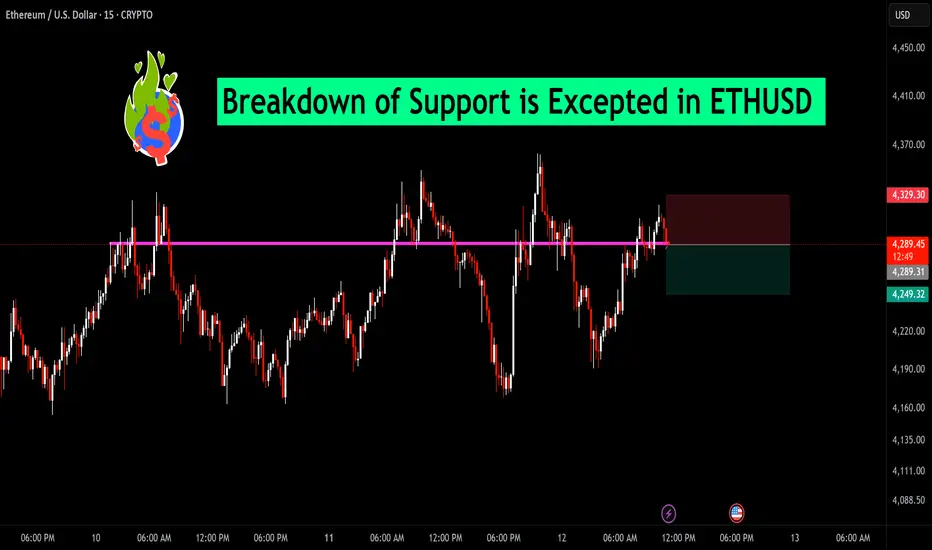
Breakdown of Support is Excepted in ETHUSD Ethereum is currently hovering just above a key horizontal support zone near $4,289. Price has tested this level multiple times, and selling pressure appears to be increasing. A decisive breakdown below this zone could trigger a short-term bearish move toward the next support near $4,249.
Traders should watch for a strong close below this support on the 15-min chart to confirm the breakdown. A tight stop above $4,329 could help manage risk for short positions.
Bias: Bearish below $4,289 | Bullish recovery only above $4,329
ETH 4H BreakoutTarget: 2860
SL: Lack of strength below breakout line.
Feels like BTCUSD also has one more push up to 113000 before the final dip.

ETHUSD | Technical Analysis 10/08/2025Hi,
ETH can create new all time high from 4195 to 4365+ (200% supply zone)
Disclaimer: This is only for educational purpose.
Thanks

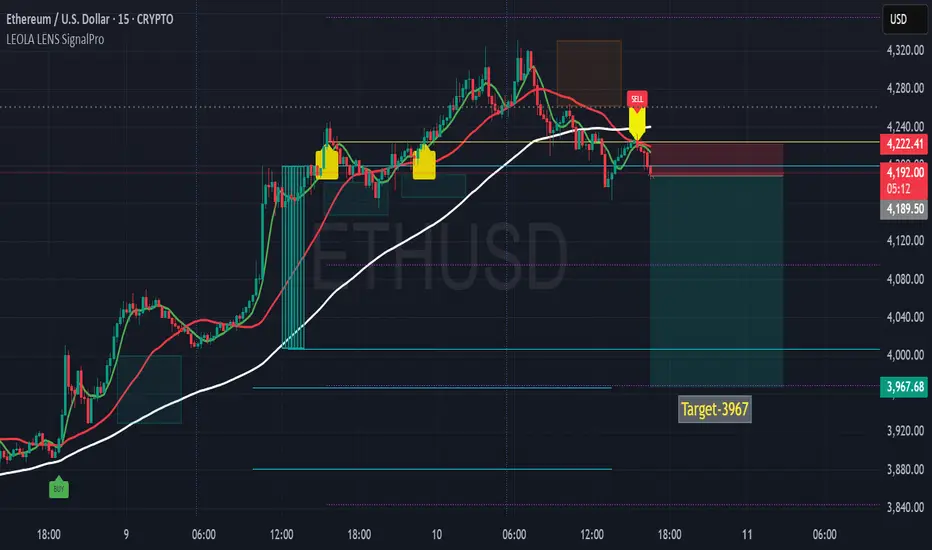
ETHUSD-15MIN SHORT Setup After Supply RejectionThis chart highlights a potential short trade opportunity on ETHUSD following rejection at the overhead supply zone.
Technical Notes:
Yellow caution markers signaled earlier high-probability trend shift points.
Price tested the zone near 4,240, where prior selling pressure emerged.
The recent SELL marker aligned with a break below the moving average, confirming bearish bias.
Liquidity levels below remain untested, offering a possible draw toward the 3,967 target.
Stop-loss placed above recent highs to maintain favorable risk-to-reward.
Bias: Bearish toward target area unless price reclaims and sustains above supply zone.
Disclaimer: This analysis is for educational purposes only and does not constitute financial advice. Trading and investing involve risk, and past performance is not indicative of future results. Always conduct your own research before making trading decisions.
ETHUSD EYES FOR LONG - Intraday ViewThis 15-minute chart on ETHUSD highlights a potential structure-aware reversal zone, guided by Leola Lens SignalPro overlays and trend context.
🔍 Technical Structure Highlights:
🟡 Caution Labels Active — Market is transitioning with signs of indecision. High-probability trend change zones are being tested.
🔻 Price remains below both the adaptive red and white base trendlines, signaling bearish pressure is still dominant.
🟥 Recent SELL signal held well, driving price lower into the Liquidity Control Box, which has now acted as a local support area.
🟢 Multiple attempts to reclaim structure are visible — but the price is still trading under key compression zone near $3,513.
🔁 What to Watch:
A clean break and hold above $3,513 could indicate a potential squeeze toward the $3,600–$3,720 zone.
Rejection from current levels could retest the base support near $3,455 or lower if trend resumes.
🧠 This chart is a visual study of structure, momentum, and reaction using Leola Lens SignalPro tools. All views are for educational purposes only. Trade safe.
#ETHUSD #Crypto #Ethereum #LeolaLens #PriceAction #SmartContext

Last liquidity sweep is my first entry for shortLast liquidity sweep is my first entry for short
Above I you can DCA It and the last liquidity sweep towards downside I am targeting for tp
Rest I will update
And rsi is oversold now 1H time frame don’t go all in one

ETH/USD (Ethereum vs USD) – Daily Chart AnalysisEthereum has pulled back sharply from recent highs and is now approaching a key ascending trendline that has supported the bullish move since early May. Price is hovering just above the dynamic support zone, and momentum seems to be weakening.
Key Technicals:
EMA 20 (green): $3,510
DEMA 50 (red): $3,607
Current Price: ~$3,438
Support Trendline: Near current price
Structure: Higher highs and higher lows still intact, but nearing inflection
Potential Scenarios:
Bullish Case: A bounce from the trendline and reclaim of the 20 EMA could revive bullish sentiment toward $3,700+.
Bearish Case: A breakdown below the ascending trendline and $3,400 level might signal deeper retracement toward $3,200 or $3,000.
📊 Monitor closely for reaction at the trendline. Watch for EMA crossovers or consolidation patterns to confirm the next move.

Ethereum sell recommended near 3840 downside maximum targets hitEthereum sell on rise recommended last week near 3840 downside maximum targets hit .
Updated levels given on chart . Start buying on dip near support area

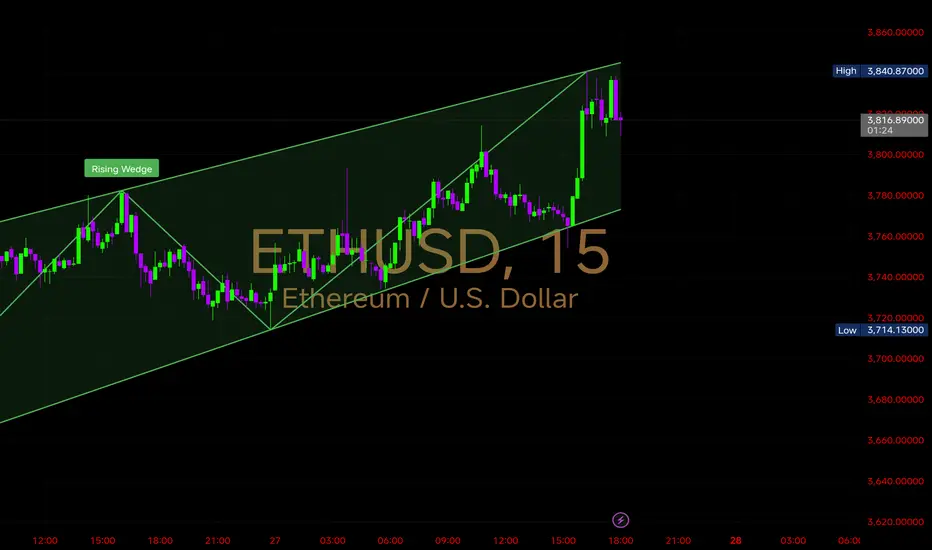
ETHUSD Bullish Setup – Trendline Support in Action Ethereum is currently respecting a rising trendline support on the 15-minute chart, indicating strong bullish interest near the $3,800 zone. The price has tested the trendline multiple times and is showing signs of a potential bounce.
🔹 Support Zone: Around $3,800
🔹 Immediate Target: $3,890+
🔹 Stop Loss: Below $3,717
🔹 Risk-Reward: Favorable for intraday/swing scalpers
The confluence of the trendline and price structure makes this an ideal setup for bulls looking to ride the next leg up. Confirmation on the next candle could trigger a solid long entry.
📊 Keep an eye on momentum and volume confirmation for safer execution.

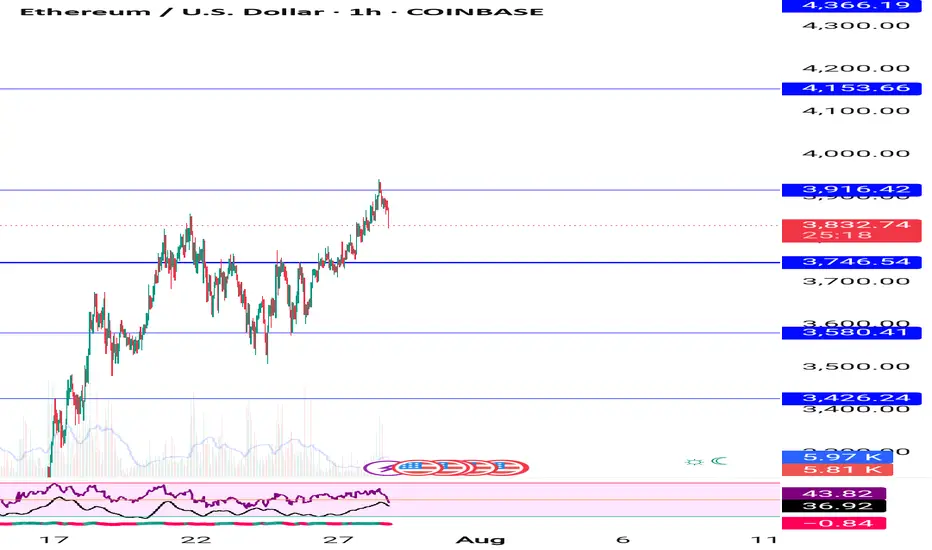
ETHUSD Bearish Setup – Trendline Retest in Action After a strong upward move, Ethereum (ETHUSD) gave a trendline breakout, but the momentum faded quickly near the resistance zone around $3,930–$3,940.
📉 Current Price Action Highlights:
The breakout was followed by low-volume candles, showing a lack of bullish strength.
Price is hovering back near the breakout trendline, hinting at a possible fakeout or retest failure.
Bears may look for shorting opportunities below $3,920, with a potential target near the $3,870–$3,860 zone.
Stop-loss can be placed above the breakout high near $3,980.

Ethereum as expected trying to make new ATH buy on dip at suportEthereum long term buying given many times near 1580-1600 at current price avoid huge quantity buying wait for dip near 2890-2900 then buy big quantity , levels mentioned on chart buy on dip near support
Trendline Breakout in ETHUSD – Watch for Momentum!Ethereum has successfully broken above a key descending trendline on the 15-minute chart, signaling a potential shift in short-term sentiment.
📈 Breakout Level: ~$3,829
🎯 Target Zone: ~$3,873
🛑 Stop Loss: Below ~$3,767
After several rejections along the resistance, ETH finally managed a clean breakout with a strong bullish candle. If it sustains above the trendline, we could see follow-through buying towards the upper zone.
🔍 Keep this setup on radar — a retest and bounce from the trendline could offer a high-probability entry.

$CETUS has formed a rising wedgeBINANCE:CETUSUSDT
$CETUS has formed a rising wedge on the 1D timeframe — a pattern that typically suggests potential trend exhaustion or a cooling phase ahead.
Price has rallied from the base of ~$0.09 to retest the wedge resistance near $0.1285.
However, candles are now compressing within the wedge, a sign of reduced buyer aggression.
🔼 Resistance : $0.1285 – $0.132
🔽 Support : $0.113 – $0.108
⚠️ Breakout Confirmation: Daily close above $0.132
⚠️ Breakdown Signal: Fall below $0.108 could shift sentiment short-term
A clean close above the wedge may ignite continuation toward the $0.14–$0.15 range, validating breakout momentum.
If resistance holds and volume fades, we may see a retest of lower wedge support or even a breakdown to previous demand zones.
#CETUS is at a critical decision point — while momentum remains bullish, the wedge’s nature demands caution.

#Ethereum has printed a rising wedge formation
BINANCE:ETHUSDT
#Ethereum has printed a rising wedge formation on the 1-hour timeframe — a pattern often seen near the end of impulsive moves, hinting at either a breakout continuation or a pullback trigger.
Price has moved from the recent low of $3,481 to a local high near $3,858, hugging the upper trendline of the wedge.
The structure remains intact with consistent higher lows, but current candles show some wicks and slowing momentum at the resistance line.
Immediate Resistance: $3,860 – psychological and structural ceiling
Support Zone: $3,775 and $3,700 (lower wedge edge)
Breakdown Watch: A confirmed close below $3,700 could suggest profit booking or short-term pressure.
If CRYPTOCAP:ETH can consolidate above $3,775 and push past $3,860 with volume, bulls may regain command.
However, a failure to hold the wedge support could trigger a retracement toward the $3,650–$3,600 range for structure revalidation.

$BNB is displaying a classic Triple Top formation
CRYPTOCAP:BNB is displaying a classic Triple Top formation on the 15-minute timeframe — a pattern that often signals buyer fatigue and a potential short-term reversal if key support breaks.
🔸Three peaks were formed near the $799–$800 resistance zone, with price failing to make new highs.
🔸The horizontal neckline rests near $792, a key level to watch for any confirmation of breakdown.
🔸Volume is tapering off slightly, hinting at reduced bullish pressure at current levels.
Resistance: $799.40 (local high)
Neckline Support: $792
Breakdown Trigger: Close below $792
Immediate Support (post-breakdown): $786 and $780
Invalidation: Break and close above $800 with volume
If #BNB fails to break $800 convincingly, and drops below $792, we could see a short-term corrective wave. This pattern is often followed by pullbacks, especially if confirmed with bearish momentum or broader market weakness.
That said, Triple Tops are not confirmed until the neckline gives way — so bulls still have a chance if $792 holds.
BINANCE:BNBUSDT
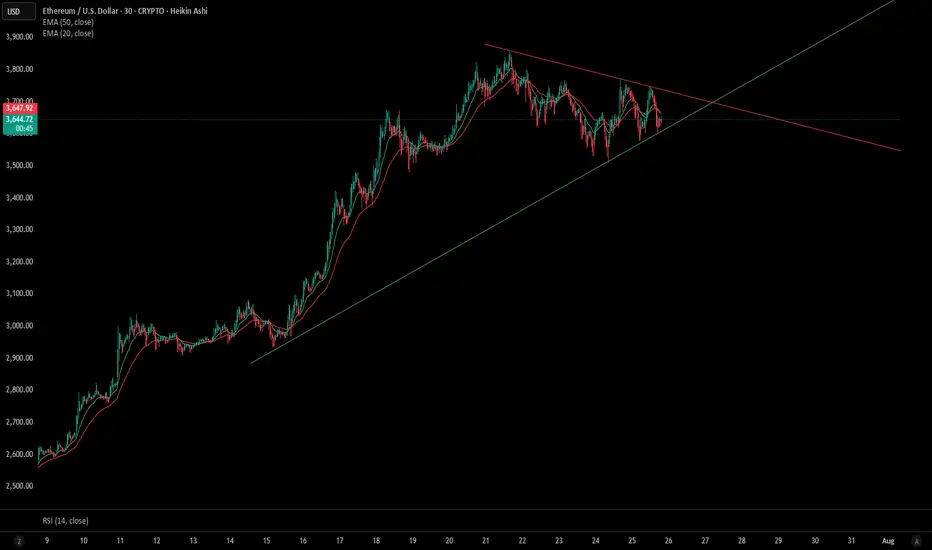
Symmetrical Triangle Formation Near Key Decision zoneThis 30-minute Heikin Ashi chart of Ethereum shows a developing symmetrical triangle pattern, signaling a potential breakout soon. Price action is consolidating between a rising trendline (support) and a descending trendline (resistance), converging near the $3,650 level.
EMAs: Price is currently trading between the 20 EMA ($3,662.61) and 50 EMA ($3,668.01), indicating indecision and tightening volatility.
RSI (14): Neutral at ~47, providing no strong directional bias.
Structure: Higher lows and lower highs define the triangle boundaries.
A breakout above $3,670–$3,700 could signal bullish continuation, while a break below $3,620 may trigger a bearish move.
Keep an eye on volume and RSI divergence to confirm breakout direction. Ideal for short-term traders anticipating a volatility spike.
ETHUSD Rejection Near Supply-Breakdown path to 3481ETH/USD shows signs of weakness after rallying into a short-term supply zone. The structure suggests a possible trend reversal as price begins to reject near key resistance.
🔍 Setup Highlights:
🟥 Red zone represents a clear supply area, where buyers were absorbed.
🟧 Yellow bar cluster from SignalPro shows early consolidation before the pump.
🔵 Breakdown trigger initiated as price lost the momentum and structure failed near 3,700.
🎯 Target zone at 3481, aligning with a previous demand imbalance zone.
📘 Educational Takeaway:
This chart helps illustrate how:
Supply rejection zones act as trend reversal points.
Visual tools like Leola Lens SignalPro guide traders on structure + sentiment.
Mapping invalidation clearly improves discipline and planning.

ETH BUY ZONE ANALYSIS - BASIS ON SMC CONCEPT ETH just broke a massive wall. But here’s what 90% of traders still don’t see…
ETH/USD, Ethereum is now dipping into a discount zone — and it's approaching an ideal best buy opportunity based on SMC Concept
ETH BUY STRATEGY (Best Plan )
While the market
shows signs
Of correction, ETH
Is dipping into premium
Smart Money buy
Levels. Here's where
I’m watching for
potential
accumulation
✅ Here's a breakdown Plan :
🔹 Current Price: $3,678
🔹 4H Demand Zone (Buy Area):
Zone 1 (First Buy Zone): $3,580 – $3,640
Based on recent price inefficiency and bullish OB
Zone 2 (Deeper Discount): $3,420 – $3,480
This zone aligns with deeper liquidity sweep + Fibonacci golden pocket
It's OB+ FVG also Fibb 0.79 Area
📍Primary Buy Range:
$3,580 – $3,640 (Watch for bullish reaction: engulfing candle / BOS on 1H or 15m)
🛑Invalidation (Stoploss):
Below $3,400
🎯Target Levels (Short-Term):
TP1: $3,850
TP2: $4,050
TP3: $4,168+
💬 Let me know in the comments if you're watching these zones too. Let’s grow smarter together – the Smart Money way.
#ETHUSDT #SMCCONCEPT

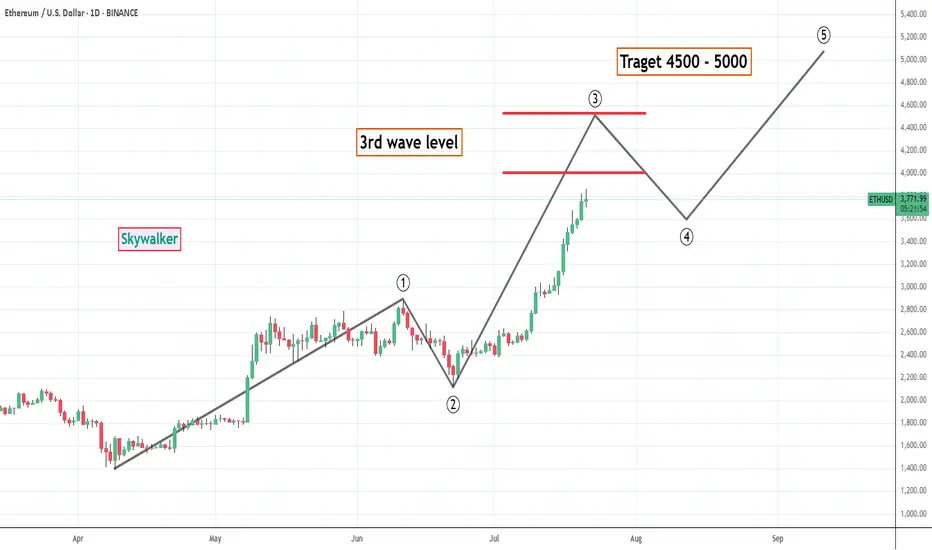
ETH - Target 4500 to 5000 as per wave theoryETH is showing movement as per wave theory so forecasting end of this bull run or possibility of correction can be arrived. clearly eth is in 3rd wave which could end anywhere at the redlines drawn in chart and based on which wave 4 and 5 can be approximately arrived at. what ever be the 3rd wave level ETH is sure to touch 4500 before showing bigger correction. And i think 5000 is also possible easily. For now holding bigger or decent qty long in ETH is suggested with proper money management.