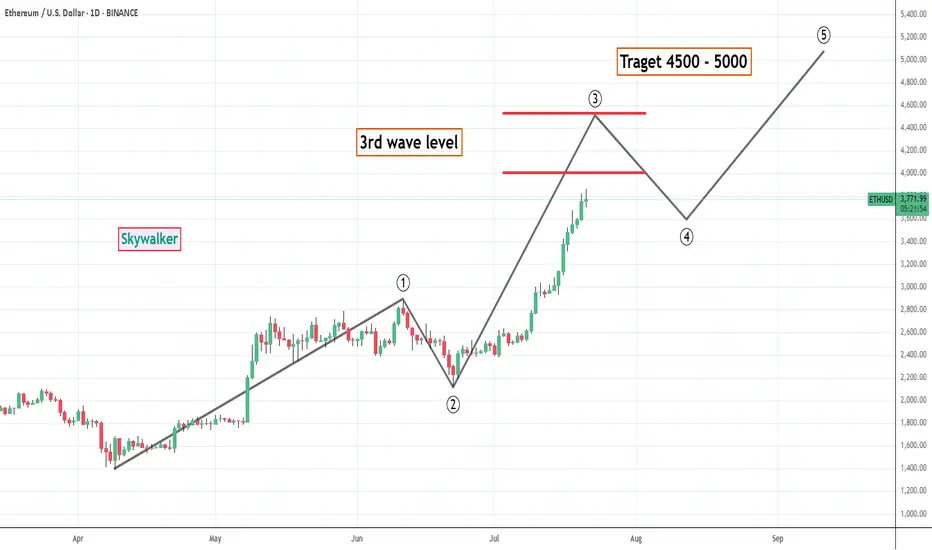
ETH - Target 4500 to 5000 as per wave theoryETH is showing movement as per wave theory so forecasting end of this bull run or possibility of correction can be arrived. clearly eth is in 3rd wave which could end anywhere at the redlines drawn in chart and based on which wave 4 and 5 can be approximately arrived at. what ever be the 3rd wave level ETH is sure to touch 4500 before showing bigger correction. And i think 5000 is also possible easily. For now holding bigger or decent qty long in ETH is suggested with proper money management.
Trade ideas
Ethereum as said last week will go near ATH How My Harmonic pattern projection Indicator work is explained below :
Recent High or Low :
D-0% is our recent low or high
Profit booking zone: D13% -D15% is
range if break them profit booking start on uptrend or downtrend but only profit booking, trend not changed
SL reversal zone : SL 23% and SL 25% is reversal zone if break then trend reverse and we can take reverse trade
Target : T1, T2, T3, T4 and .
Are our Target zone

ETH/USD – Symmetrical Triangle Breakout Imminent?Ethereum is consolidating within a symmetrical triangle on the 30-minute Heikin Ashi chart, suggesting a potential breakout is approaching. Price is currently hovering around the 50 EMA, showing indecision between bulls and bears.
🔹 Key Levels
Resistance: $3,675
Support: $3,483
EMA (50): $3,562
RSI: Neutral at 51.75
📌 Watch for breakout confirmation above the descending trendline or a breakdown below the ascending trendline to signal the next directional move.
⚠️ Not financial advice. Always do your own research.
#ETH #Ethereum #Crypto #TechnicalAnalysis #TrianglePattern #Breakout #HeikinAshi #Trading

Down moveEth seems to have completed or near completion of Wave B
Ready to enter wave C to the downside
Will keep you updated as the move progresses

renderwithme | ETH Price Prediction for next six Months 2025
Price Prediction for next six Months 2025
Price Range: Based on various forecasts, Ethereum (ETH) is expected to trade between approximately $2,500 and $3,360 in August 2025. The minimum price could be around $2,519.80, with a potential peak of $3,360.36. The average trading price is projected to be around $2,800–$3,100.
Bullish Scenario: If bullish momentum continues, driven by factors like institutional inflows or positive network developments, ETH could test the $3,150–$3,300 range or even approach $3,500 by late August. A breakout and close above $3,100 could trigger a rally toward $3,550–$3,800.
Bearish Scenario: If market sentiment turns negative, due to macroeconomic uncertainties or regulatory pressures, ETH could dip to $2,470–$2,500, with a potential further decline to $2,400 if support levels fail.
~~ Disclaimer ~~
This analysis is based on recent technical data and market sentiment from web sources. It is for informational \ educational purposes only and not financial advice. Trading involves high risks, and past performance does not guarantee future results. Always conduct your own research or consult a SEBI-registered advisor before trading.
# Boost and comment will be highly appreciated.
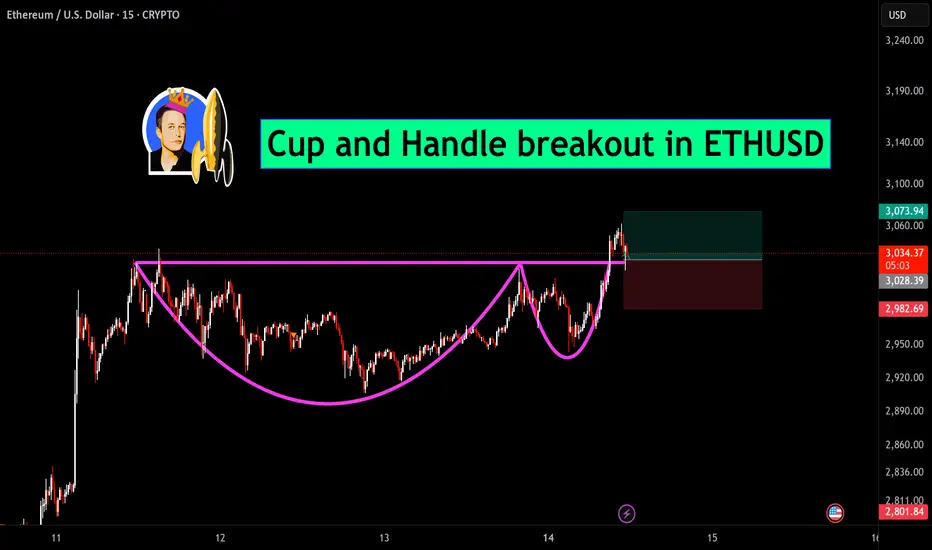
Cup and Handle breakout in ETHUSDA classic Cup and Handle pattern has been formed in ETHUSD. The price has successfully broken above the neckline, confirming the breakout. Currently, it's retesting the breakout zone as support — a healthy sign of strength. If this level holds, a further bounce and continuation to the upside is expected.
ETHUSD Short Setup – 15min ChartEthereum is currently showing weakness after a tight consolidation phase. Price has failed to sustain above key resistance and has broken below the minor support level, triggering a short opportunity.
🔻 Entry: $2,947
🎯 Target: $2,897
🛑 Stop Loss: $3,000

Ethereum updated levels, buy in dip previous ATH target openHow My Harmonic pattern projection Indicator work is explained below :
Recent High or Low :
D-0% is our recent low or high
Profit booking zone: D13% -D15% is
range if break them profit booking start on uptrend or downtrend but only profit booking, trend not changed
SL reversal zone : SL 23% and SL 25% is reversal zone if break then trend reverse and we can take reverse trade
Target : T1, T2, T3, T4 and .
Are our Target zone

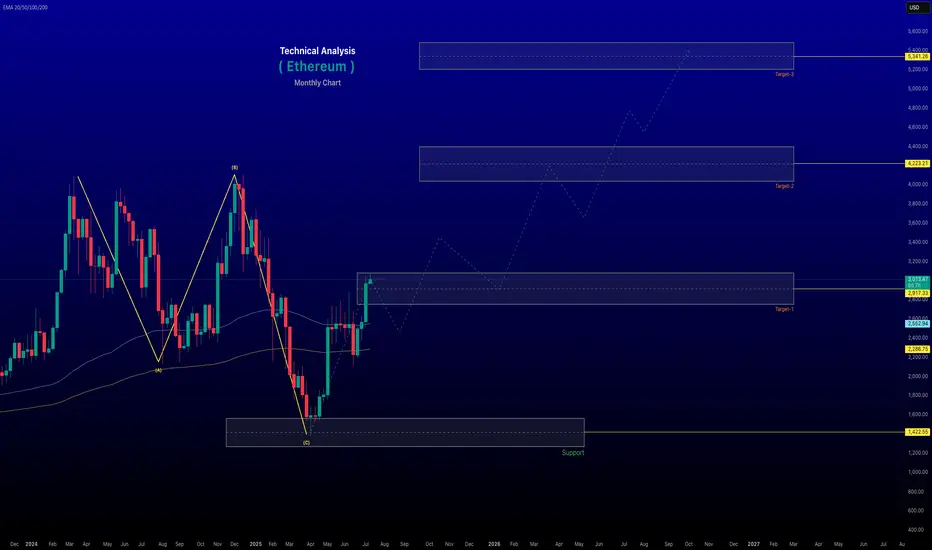
Best Possible Elliott Wave Counts: ETHUSDHello friends,
Welcome RK_Chaarts.
Today we're attempting to analyze Ethereum's chart from an Elliott Wave perspective. Looking at the monthly timeframe chart, we can see that from the beginning, around 2015-2016, when data is available, to the top in 2021 we have a Super Cycle degree Wave (I) marked in blue, which has completed.
Next, June 2022 we have a bottom around $874, marking the end of Super Cycle Wave (II) in blue.
We are now unfolding Wave (III), which should have five sub-divisions. Within this, the red Cycle degree Wave I and Wave II have completed, and we have possibly started the third of third wave.
Monthly:
Moving to a lower timeframe (Weekly) where we observed the completion of blue Wave (II) and the start of Wave (III), we notice that within this, the red Cycle degree Wave I and Wave II have completed, and we've possibly started Wave III of cycle degree marked in Red.
Furthermore, friends, within this third wave, we've marked the black Primary degree Waves ((1)) and ((2)), which we've labeled as Rounded ((1)) and Rounded ((2)). We're assuming these are complete, and Wave ((3)) has started, which is our current working hypothesis.
Weekly:
Now, if we move to a lower timeframe, such as the daily chart, we can see that the Cycle degree Wave II, which ended at 1385.70, has been followed by a Primary degree black Wave ((1)) in Black & Wave ((2)) has pulled back, completing Waves ((1)) and ((2)), and now Primary degree Wave ((3)) has started.
Possible wave counts on Daily
Within Wave ((3)), we expect five Intermediate degree waves. We've marked the first Intermediate degree Wave (1) in blue, which is currently unfolding. If we move to an even lower timeframe, such as the 4-hour chart, we can see that within the Intermediate degree blue Wave (1), there are five Minor degree sub-divisions marked in red. Waves 1 and 2 are complete, and Wave 3 is nearing completion.
Possible wave counts on 4 Hours:
Once Wave 3 is complete, we expect Waves 4 and 5 to follow, completing the Intermediate degree blue Wave (1). After that, we may see a dip in the form of Wave (2), followed by a continuation of the bullish trend as blue Wave (3).
Possible wave counts on 60 Min:
Friends, based on our multi-timeframe analysis, the overall wave structure appears bullish. We've provided snapshots of each timeframe, and you can see the nearest invalidation level marked with a red line.
In this study, we're using Elliott Wave theory and structure, which involves multiple possibilities. The scenario we're presenting seems plausible because it's aligned across multiple timeframes and adheres to Elliott Wave principles. However, please remember that this analysis can be wrong, and you should consult with a financial advisor before making any investment decisions.
This post is shared purely for educational purposes, to illustrate possible Elliott Waves.
I am not Sebi registered analyst.
My studies are for educational purpose only.
Please Consult your financial advisor before trading or investing.
I am not responsible for any kinds of your profits and your losses.
Most investors treat trading as a hobby because they have a full-time job doing something else.
However, If you treat trading like a business, it will pay you like a business.
If you treat like a hobby, hobbies don't pay, they cost you...!
Hope this post is helpful to community
Thanks
RK💕
Disclaimer and Risk Warning.
The analysis and discussion provided on in.tradingview.com/u/RK_Chaarts/ is intended for educational purposes only and should not be relied upon for trading decisions. RK_Chaarts is not an investment adviser and the information provided here should not be taken as professional investment advice. Before buying or selling any investments, securities, or precious metals, it is recommended that you conduct your own due diligence. RK_Chaarts does not share in your profits and will not take responsibility for any losses you may incur. So Please Consult your financial advisor before trading or investing.

ETHUSD📈 BITSTAMP:ETHUSD Weekly Chart | CMP: $2975
✅ Flag breakout above $2750
✅ Triangle breakout confirmed
📉 Previous range: High $4105 (Dec 2024) – Low $1385 (Apr 2025)
With current breakout holding, if $2290 (weekly close) holds as stop loss,
🎯 Target: $4430 in 12–18 months
Structure looks strong for long-term upside.
#ETH #Ethereum #Crypto #Altcoins #ChartAnalysis

ETHUSD Trade Setup – 15Min Chart UpdateEthereum respected the rising channel structure throughout the session, maintaining higher highs and higher lows. After a brief correction, ETH has once again bounced from the lower trendline support of the ascending channel.
🚀 Entry has been triggered right off the channel support zone, indicating bullish momentum is still intact.
📌 Key Levels:
Entry: Near $2783
Stop Loss: Below $2753
Target: $2809 and beyond
This setup offers a favorable risk-reward ratio, with strong structure-based confidence. As long as the trendline holds, bullish continuation is likely.

EDUCATIONAL | Uptrend OverEth has hit a major upward target.
Wave C is equal to Wave A
Will be on the lookout for shorting opportunities after getting a confirmation of downtrend, which will most likely be a corrective downtrend

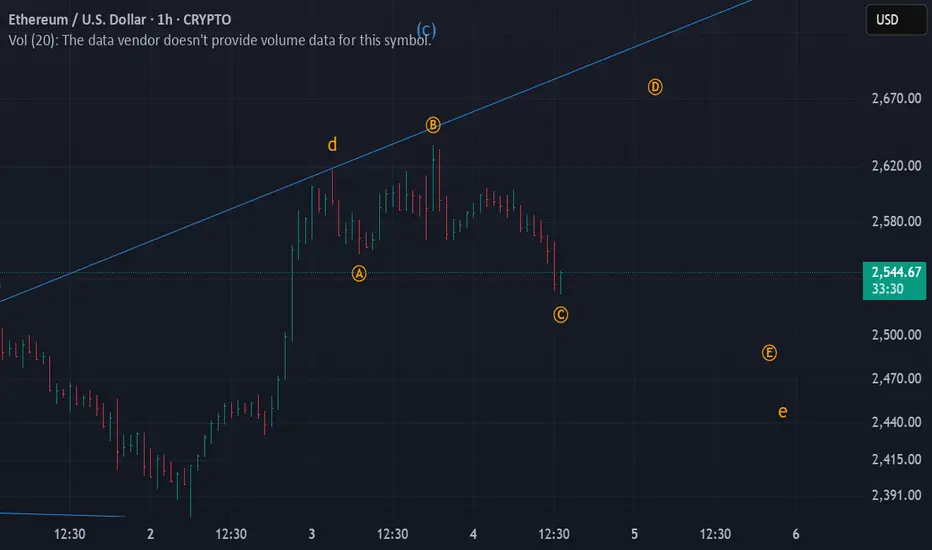
Corrective Rise UpEthereum seems to have completed Wave C of an expanding triangle and now we're headed towards Wave D.
Rise UpEth seems to have completed wave 2 or wave B and now moving upwards.
Tgt 1 -> 2630
Tgt 2 -> 2645

Educational | Completed a complex triple correctionEthereum seems to have completed a triple combination pattern
Wave Z ended with a neutral triangle
Wave Y was a zigzag
Wave W was a flat.
Wave Y took equal time as Wave W to form
Wave Z took twice the time of Wave W/Y.
This triple combination completed Wave E of a larger neutral triangle.
The internal Wave E of a triangle is generally similar to the larger triangle of which it is a part of.
In this case too, the Wave E of the neutral triangle itself concluded with a neutral triangle.
Let me know if you'd more such educational content or larger timeframe analysis of Ethereum or any other asset.
Happy Trading!!

ETHERIUM best tipReal-time Ethereum (ETH/USDT) chart powered by TradingView. Yeh chart aapko live price movements, historical trends, aur technical indicators ke sath full customization deta hai — perfect for traders & investors.

Ethereum levels,try to sell near resistance 2150-220 buying areaHow My Harmonic pattern projection Indicator work is explained below :
Recent High or Low :
D-0% is our recent low or high
Profit booking zone: D13% -D15% is
range if break them profit booking start on uptrend or downtrend but only profit booking, trend not changed
SL reversal zone : SL 23% and SL 25% is reversal zone if break then trend reverse and we can take reverse trade
Target : T1, T2, T3, T4 and .
Are our Target zone
Corrective DowntrendEthereum seems to forming Wave E of an expanding triangle and could lead to below Wave C.
Will update in case we need to book profit
Corrective Rise UpEthereum seems to have completed Wave C
and now we're entering Wave D which will be a corrective rise.
I believe we're in the starting of a diametric formation which will be of 'diamond' category

ETH/USDT strong up trend.Looking at the ETH chart, we can see one thing, the price has accumulated and moved sideways for quite a while after a strong up leg before. With the bullish price structure still maintained, with ETH we look for long positions with futures or SPOT for good positions. The price is expected to surpass $3,000 soon
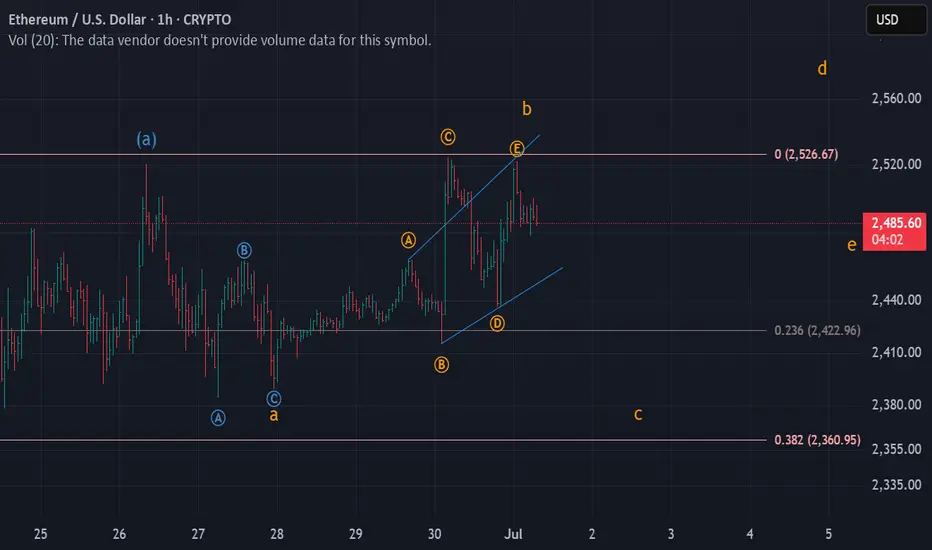
Corrective Downtrend | Hourly Ethereum seems to have completed Wave B in an hourly timeframe and now moving towards Wave C which could end a little lower than the starting of Wave B.
Will keep updating in case of any changes
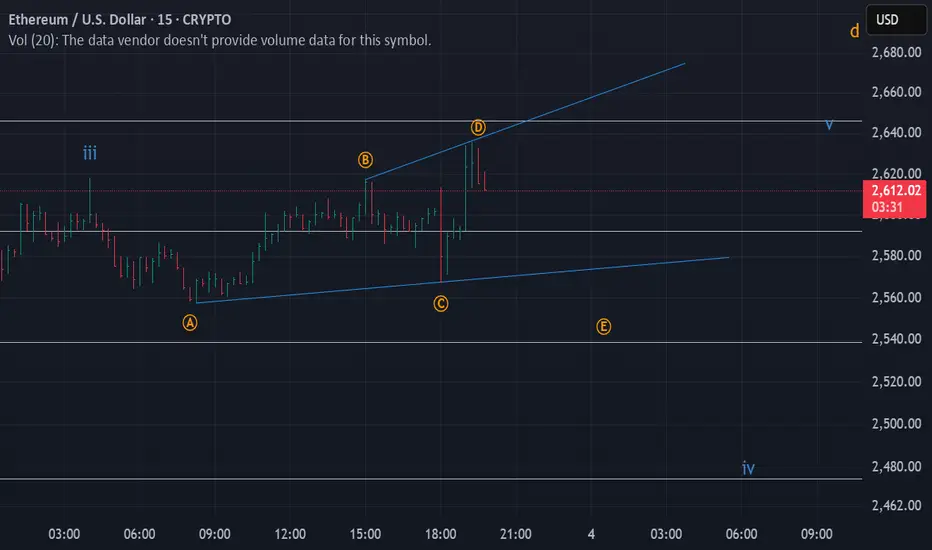
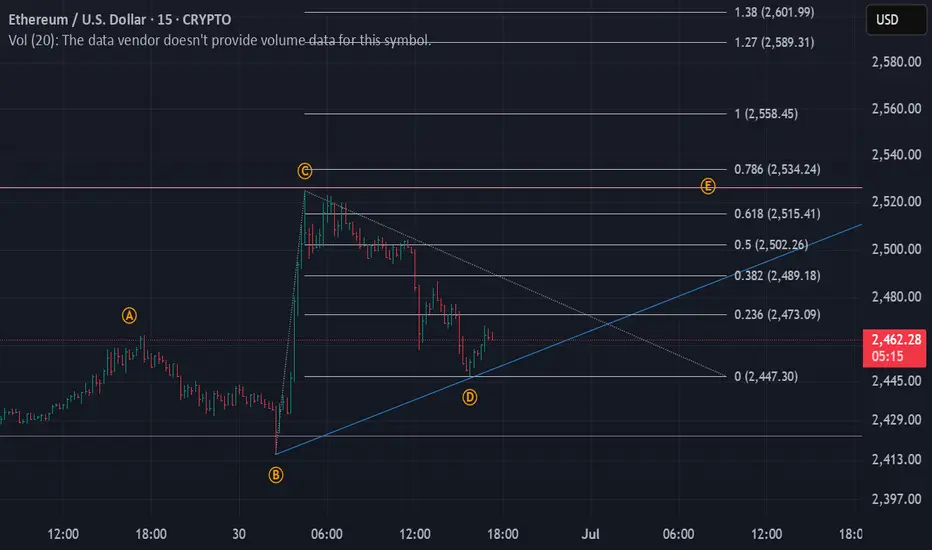
Corrective Rise UpEthereum seems to have or nearly completed Wave D of a neutral triangle and entering Wave E.
The minimum target of Wave E is around 2480
A break below current B-D trendline will be a warning sign that Wave D is still in progress
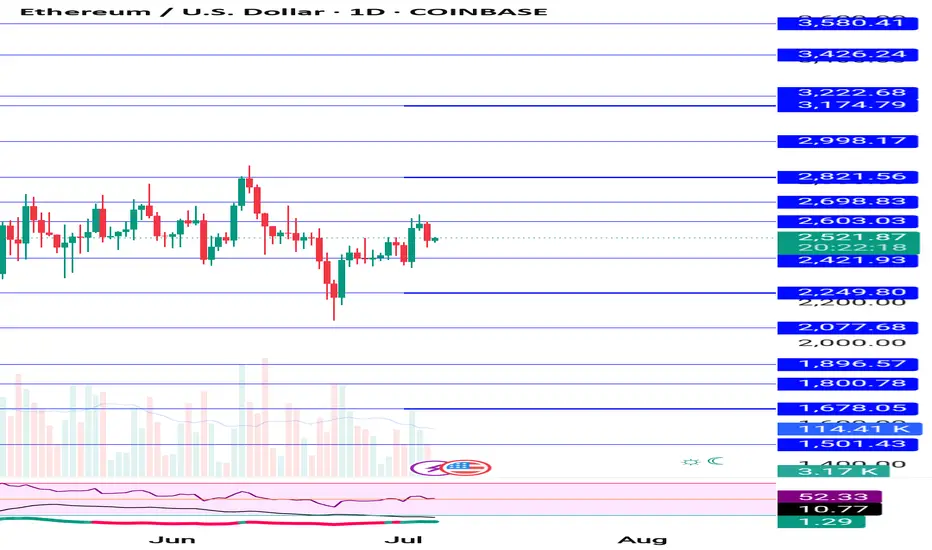
Ethereum buy near 2440 add more st 2380 sl 2340 target 2660,2730How My Harmonic pattern projection Indicator work is explained below :
Recent High or Low :
D-0% is our recent low or high
Profit booking zone: D13% -D15% is
range if break them profit booking start on uptrend or downtrend but only profit booking, trend not changed
SL reversal zone : SL 23% and SL 25% is reversal zone if break then trend reverse and we can take reverse trade
Target : T1, T2, T3, T4 and .
Are our Target zone
