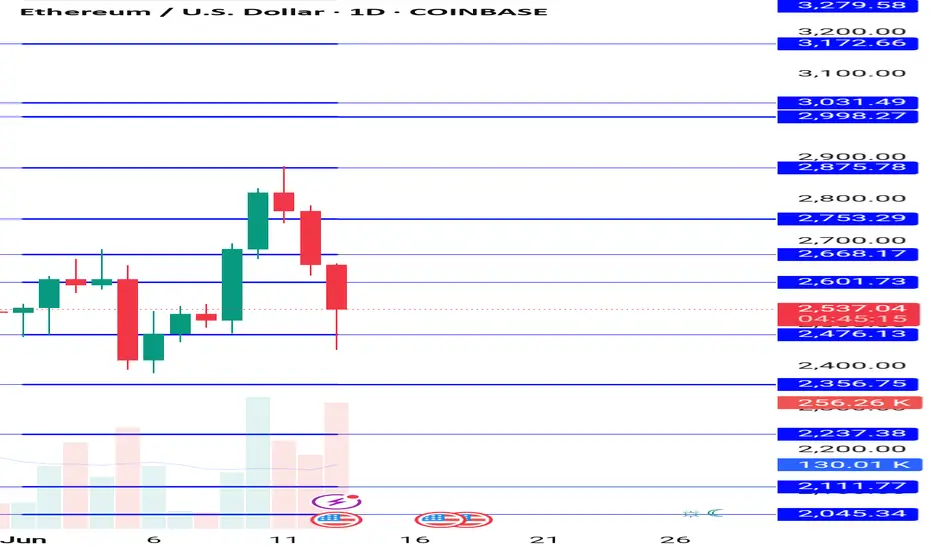
Ethereum Technical Analysis for the Week of June 16-June 231. Price Overview
Current Price: As of June 16, 2025, Ethereum's price is approximately $2,610.36 USD, with a 24-hour trading volume of $16.83 billion USD. It is up 2.59% in the last 24 hours.
Market Cap: Ethereum holds the #2 rank with a live market cap of $315.13 billion USD. Circulating supply is 120.72 million ETH.
Recent Performance:
Over the last 7 days, ETH has risen by 20%, showing strong upward momentum.
In the past month, ETH increased by 16.61%, adding an average of $624.97 to its value.
ETH has underperformed compared to Bitcoin in 2025 but shows signs of recovery with institutional interest growing.
# Support and Resistance Levels:
Support: Key support is around $2,160–$2,020
Resistance: Immediate resistance lies between $2,739–$2,850. A breakout above $2,800–$3,000 could target $3,400–$4,100.
-- Disclaimer --
This analysis is based on recent technical data and market sentiment from web sources. It is for informational purposes only and not financial advice. Trading involves high risks, and past performance does not guarantee future results. Always conduct your own research or consult a SEBI-registered advisor before trading.
#Boost and comment will be highly appreciated
Trade ideas
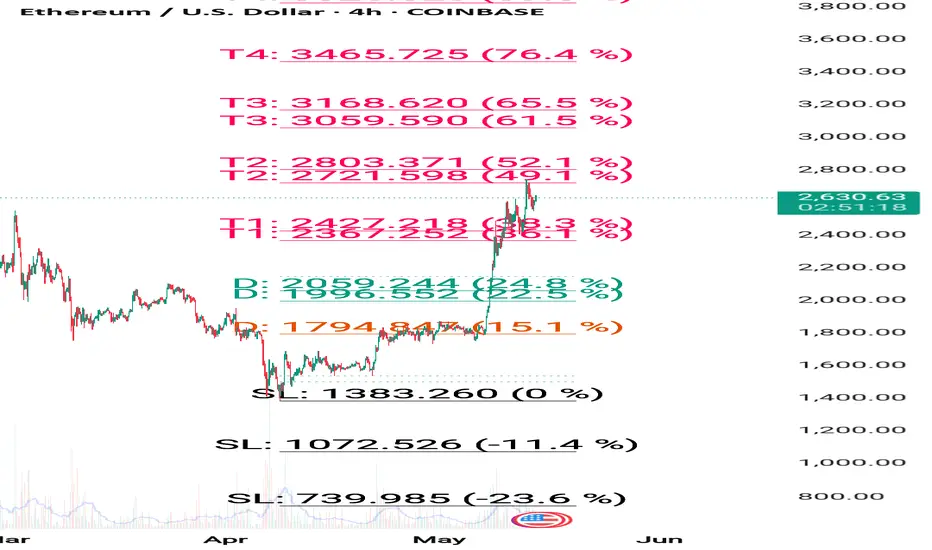
Ethereum updated levels let ti go down near 2050-1990How to take trades using Harmonic pattern projection Trade setup is explained below :-
Entry : 1st SL point : 0% is recent top or bottom.
Trailing D: 15.1% is work as trailing SL of buy or sell trade if hit then we have to book profit
.If price goes below 2nd D 22.5% to 24.5% range then early traders can make fresh reversals trade after breaking 1st D 15.1% safe traders can reversal trade after breaking Point D 22.5.4% to 24.5% range
Targets :
Target T1 : 36.1% to 38.3%
Target T3 : 49.1% to 52.5%
T3: 60.9% to 64.8% is our 3rd Target since this is reversal zone so must book profit if break then take fresh trade again
Target T4 : 76.4% to 79.7%
Next Targets are 100% , 127.2% ,141.4% and final Target 161.8%.
How to take reversal trade :
If price going upside/ downside then then buy or sell levels appear on Chart ( Automatically show when price reach any reversal zone of harmonic projection ).
Trailing SL:
After reach 1st Target trail SL to just above or below cost ( for example we are holding sell trade from 100 1st Target 110 hit then move trailing sl to 104-105 and move SL as price move upside or Downside)
Re- Entry :
For Re-entry in any pull back Point D ( 15.1% ) is used for re-entry then SL recent high or low Point SL ( 0% ) .
Blue Line is 1st support/ Resistance
Green line is 2nd support/ resistance
Red line is 3rd Support/ resistance
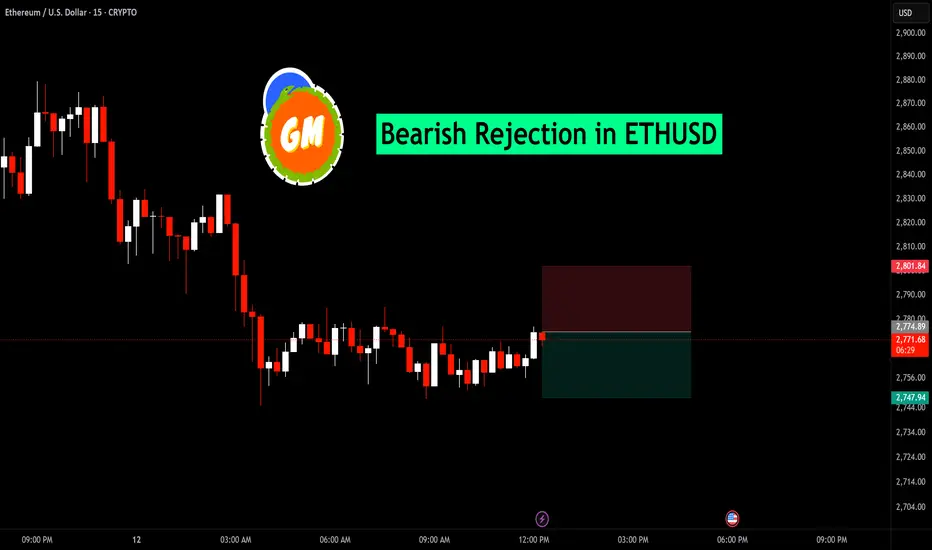
ETHUSD – Bearish Rejection Setup | 15-Min ChartEthereum faced rejection near the $2,775 resistance zone, indicating potential short-term weakness. After a period of sideways consolidation, the price failed to sustain above the key level and has started to show signs of bearish pressure.
Entry: $2,774.89
Target: $2,747.94
Stop Loss: $2,801.84
Risk-Reward Ratio: 1:1
This setup reflects a potential short opportunity as ETH forms a lower high and struggles to break above previous supply zones. A clean break below support may accelerate downside momentum.
#Ethereum Breakout Attempt #Ethereum Breakout Attempt 📢
After weeks of consolidation inside this range → CRYPTOCAP:ETH is now testing a breakout above major resistance $2750
👉 If this breakout holds → we could see a BIG upward rally toward $3500–$4000 in the coming weeks. 🚀
Keep an eye on this level — the next move could be massive.

Ethereum Technical Analysis for the Week of June 08-June 14~~ Technical Analysis~~
Current Price and Market Overview
Price: As of June 8, 2025, Ethereum (ETH) is trading at approximately $2,515.45 USD, with a 24-hour trading volume of ~$11.45 billion and a market cap of ~$303.67 billion. It has risen by 1.64% in the last 24 hours.
Recent Performance:
Weekly: Down -2.77%, indicating short-term consolidation or profit-taking.
Monthly: Up 43.31%, reflecting strong bullish momentum over the past month.
Yearly: Down -32.01%, suggesting longer-term challenges compared to its all-time highs.
Market Rank: Ethereum remains the #2 cryptocurrency by market capitalisation, behind Bitcoin.
-- Disclaimer --
This analysis is based on recent technical data and market sentiment from web sources. It is for informational and educational purposes only and not financial advice. Trading involves high risks, and past performance does not guarantee future results. Always conduct your own research or consult a SEBI-registered advisor before trading.
#Boost and comment will be highly appreciated

Ethereum (ETH/USD) Technical Analysis — Bearish Rejection Below 🔍 Ethereum (ETH/USD) Technical Analysis — Bearish Rejection Below Resistance ⚠️
📅 Date: June 4, 2025
📊 Chart Type: 2-Hour Timeframe
💱 Exchange: Binance
---
🧠 Overview:
The chart displays a clear range-bound market between well-defined resistance and support zones. The most recent price action suggests a rejection from the resistance region, hinting at a possible downward move toward support.
---
🟧 Key Levels:
Resistance Zone: $2,720 – $2,760
Price has tested this zone multiple times and failed to break above decisively.
Marked as a strong supply area where sellers dominate.
Support Zone: $2,460 – $2,490
This area has historically attracted buying interest, causing price reversals.
---
📉 Market Structure & Price Action:
The recent swing high formed a lower high relative to the peak on May 29, suggesting bearish momentum.
A projected bearish move is marked on the chart with a blue arrow 📉, forecasting a drop from around $2,640 down to the support zone near $2,480.
Multiple failed attempts to break resistance signal a potential trend continuation to the downside within this trading range.
---
⚠️ Trading Implications:
Short-term bias: Bearish 🔻
Confirmation needed: A breakdown below $2,600 with volume would strengthen bearish conviction.
Target for bears: $2,480 support area
Invalidation zone for this outlook: A breakout and close above $2,760 would shift the bias to bullish.
---
📌 Conclusion:
Ethereum is currently trading within a well-defined horizontal channel. With the latest rejection near resistance, the probability favors a move down to the support area. Traders should monitor key levels closely for confirmation before entering positions.
📈 Tip: Use proper risk management and watch for candlestick confirmation at critical levels.

Ethereum avoid fresh buying at current price buy given at 2470How to take trades using Harmonic pattern projection Trade setup is explained below :-
Entry : 1st SL point : 0% is recent top or bottom.
Trailing D: 15.1% is work as trailing SL of buy or sell trade if hit then we have to book profit
.If price goes below 2nd D 22.5% to 24.5% range then early traders can make fresh reversals trade after breaking 1st D 15.1% safe traders can reversal trade after breaking Point D 22.5.4% to 24.5% range
Targets :
Target T1 : 36.1% to 38.3%
Target T3 : 49.1% to 52.5%
T3: 60.9% to 64.8% is our 3rd Target since this is reversal zone so must book profit if break then take fresh trade again
Target T4 : 76.4% to 79.7%
Next Targets are 100% , 127.2% ,141.4% and final Target 161.8%.
How to take reversal trade :
If price going upside/ downside then then buy or sell levels appear on Chart ( Automatically show when price reach any reversal zone of harmonic projection ).
Trailing SL:
After reach 1st Target trail SL to just above or below cost ( for example we are holding sell trade from 100 1st Target 110 hit then move trailing sl to 104-105 and move SL as price move upside or Downside)
Re- Entry :
For Re-entry in any pull back Point D ( 15.1% ) is used for re-entry then SL recent high or low Point SL ( 0% ) .
Blue Line is 1st support/ Resistance
Green line is 2nd support/ resistance
Red line is 3rd Support/ resistance

Ethereum (ETH/USD) Price Action Analysis (1-Hour Timeframe)📊 Ethereum (ETH/USD) Price Action Analysis (1-Hour Timeframe) 📈
🔍 Chart Context:
Timeframe: 1-hour (intraday outlook)
Asset: ETH/USD (Binance)
🟠 Key Levels & Observations:
✅ Support Zone:
Around $2,470 - $2,500 (highlighted with orange boxes).
Price consistently tests and respects this area multiple times, indicating strong demand.
✅ Resistance Levels:
First significant resistance: $2,710 - $2,720 (highlighted with blue lines).
Extended target: around $2,760.
✅ Recent Price Action:
Clear higher low formation at the support zone, suggesting potential reversal.
Previous swing highs are well marked (orange circles), hinting at potential resistance retests.
✅ Chart Patterns:
Double bottom / accumulation pattern forming at the highlighted support zone.
Strong bullish reaction expected on successful retest.
🎯 Trade Setup Idea:
Entry: Near $2,500 support zone.
Target: Initial take-profit zone around $2,720.
Extended Target: If momentum continues, $2,760 level.
Stop-Loss: Below $2,470, ideally near $2,450 for risk management.
📈 Technical Bias:
Bullish bias in the short term, driven by repeated support tests and signs of reversal.
Chart hints at breakout potential if price overcomes $2,720.
⚠️ Risk Management & Cautions:
Key risk: False breakouts below $2,470 could trigger bearish continuation.
Maintain a favorable risk-reward ratio (e.g., 1:2 or better).
Market volatility can increase rapidly; keep trade sizes appropriate.
🚀 Summary & Conclusion:
🔵 Bias: Bullish
🔵 Entry Zone: $2,470 - $2,500
🔵 Target Zones:
TP1: $2,720
TP2: $2,760
🔵 Stop-Loss: Below $2,450
🔵 Key Indicators: Structure break, price respecting support, bullish engulfing candle potential.

Ethereum buy given near 2460 2850-2930 upside Target open How to take trades using Harmonic pattern projection Trade setup is explained below :-
Entry : 1st SL point : 0% is recent top or bottom.
Trailing D: 15.1% is work as trailing SL of buy or sell trade if hit then we have to book profit
.If price goes below 2nd D 22.5% to 24.5% range then early traders can make fresh reversals trade after breaking 1st D 15.1% safe traders can reversal trade after breaking Point D 22.5.4% to 24.5% range
Targets :
Target T1 : 36.1% to 38.3%
Target T3 : 49.1% to 52.5%
T3: 60.9% to 64.8% is our 3rd Target since this is reversal zone so must book profit if break then take fresh trade again
Target T4 : 76.4% to 79.7%
Next Targets are 100% , 127.2% ,141.4% and final Target 161.8%.
How to take reversal trade :
If price going upside/ downside then then buy or sell levels appear on Chart ( Automatically show when price reach any reversal zone of harmonic projection ).
Trailing SL:
After reach 1st Target trail SL to just above or below cost ( for example we are holding sell trade from 100 1st Target 110 hit then move trailing sl to 104-105 and move SL as price move upside or Downside)
Re- Entry :
For Re-entry in any pull back Point D ( 15.1% ) is used for re-entry then SL recent high or low Point SL ( 0% ) .
Blue Line is 1st support/ Resistance
Green line is 2nd support/ resistance
Red line is 3rd Support/ resistance

Ethereum buy recommended near 2450 2830-2910 upside Target How to take trades using Harmonic pattern projection Trade setup is explained below :-
Entry : 1st SL point : 0% is recent top or bottom.
Trailing D: 15.1% is work as trailing SL of buy or sell trade if hit then we have to book profit
.If price goes below 2nd D 22.5% to 24.5% range then early traders can make fresh reversals trade after breaking 1st D 15.1% safe traders can reversal trade after breaking Point D 22.5.4% to 24.5% range
Targets :
Target T1 : 36.1% to 38.3%
Target T3 : 49.1% to 52.5%
T3: 60.9% to 64.8% is our 3rd Target since this is reversal zone so must book profit if break then take fresh trade again
Target T4 : 76.4% to 79.7%
Next Targets are 100% , 127.2% ,141.4% and final Target 161.8%.
How to take reversal trade :
If price going upside/ downside then then buy or sell levels appear on Chart ( Automatically show when price reach any reversal zone of harmonic projection ).
Trailing SL:
After reach 1st Target trail SL to just above or below cost ( for example we are holding sell trade from 100 1st Target 110 hit then move trailing sl to 104-105 and move SL as price move upside or Downside)
Re- Entry :
For Re-entry in any pull back Point D ( 15.1% ) is used for re-entry then SL recent high or low Point SL ( 0% ) .
Blue Line is 1st support/ Resistance
Green line is 2nd support/ resistance
Red line is 3rd Support/ resistance

Buy ethereum near 2450 on any dip 2850-2930 upside Target How to take trades using Harmonic pattern projection Trade setup is explained below :-
Entry : 1st SL point : 0% is recent top or bottom.
Trailing D: 15.1% is work as trailing SL of buy or sell trade if hit then we have to book profit
.If price goes below 2nd D 22.5% to 24.5% range then early traders can make fresh reversals trade after breaking 1st D 15.1% safe traders can reversal trade after breaking Point D 22.5.4% to 24.5% range
Targets :
Target T1 : 36.1% to 38.3%
Target T3 : 49.1% to 52.5%
T3: 60.9% to 64.8% is our 3rd Target since this is reversal zone so must book profit if break then take fresh trade again
Target T4 : 76.4% to 79.7%
Next Targets are 100% , 127.2% ,141.4% and final Target 161.8%.
How to take reversal trade :
If price going upside/ downside then then buy or sell levels appear on Chart ( Automatically show when price reach any reversal zone of harmonic projection ).
Trailing SL:
After reach 1st Target trail SL to just above or below cost ( for example we are holding sell trade from 100 1st Target 110 hit then move trailing sl to 104-105 and move SL as price move upside or Downside)
Re- Entry :
For Re-entry in any pull back Point D ( 15.1% ) is used for re-entry then SL recent high or low Point SL ( 0% ) .
Blue Line is 1st support/ Resistance
Green line is 2nd support/ resistance
Red line is 3rd Support/ resistance

ETHEREUM MEGA CYCLE ALERT🚨 ETHEREUM MEGA CYCLE ALERT 🚨
CRYPTOCAP:ETH just bounced from the same support zone that sparked its last bull run 🔥
This could be the start of Wave 5 — and if history repeats…
🎯 Target: $10,000 ETH
Last time this pattern showed up? ETH went 10x.
Don’t fade the chart.
👉 Like & Retweet if you’re riding this wave
👇 Tag a friend who’s still sleeping on ETH!

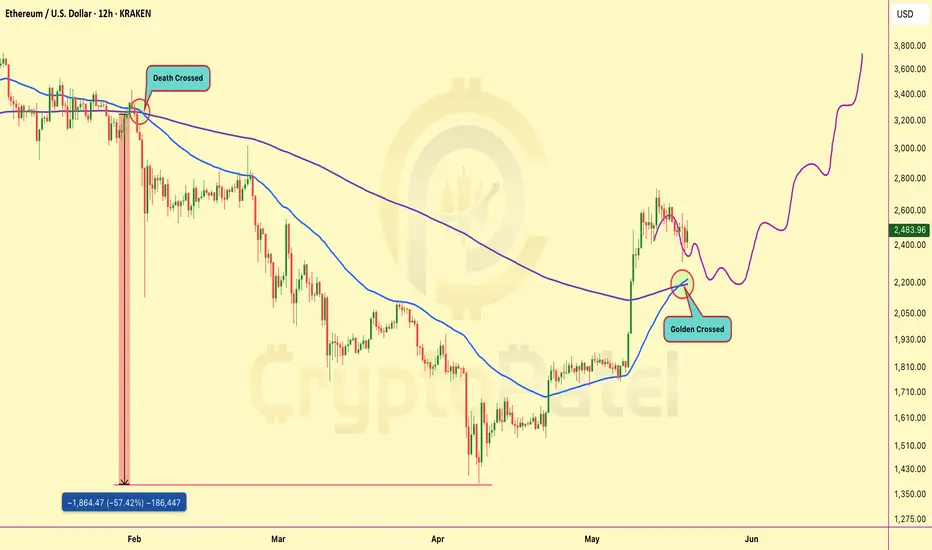
Ethereum Golden Crossed so What Next? $5000?🚨 CHART ALERT: CRYPTOCAP:ETH just flashed a GOLDEN CROSS on the 12H after months of bleeding!
Last time we saw a DEATH CROSS, #Ethereum crashed -57%.
Now it's doing the opposite — this could be the start of a massive pump! 🚀
TARGET? Maybe $3,800-$5000+ soon! 📈
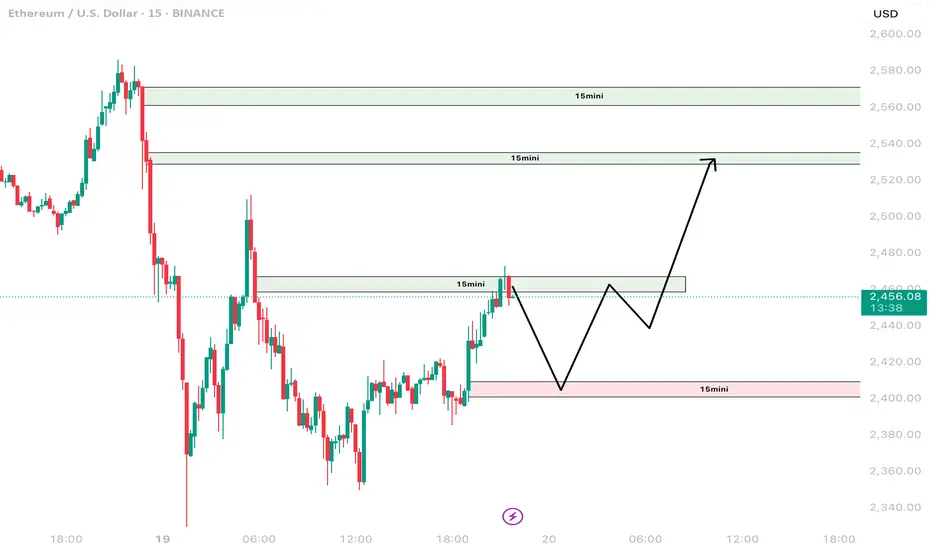
ETHEREUM | Technical Analysis 20th May 2025Hi,
I am sharing my daily view on ethereum for 20th May, 2025.
If you like my analysis then please share and like this post.
Disclaimer: This is only for educational purpose.
Thanks.
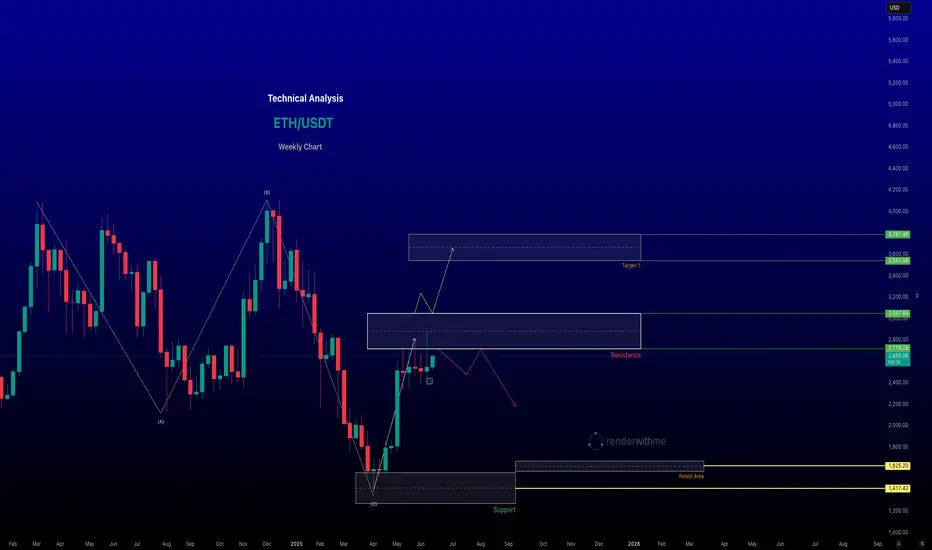
Ethereum - Technical Analysis Overview week of May 19–25, 2025Predicting Ethereum's (ETH) price movement for the week of May 19–25, 2025, involves analysing recent technical indicators, market sentiment, and external factors. Below is a concise technical analysis based on available data, focusing on key indicators and potential price trends. Note that cryptocurrency markets are highly volatile, and this analysis is not financial advice—always conduct your own research.
#Technical Analysis Overview
Current Price (as of May 17, 2025): Approximately $2,550, at the time of posting
Market Sentiment: Neutral to bullish, with mixed signals from technical indicators and a Fear & Greed Index.
Recent Performance: ETH has risen 29.61% over the past week and 16.61% over the past month, showing strong short-term momentum but facing potential resistance at 2,750 - 3,050
#Volume and Volatility:
Recent trading volume has surged (from $22.02B to $42.95B daily), indicating strong market interest.
Volatility remains high (17.61% over the past 30 days), suggesting potential for sharp price swings.
For support and resistance please refer the chart

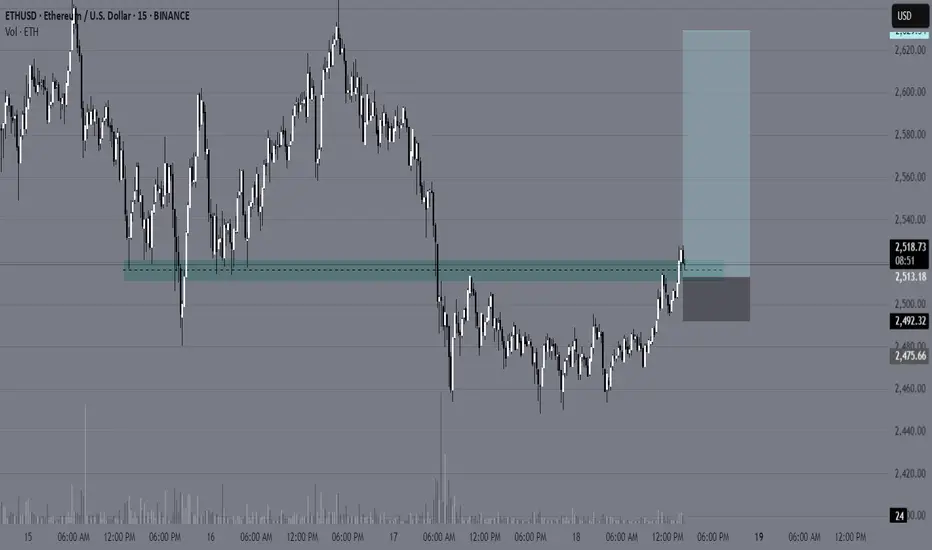
ETHUSD LONG WITH MORE THAN 1:2 RRHello traders, I'm bit late posting this Idea trade is already active, after consolidating in tight range in 1h time frame ETHUSD give break out on the upside we will try to capture reversal trade here.
LONG ETHUSD @2510 WITH
SL:-2450-2460 ZONE
TP:- 2600-2620 ZONE
HAVE A GREAT WEEKEND.

ETHUSD strong buyA strong buy signal notice with ETHUSD from 2515 with the Given SL and given target on the chart.
$ETH Pullback Loading: Is $1,800 the Next Big Buy Zone?Ethereum (ETH/USDT) Technical Outlook – Dip Analysis
After a strong bullish impulse breaking the downtrend, ETH is now entering a corrective phase.
Key Observation: Price has filled a major FVG (Fair Value Gap) near $2,500 and is showing signs of rejection.
🔻 Short-Term Bias: Bearish Retracement
We anticipate a pullback into the lower FVG zone between $1,854–$2,186, aligning with the +OB (Order Block) at ~$1,854-$1790 — a strong demand zone.
🟩 Buyers may step in here, making it a potential accumulation zone before the next leg up.
If this zone holds, ETH could resume its uptrend targeting the upper OB/FVG zone near $3,400–$3,600.
Strategy: Watch for bullish confirmation in the $1,800–$2,000 zone for potential long setups.

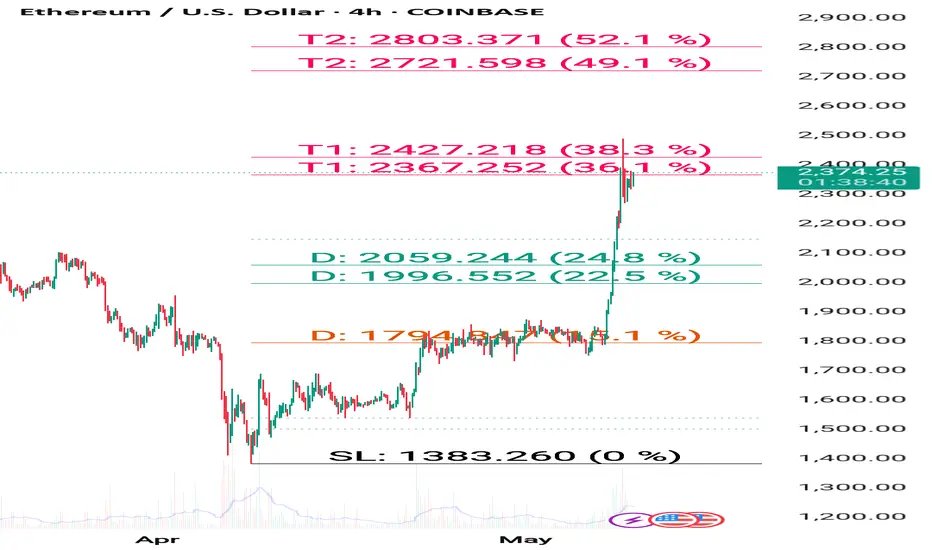
ETH continuesly long term buying given at 1590 avoid fresh buyHow to take trades using Harmonic pattern projection Trade setup is explained below :-
Entry : 1st SL point : 0% is recent top or bottom.
Trailing D: 15.1% is work as trailing SL of buy or sell trade if hit then we have to book profit
.If price goes below 2nd D 22.5% to 24.5% range then early traders can make fresh reversals trade after breaking 1st D 15.1% safe traders can reversal trade after breaking Point D 22.5.4% to 24.5% range
Targets :
Target T1 : 36.1% to 38.3%
Target T3 : 49.1% to 52.5%
T3: 60.9% to 64.8% is our 3rd Target since this is reversal zone so must book profit if break then take fresh trade again
Target T4 : 76.4% to 79.7%
Next Targets are 100% , 127.2% ,141.4% and final Target 161.8%.
How to take reversal trade :
If price going upside/ downside then then buy or sell levels appear on Chart ( Automatically show when price reach any reversal zone of harmonic projection ).
Trailing SL:
After reach 1st Target trail SL to just above or below cost ( for example we are holding sell trade from 100 1st Target 110 hit then move trailing sl to 104-105 and move SL as price move upside or Downside)
Re- Entry :
For Re-entry in any pull back Point D ( 15.1% ) is used for re-entry then SL recent high or low Point SL ( 0% ) .
Blue Line is 1st support/ Resistance
Green line is 2nd support/ resistance
Red line is 3rd Support/ resistance
Ethereum Ignites: Breakout Confirmed, Next Stop $2,900+Ethereum just flipped the switch.
After a prolonged accumulation phase and clean breakout from the prior range, ETH has officially entered an aggressive bullish cycle. The breakout above the consolidation zone around $2,250–$2,400 wasn’t just technical — it was conviction-driven. Price launched out of the zone with momentum, confirming bullish intent.
This breakout zone now turns into a strong buy zone on any retest. If ETH pulls back, it will only serve as a reload point before the next explosive move. The structure is intact, volume is validating the move, and momentum is fully shifted to the upside.
The next target is clearly marked at $2,917, a key level that aligns with past structure and potential liquidity buildup. There are no signs of weakness in the current trend — this rally is built on solid breakout energy.
Summary:
• Breakout confirmed above prior range
• Buy zone now sits between $2,250–$2,400
• $2,900+ is the next visible magnet
• Trend is strong, pullbacks are for positioning — not for fear

Ethereum avoid buying at current price 2335 to 2300 support areaHow to take trades using Harmonic pattern projection Trade setup is explained below :-
Entry : 1st SL point : 0% is recent top or bottom.
Trailing D: 15.1% is work as trailing SL of buy or sell trade if hit then we have to book profit
.If price goes below 2nd D 22.5% to 24.5% range then early traders can make fresh reversals trade after breaking 1st D 15.1% safe traders can reversal trade after breaking Point D 22.5.4% to 24.5% range
Targets :
Target T1 : 36.1% to 38.3%
Target T3 : 49.1% to 52.5%
T3: 60.9% to 64.8% is our 3rd Target since this is reversal zone so must book profit if break then take fresh trade again
Target T4 : 76.4% to 79.7%
Next Targets are 100% , 127.2% ,141.4% and final Target 161.8%.
How to take reversal trade :
If price going upside/ downside then then buy or sell levels appear on Chart ( Automatically show when price reach any reversal zone of harmonic projection ).
Trailing SL:
After reach 1st Target trail SL to just above or below cost ( for example we are holding sell trade from 100 1st Target 110 hit then move trailing sl to 104-105 and move SL as price move upside or Downside)
Re- Entry :
For Re-entry in any pull back Point D ( 15.1% ) is used for re-entry then SL recent high or low Point SL ( 0% ) .
Blue Line is 1st support/ Resistance
Green line is 2nd support/ resistance
Red line is 3rd Support/ resistance

ETHUSD 1D (Daily) chart: Long Setup🔍 Chart Overview
Asset: Ethereum / US Dollar (ETHUSD)
Timeframe: 1D
Pattern: Bullish Breakout from a Falling Channel
Bias: Strong bullish reversal in progress
Current Price: ~$2,414.80
Major Resistance Zone: ~$3,800–$4,000
Key Support Zones: ~$2,000 and ~$1,510
📈 Technical Breakdown
1. Falling Channel Breakout (Reversal Signal)
ETH had been trading in a downward-sloping channel since late 2024.
Recently broke above the descending channel with a large bullish candle.
This breakout indicates the end of the bearish trend and start of a potential long-term bullish phase.
✅ Classic bullish reversal signal with volume spike.
2. Strong Bullish Impulse
After the breakout, ETH created a powerful bullish impulse candle with almost no upper wick.
Indicates aggressive buyer momentum.
Price is now above multiple key resistance levels (now turned to support).
3. Key Demand Zones (Support)
Zone Description
~$2,018 Retest zone from structure + previous consolidation
~$1,510 Major historical support, origin of last major rally
If ETH pulls back, $2,018 zone is ideal for re-entry, as it's the most probable demand zone buyers may defend.
Second option for long-term reaccumulation is around $1,510 if a deeper correction occurs.
4. Bullish Rejection + Projection Path
The chart shows two possible bullish paths drawn with arrows:
One is a shallow pullback into the $2,000–$2,200 zone before rallying higher.
The second shows a deeper retest into the lower demand before heading up.
Both reflect valid bullish continuation setups.
🎯 Target Zone
Target Area: ~$3,800 to ~$4,000
This zone aligns with:
Previous high resistance
Liquidity pool / order block from last major drop
Psychological round number
📌 Ideal area to take profit or start reducing exposure on swing positions.
🧠 Confluences for Bullish Bias
Confluence Description
Break of falling channel ✅ Strong trend reversal signal
Clean bullish engulfing candle ✅ High momentum confirmation
Price broke structure highs ✅ Market structure shifted bullish
Retest zones clearly defined ✅ Logical risk-managed entries
Major resistance ahead ⚠️ Profit-taking zone (plan ahead)
🛠️ Possible Trading Plan
Option 1 – Aggressive Entry (Now)
Enter after breakout confirmation
SL below $2,000 (structure)
TP at $3,800–$4,000
RRR: ~1:3+
Option 2 – Conservative Entry (Retest)
Wait for pullback to $2,000–$2,100
SL below $1,900
TP at $3,800–$4,000
RRR: ~1:4 or higher
🚩 Caution Points
If ETH drops below $2,000 and closes below the demand zone, bullish setup weakens.
If Bitcoin drops sharply, it can drag ETH down too — watch BTC for confirmation.
Always manage risk — avoid FOMO entries after a strong impulse move.
✅ Conclusion
This is a textbook bullish reversal with a clear falling channel breakout, strong momentum, and well-defined support zones. Two bullish projections show smart trading ideas, and the ultimate target around $3,800–$4,000 is logical.

Ethereum 2390-2400 Target hit positional buy given at 1590How to take trades using Harmonic pattern projection Trade setup is explained below :-
Entry : 1st SL point : 0% is recent top or bottom.
Trailing D: 15.1% is work as trailing SL of buy or sell trade if hit then we have to book profit
.If price goes below 2nd D 22.5% to 24.5% range then early traders can make fresh reversals trade after breaking 1st D 15.1% safe traders can reversal trade after breaking Point D 22.5.4% to 24.5% range
Targets :
Target T1 : 36.1% to 38.3%
Target T3 : 49.1% to 52.5%
T3: 60.9% to 64.8% is our 3rd Target since this is reversal zone so must book profit if break then take fresh trade again
Target T4 : 76.4% to 79.7%
Next Targets are 100% , 127.2% ,141.4% and final Target 161.8%.
How to take reversal trade :
If price going upside/ downside then then buy or sell levels appear on Chart ( Automatically show when price reach any reversal zone of harmonic projection ).
Trailing SL:
After reach 1st Target trail SL to just above or below cost ( for example we are holding sell trade from 100 1st Target 110 hit then move trailing sl to 104-105 and move SL as price move upside or Downside)
Re- Entry :
For Re-entry in any pull back Point D ( 15.1% ) is used for re-entry then SL recent high or low Point SL ( 0% ) .
Blue Line is 1st support/ Resistance
Green line is 2nd support/ resistance
Red line is 3rd Support/ resistance