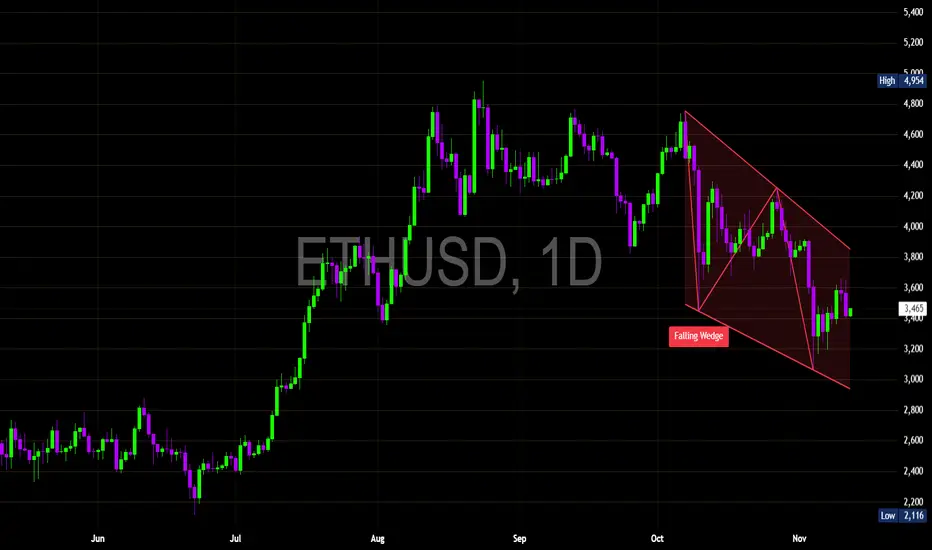
$ETH — Falling Wedge Forming on the Daily Chart ! CRYPTOCAP:ETH — Falling Wedge Forming on the Daily Chart !
#Ethereum has been consolidating within a Falling Wedge pattern since early October — a structure that often precedes a bullish reversal when confirmed with volume.
The wedge is tightening between $3,200 support and $3,700 resistance, forming lower highs and higher lows within a descending channel.
Historically, such formations break to the upside once selling pressure exhausts.
🔸️Support Zone: $3,200 → $3,000
🔹️Resistance Zone: $3,700 → $3,850
🔸️Breakout Confirmation: Daily close above $3,850 with rising volume may trigger a push toward $4,200 – $4,600, aligning with the top of the previous consolidation range.
🔹️Invalidation: Breakdown below $3,000 would signal extended downside toward $2,800.
#ETH is coiling inside a Falling Wedge, with bulls preparing to reclaim momentum if resistance breaks. A successful breakout could ignite a mid-term rally — but failure to hold $3,200 could extend the correction.
Trade ideas
ETH/USD - Fair Value Gap Retracement with Historical Reactions📈 ETH/USD – Fair Value Gap Retracement and Support Line Interaction
Ethereum’s daily chart showcases a clear bearish market structure, marked by a consistent series of lower highs and lower lows.
Throughout this decline, multiple Fair Value Gaps (FVGs) have emerged, each reflecting price inefficiencies created by strong institutional sell-side displacement.
These historical FVGs — now visible above the current price — reveal how ETH has repeatedly retraced to fill prior imbalances before resuming its downward trajectory.
The latest setup forms yet another bearish FVG, potentially acting as a retracement zone before continuation.
⸻⸻⸻⸻⸻⸻⸻⸻⸻⸻
📊 Key Observations
1️⃣ Historic FVG Reaction – The previous FVG (around the mid-October region) acted as a powerful supply zone. Price retraced deeply into that imbalance, filled it almost completely, and then reversed sharply — validating the concept of FVG-based rebalancing before continuation.
2️⃣ Current FVG Setup – A new bearish Fair Value Gap has now formed following another strong sell-side impulse. This zone represents a fresh inefficiency that may attract retracement before the next move down.
3️⃣ Optimal Confirmation Depth – The best confirmation typically occurs when price retraces toward the high of the FVG.
Reaching the upper boundary indicates that buy-side liquidity has been tapped and unfilled institutional sell orders have likely been triggered, often preceding a sharp rejection.
4️⃣ Descending Support Line – The trendline below price continues to act as a liquidity attractor. Stops often accumulate beneath it, making it a potential sweep zone before reversal.
5️⃣ Structural Context – The broader structure remains bearish. As long as price trades below the most recent FVG, sellers maintain full control.
⸻⸻⸻⸻⸻⸻⸻⸻⸻⸻
📊 Chart Explanation
Symbol → BINANCE:ETHUSD
Timeframe → 1D
This chart highlights the continuity of Fair Value Gap behavior throughout Ethereum’s bearish cycle.
The earlier FVGs (visible above current price) acted as magnets for retracement and then rejection — clear evidence of institutional rebalancing in action.
Each time ETH filled a previous FVG, the market found equilibrium before continuing downward.
Now, a fresh bearish FVG has formed, marking the next potential reaction area.
If price retraces deeper — ideally up to the high of this new FVG — it would offer the most reliable confirmation of a likely rejection. A shallower retracement, on the other hand, could signal weaker corrective intent.
Below current price, the descending support line identifies a possible liquidity pool. Price may sweep below this line to collect liquidity before any larger reversal attempt.
This confluence of historic and active FVGs, combined with the trendline structure, perfectly captures Smart Money’s rebalancing logic — inefficiency, retracement, rejection, and continuation.
The chart structure clearly displays a sequence of Lower Highs (LH) and Lower Lows (LL), confirming the ongoing bearish trend. This repeating HH–HL–LH–LL rhythm reflects controlled market structure and institutional rebalancing behavior.
⸻⸻⸻⸻⸻⸻⸻⸻⸻⸻
✅ Summary
• Ethereum continues to form lower highs and lower lows, maintaining its bearish structure.
• Historic FVGs show how price repeatedly retraced, filled inefficiencies, and reversed lower.
• A deeper retracement toward the high of the current FVG provides stronger confirmation for a rejection setup.
• The descending support line may act as a liquidity sweep zone before reversal.
• The overall sentiment remains bearish unless price closes above the FVG zone.
⸻⸻⸻⸻⸻⸻⸻⸻⸻⸻
⚠️ Disclaimer
📘 For educational purposes only.
🙅 Not SEBI registered.
❌ Not a buy/sell recommendation.
🧠 Purely a learning resource.
📊 Not Financial Advice.


Part 10 Trade Like InstitutionsAdvanced Option Strategies
a) Butterfly Spread
Market View: Very Neutral (Expecting Minimal Movement)
Action: Buy 1 lower strike call + Sell 2 middle strike calls + Buy 1 higher strike call.
It profits if the market remains near the middle strike.
Risk: Limited.
Reward: Limited but high probability of success.
b) Calendar Spread
Market View: Expecting Low Short-Term Volatility but High Long-Term Movement
Action: Sell near-month option + Buy next-month option of same strike.
Used by professional traders to take advantage of time decay differences between expiries.

ETHUSD SHOWING A GOOD UP MOVE WITH 1:10 RISK REWARDETHUSD SHOWING A GOOD
UP MOVE WITH 1:10 RISK REWARD
DUE TO THESE REASON
A. its following a rectangle pattern that stocked the market
which preventing the market to move any one direction now it trying to break the strong resistant lable
B. after the break of this rectangle it will boost the market potential for break
C. also its resisting from a strong neckline the neckline also got weeker ald the price is ready to break in the outer region
all of these reason are indicating the same thing its ready for breakout BREAKOUT trading are follws good risk reward
please dont use more than one percentage of your capitalfollow risk reward and tradeing rules
that will help you to to become a bettertrader
thank you

Ethereum stat buying on dip 4140-4200 upside target open Ethereum start buying on dip, levels given on chart 4140-4200 upside target
How My Harmonic pattern projection Indicator work is explained below :
Recent High or Low :
D-0% is our recent low or high
Profit booking zone ( Early / Risky entry) : D 13.2% -D 16.1 % is
range if break them profit booking start on uptrend or downtrend but only profit booking, trend not changed
SL reversal zone (Safe entry ) : SL 23.1% and SL 25.5% is reversal zone if break then trend reverse and we can take reverse trade
Target : T1, T2, T3, T4 and .
Are our Target zone
Any Upside or downside level will activate only if break 1st level then 2nd will be active if break 2nd then 3rd will be active.
Total we have 7 important level which are support and resistance area
Until , 16% not break uptrend will continue if break then profit booking will start.
If break 25% then fresh downtrend will start then T1, T2,T3 will activate
1,3,5,10,15,20 minutes are short term levels.
30 minutes 60 minutes , 2 hours,3 hours, ... 1 day and 1 week chart positional and long term levels

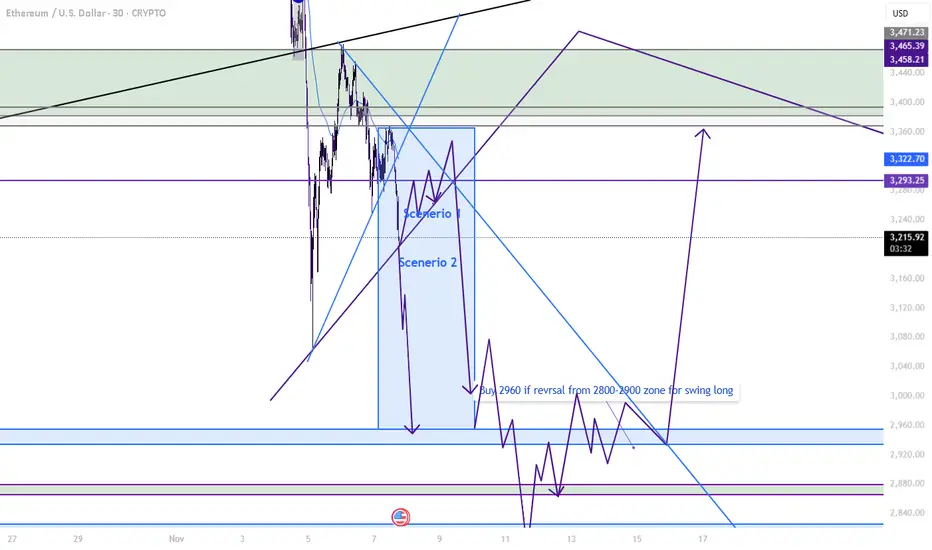
Eth path should be this for next few daysIn my mind the 1st scenerio could work if sudden fall may be scenerio 2 is work lets see guyz
(ETH/USD, 3-hour imeframe...(ETH/USD, 3-hour timeframe, Bitstamp):
The chart clearly shows a descending channel with price breaking below the lower boundary, confirming strong bearish momentum.
The Ichimoku Cloud is fully bearish, and price action is below all major cloud levels — confirming continuation to the downside.
My chart already shows a target point marker at the lower projection level.
📉 Target analysis (based on my chart + structure):
Current Price: ≈ $3,511
Immediate Target (TP1): Around $3,400 (shown near the “target point” on my chart)
Next Target (TP2): Around $3,300 — previous horizontal support & channel extension
Extended Target (TP3): Around $3,180 – $3,200, if bearish momentum accelerates
🔒 Stop-loss (for short trades):
Above $3,650 – $3,700 (upper boundary of current consolidation zone / channel midline)
📈 Summary:
Trend: Bearish continuation
TP1: $3,400
TP2: $3,300
TP3: $3,180
SL: $3,650 – $3,700

Fundamental Analysis for Long-Term Investors1. Understanding the Concept of Fundamental Analysis
At its core, fundamental analysis (FA) seeks to answer one key question: What is the true value of this company?
By comparing the intrinsic value (calculated through analysis) with the current market price, investors can decide whether to buy, hold, or sell a stock.
If Intrinsic Value > Market Price, the stock is undervalued — a potential buying opportunity.
If Intrinsic Value < Market Price, the stock is overvalued — a signal to avoid or sell.
This method assumes that, in the long run, the market will correct any mispricing and reflect the company’s actual worth.
2. Components of Fundamental Analysis
Fundamental analysis can be divided into two main parts:
a) Qualitative Analysis
This part deals with the non-numerical aspects of a company, such as:
Business Model – How the company earns revenue and its sustainability.
Management Quality – Leadership capability and corporate governance.
Competitive Advantage (Moat) – Unique strengths like brand value, patents, or cost advantages.
Industry Outlook – Growth potential, regulatory environment, and barriers to entry.
Economic Factors – Interest rates, inflation, fiscal policy, and global market trends.
b) Quantitative Analysis
This involves examining measurable data like financial statements, ratios, and cash flows to determine a company’s financial health.
3. Key Financial Statements in Fundamental Analysis
A company’s financial statements form the backbone of fundamental analysis. Long-term investors should focus on three primary statements:
a) Income Statement
It shows the company’s profitability over a period, detailing revenue, expenses, and net income.
Key metrics:
Revenue Growth – Indicates whether the company’s sales are increasing consistently.
Operating Margin – Reflects operational efficiency.
Net Profit Margin – Shows how much profit remains after all expenses.
b) Balance Sheet
This statement provides a snapshot of the company’s financial position — assets, liabilities, and shareholders’ equity.
Important metrics include:
Debt-to-Equity Ratio (D/E) – Measures financial leverage; lower ratios imply less risk.
Current Ratio – Indicates liquidity; a ratio above 1 shows good short-term financial health.
Book Value per Share – Helps assess whether the stock is trading above or below its book value.
c) Cash Flow Statement
This shows the actual cash generated or used by the company.
Focus areas:
Operating Cash Flow (OCF) – Cash generated from core business operations.
Free Cash Flow (FCF) – Cash left after capital expenditures; indicates ability to reinvest or reward shareholders.
4. Key Financial Ratios for Long-Term Investors
Ratios simplify the evaluation of a company’s performance. Some of the most important ones are:
a) Valuation Ratios
Price-to-Earnings (P/E) Ratio – Indicates how much investors are willing to pay for each rupee of earnings. A lower P/E could suggest undervaluation.
Price-to-Book (P/B) Ratio – Compares market value to book value; useful for asset-heavy industries.
Price-to-Sales (P/S) Ratio – Ideal for companies with negative earnings but growing sales.
b) Profitability Ratios
Return on Equity (ROE) – Measures how efficiently equity is used to generate profit.
Return on Assets (ROA) – Shows how effectively the company uses its assets.
Gross and Net Margins – Indicate profitability at different stages of the income statement.
c) Liquidity and Solvency Ratios
Current Ratio & Quick Ratio – Assess short-term liquidity.
Interest Coverage Ratio – Measures ability to pay interest on debt.
d) Growth Ratios
Earnings Per Share (EPS) Growth – Consistent EPS growth indicates strong performance.
Revenue Growth Rate – Reflects expansion potential and demand.
5. Intrinsic Value and Valuation Methods
The goal of fundamental analysis is to determine intrinsic value — an estimate of what a company is truly worth. Some popular valuation methods include:
a) Discounted Cash Flow (DCF) Model
This method projects the company’s future cash flows and discounts them to present value using a required rate of return.
It’s one of the most reliable methods for estimating intrinsic value, though it requires accurate assumptions.
b) Dividend Discount Model (DDM)
Used for dividend-paying companies; it values a stock based on future dividend payments discounted to the present.
c) Relative Valuation
Compares the company’s valuation ratios (like P/E or EV/EBITDA) with peers or industry averages to assess whether it’s under or overvalued.
6. Economic and Industry Analysis
Fundamental analysis is not limited to company-level study. A top-down approach starts with understanding the broader economy and narrows down to sectors and companies.
a) Economic Analysis
Factors like GDP growth, interest rates, inflation, and fiscal policy impact company earnings and valuations. For example:
Rising interest rates can hurt highly leveraged firms.
Inflation affects input costs and consumer demand.
b) Industry Analysis
Identifying industries with favorable long-term prospects (such as renewable energy, technology, or healthcare) can improve investment success. Tools like Porter’s Five Forces help analyze industry competitiveness and profitability.
7. Qualitative Factors and Management Assessment
A company’s management team plays a vital role in long-term success. Investors should assess:
Leadership Track Record – Vision, integrity, and experience of the management team.
Corporate Governance – Transparency, accountability, and alignment with shareholder interests.
Innovation Capability – Ability to adapt to changing technology or consumer behavior.
Brand Reputation – Strength of brand loyalty and market position.
8. The Margin of Safety Principle
Coined by Benjamin Graham, the margin of safety is the difference between a stock’s intrinsic value and its market price.
For example, if a stock’s intrinsic value is ₹500 and it’s trading at ₹350, the 30% gap is the margin of safety — a cushion against analytical errors or unforeseen events.
This principle ensures that even if some assumptions go wrong, the investment remains relatively safe for the long term.
9. Long-Term Perspective and Patience
Fundamental analysis rewards patience. Stock prices can remain undervalued or overvalued for extended periods due to market sentiment or short-term volatility. However, over time, prices tend to align with intrinsic value.
Long-term investors must focus on business fundamentals, not market noise.
Compounding works best when investments are held for years in fundamentally strong companies with consistent growth, low debt, and sustainable advantages.
10. Limitations of Fundamental Analysis
While powerful, FA has its challenges:
Time-Consuming – Requires deep research and analysis.
Subjectivity – Valuation depends on assumptions that may not always be accurate.
Market Irrationality – Prices can deviate from fundamentals for long periods.
Changing Macroeconomics – Economic shocks can alter intrinsic value projections.
Thus, blending FA with periodic reviews and awareness of market cycles enhances decision-making.
Conclusion
Fundamental analysis is the foundation of successful long-term investing. It equips investors with the knowledge to differentiate between temporary market noise and genuine value. By analyzing a company’s financial health, competitive position, management quality, and future prospects, investors can make informed decisions that compound wealth over time.


Option Trading StrategiesFactors Affecting Option Prices (The Greeks)
Options are influenced by multiple variables, often referred to as Option Greeks. These measure the sensitivity of option prices to different factors:
Delta (Δ): Measures how much the option’s price changes with a ₹1 change in the underlying.
Gamma (Γ): Measures the rate of change of Delta; it indicates stability.
Theta (Θ): Represents time decay; how much the option loses in value per day.
Vega (ν): Measures sensitivity to volatility; higher volatility increases premium.
Rho (ρ): Measures sensitivity to changes in interest rates (less relevant for short-term options).
Understanding Greeks helps traders manage risk and hedging more effectively.

totally bearishI think market bearish till 3500 zone if eth survive 3500 zone and give an upside direction we can see new hisgh

ETH to make its ATH>Current Price: ~$3,880
Trendline Support: Rising from ~$2,700 → currently near ~$3,750
Major Support Zone: ~$2,800 (horizontal base)
RSI (14): ~45 → neutral, but slightly weak momentum(waiting for liquidity sweep).
Currently at bars touches trendline of 1D support Zone as we can see but we have to wait for liquidity sweep( hammer at 1D time frame) and go for long.
Disclaimer- This analysis is for educational and informational purposes only. It does not constitute financial or investment advice. Cryptocurrency markets are highly volatile and speculative.

Ethereum on 15 min time frame Ethereum in 15 min TF under in choppy zone 3820 to 3880
If it's break above side at 3900
Then i look for previous resistance zone
At
1. 3950
2 3400
Stop lose
I place my Stop below this zone area at
3790. 3800
How F&O Trading Works in the Indian Stock MarketIntroduction
The Indian stock market is a vast financial ecosystem where various types of instruments allow investors to participate, hedge, or speculate. Among these, Futures and Options (F&O) trading has gained immense popularity in recent years. This segment of the market attracts not just institutional investors but also a growing number of retail traders.
F&O trading offers the potential for high returns, but it also involves significant risk. To understand how it works, one needs to grasp the underlying principles, mechanisms, and practical strategies that drive this segment. This detailed guide will explore what F&O trading is, how it functions in India, the role of margin, settlement, and risk management — helping you understand how traders profit (or lose) in this high-stakes market.
1. Understanding the Basics of F&O Trading
What Are Derivatives?
Futures and Options are both types of derivative instruments, meaning their value is derived from an underlying asset. The underlying asset could be:
A stock (like Reliance Industries or Infosys)
An index (like Nifty 50 or Bank Nifty)
A commodity
A currency pair
For instance, if you buy a Nifty 50 futures contract, your profit or loss depends on the movement of the Nifty index, not on an individual stock.
Why Are Derivatives Used?
Derivatives are used for three main purposes:
Hedging: To protect against potential losses in the cash market.
Speculation: To profit from price movements without owning the asset.
Arbitrage: To exploit price differences between the cash and derivatives markets.
2. Futures Contracts Explained
A Futures contract is a legal agreement to buy or sell an underlying asset at a predetermined price on a specified future date.
Key Features of Futures
Standardized Contracts: Traded on exchanges like NSE or BSE with predefined lot sizes and expiry dates.
Leverage: Traders only pay a fraction of the total value (known as margin), allowing control over larger positions.
Obligation to Fulfill: Both buyer and seller are obligated to complete the transaction at expiry unless the position is squared off before.
Example:
Suppose the Nifty 50 index is trading at ₹22,000. A Nifty futures contract (lot size = 50) allows you to buy or sell exposure worth ₹11,00,000 (22,000 × 50).
However, you only need to pay a margin of about 10–15%, say ₹1,10,000–₹1,65,000.
If Nifty rises to ₹22,300, you gain ₹300 × 50 = ₹15,000.
If it falls to ₹21,700, you lose ₹15,000.
Thus, leverage magnifies both profits and losses.
3. Options Contracts Explained
What Are Options?
An Option gives the buyer the right, but not the obligation, to buy or sell an asset at a predetermined price (called the strike price) before or on a specified expiry date.
Call Option: Right to buy an asset.
Put Option: Right to sell an asset.
The buyer pays a premium to the seller (writer) for this right.
Example:
Suppose Infosys is trading at ₹1,500. You buy a call option with a strike price of ₹1,520 at a premium of ₹20.
If Infosys rises to ₹1,560, your gain = (₹1,560 − ₹1,520 − ₹20) = ₹20 per share.
If Infosys falls below ₹1,520, you can let the option expire — your loss is limited to the premium (₹20 per share).
The Two Sides of an Option Trade:
Option Buyer: Pays the premium, risk limited to that amount.
Option Seller (Writer): Receives premium, but risk can be unlimited if the market moves against them.
4. The F&O Market Structure in India
Trading Platforms
F&O contracts in India are primarily traded on:
NSE (National Stock Exchange) – India’s largest derivatives market.
BSE (Bombay Stock Exchange) – Smaller but active in some index derivatives.
Expiry Cycles
Stock futures and options have a monthly expiry, typically the last Thursday of the month.
Index derivatives (like Nifty and Bank Nifty) have weekly expiries as well.
Lot Sizes
Each contract has a lot size determined by SEBI to ensure that the total contract value remains around ₹5–10 lakh.
Example:
Nifty 50: 50 units
Bank Nifty: 15 units
Reliance Industries: 250 shares per lot
5. How Margin and Leverage Work
1. Initial Margin
When you enter an F&O trade, you must deposit an initial margin, which includes:
SPAN margin: Covers potential losses based on volatility.
Exposure margin: Additional cushion required by the exchange.
2. Mark-to-Market (MTM) Settlement
Futures positions are marked to market daily — meaning:
If your position gains, money is credited.
If it loses, funds are debited.
This ensures daily profit and loss settlement, reducing counterparty risk.
3. Leverage Effect
Leverage allows traders to amplify returns. However, the same mechanism can wipe out capital quickly.
For example, a 2% adverse move in Nifty could mean a 15–20% loss on margin capital.
6. How Option Premiums Are Determined
More volatility → higher premium
More time to expiry → higher premium
Deep in-the-money options have high Delta and value movement close to the underlying asset.
7. Settlement Mechanism
1. Futures Settlement
Index Futures: Settled in cash at expiry.
Stock Futures: Also cash-settled, no actual delivery of shares.
2. Options Settlement
In-the-Money options are settled in cash automatically at expiry.
Out-of-the-Money options expire worthless.
Since 2019, SEBI has allowed physical settlement for stock options — meaning if you hold an in-the-money position at expiry, you might have to buy or sell actual shares.
8. Participants in the F&O Market
The Indian derivatives market attracts a wide variety of players:
Hedgers: Investors or institutions protecting their portfolios from adverse price movements (e.g., mutual funds, FIIs).
Speculators: Traders betting on price direction to earn quick profits.
Arbitrageurs: Professionals exploiting price mismatches between cash and F&O markets.
Retail Traders: Growing segment using F&O for short-term speculation.
9. Risks and Rewards in F&O Trading
The Rewards
High leverage: Small capital can control large exposure.
Flexibility: Profit in both rising and falling markets.
Hedging power: Protects long-term investments.
Liquidity: Nifty, Bank Nifty, and top stock derivatives offer deep liquidity and tight spreads.
The Risks
High volatility: Prices can move sharply in seconds.
Leverage trap: Amplifies losses as much as profits.
Time decay: Options lose value daily if the underlying doesn’t move favorably.
Complexity: Requires understanding of Greeks, margin rules, and expiry mechanisms.
10. Example: Real-World F&O Scenario
Case 1: Nifty Futures Trade
You expect Nifty to rise from 22,000 to 22,300.
You buy one Nifty Futures contract at 22,000.
Margin required: ₹1.2 lakh.
Nifty closes at 22,300 → Profit = ₹300 × 50 = ₹15,000 (≈12.5% return on margin).
However, if Nifty drops to 21,700 → Loss = ₹15,000 (≈12.5% loss).
Case 2: Option Strategy – Protective Put
Suppose you hold Reliance shares at ₹2,400 and fear a correction.
You buy a Put Option at ₹2,350 by paying a premium of ₹20.
If Reliance falls to ₹2,200, you can sell at ₹2,350 → Loss limited to ₹50 (minus premium).
If it rises, you lose only ₹20 premium but retain upside.
This illustrates how options can act as an insurance mechanism.
11. Regulatory Framework and SEBI’s Role
The Securities and Exchange Board of India (SEBI) regulates F&O trading to ensure fairness, transparency, and investor protection.
Some key regulations include:
Margin requirements to control leverage.
Position limits to avoid market manipulation.
Physical settlement for stock derivatives.
Disclosure norms for institutional participants.
Exchanges like NSE Clearing Ltd. act as clearing corporations, ensuring all trades are honored and counterparty risk is eliminated.
12. The Growth of F&O in India
The Indian derivatives market has witnessed exponential growth:
NSE’s derivatives turnover often exceeds ₹200–300 lakh crore per day.
Index options (especially Bank Nifty and Nifty) dominate trading volumes.
Retail participation has increased drastically due to online platforms and simplified apps.
However, SEBI and exchanges have repeatedly warned traders about excessive speculation and the risk of retail losses due to leverage.
13. Taxation of F&O Trading
In India, income from F&O trading is considered business income, not capital gains.
Profits and losses must be reported under “Income from Business or Profession.”
Expenses like brokerage and internet charges can be deducted.
Audit requirement: If turnover exceeds ₹10 crore (or under certain loss conditions), audit is mandatory.
Short-term speculative traders must also pay GST on brokerage and STT (Securities Transaction Tax) on trades.
14. The Future of F&O Trading in India
The future looks dynamic with:
Introduction of new derivative products (sectoral, volatility-based).
Growth of weekly expiries and index-based contracts.
Increased algorithmic and retail participation.
Regulatory push toward risk-aware trading and investor education.
F&O trading will continue to be a key pillar of India’s capital markets, balancing speculation, liquidity, and hedging opportunities.
Conclusion
Futures and Options trading is a double-edged sword — a powerful tool for hedging, speculation, and arbitrage, but also a domain where leverage magnifies risks.
Understanding contract structure, margin mechanism, pricing logic, and strategy design is essential before stepping in.
For a disciplined trader, F&O offers flexibility, liquidity, and opportunities unmatched in the traditional cash market. But for the uninformed or impulsive participant, it can be financially dangerous.
In short, F&O trading rewards knowledge, strategy, and risk control — not emotion or luck.
The key to success lies in understanding how the system works and using it intelligently to your advantage.
Part 2 Intraday Trading Masterclass Key Terminologies in Option Trading
Before diving deeper, it’s important to understand some fundamental terms used in option trading:
Strike Price (Exercise Price): The price at which the holder can buy or sell the underlying asset.
Expiry Date: The date on which the option contract expires.
Premium: The cost of buying an option.
In-the-Money (ITM): When exercising the option would be profitable.
At-the-Money (ATM): When the underlying price equals the strike price.
Out-of-the-Money (OTM): When exercising the option would not be profitable.
For example, if a trader buys a call option with a strike price of ₹200 and the stock trades at ₹250, the call option is in-the-money.

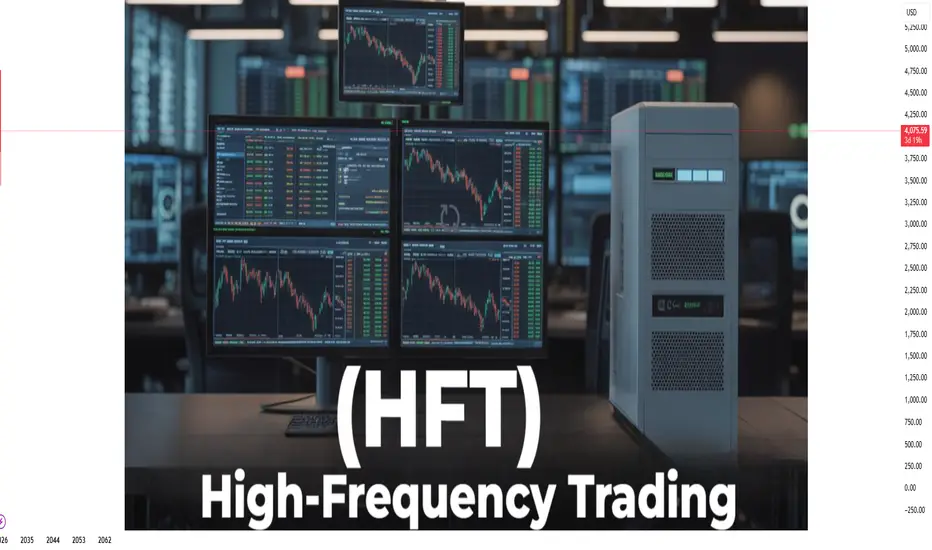
High-Frequency Trading (HFT) in the Indian MarketIntroduction
High-Frequency Trading (HFT) represents one of the most advanced and technology-driven forms of trading in modern financial markets. It relies on powerful algorithms, lightning-fast computers, and low-latency connections to execute a large number of orders within microseconds. In India, HFT has gradually become an integral part of the trading ecosystem, especially after the introduction of sophisticated trading infrastructure by exchanges like the National Stock Exchange (NSE) and the Bombay Stock Exchange (BSE). Though often controversial, HFT contributes significantly to liquidity, efficiency, and price discovery in Indian capital markets.
Understanding High-Frequency Trading (HFT)
HFT is a subset of algorithmic trading where computers make decisions to buy or sell securities based on pre-programmed instructions. The key distinction lies in speed — trades are executed in microseconds, a fraction of the time it takes a human to blink.
HFT algorithms analyze multiple market conditions such as order book depth, price trends, and volatility to identify fleeting profit opportunities. These opportunities often exist for mere milliseconds, so the ability to react faster than competitors determines success.
The backbone of HFT includes:
Colocation services – where trading firms place their servers close to exchange data centers to minimize latency.
Ultra-low latency networks – to ensure rapid data transmission and order execution.
High-speed data feeds – providing real-time updates on prices and market depth.
Evolution of HFT in India
HFT made its first appearance in India in the late 2000s, when the NSE introduced colocation services in 2010. This allowed institutional traders and brokers to place their servers within exchange premises, significantly reducing order execution times.
By 2012, the share of HFT and algorithmic trades in total market volume had reached approximately 30–40%, primarily led by institutional investors and proprietary trading firms.
Over the years, the Indian market has witnessed:
Growth of technology infrastructure – The NSE and BSE adopted advanced trading systems and low-latency networks.
Entry of domestic and global algorithmic trading firms – Many firms specializing in market making and statistical arbitrage began operating in India.
Regulatory oversight – The Securities and Exchange Board of India (SEBI) introduced several guidelines to ensure fairness and transparency, including mandatory audits, approval processes, and controls against manipulative practices.
Today, estimates suggest that over 50% of trades in Indian equity and derivatives markets involve some form of algorithmic or high-frequency trading activity.
How HFT Works
HFT firms rely on a combination of mathematics, computer science, and finance. The typical HFT process involves several stages:
Market Data Collection
HFT systems continuously collect tick-by-tick data from multiple sources – stock exchanges, news feeds, and global markets.
Signal Generation
Algorithms process this data using statistical models and machine learning techniques to identify potential trading opportunities, such as arbitrage or momentum signals.
Order Execution
Once a signal is generated, orders are executed automatically. HFT systems use smart order routing to send orders to the exchange with the best available price and liquidity.
Risk Management
Real-time risk monitoring ensures that exposure limits are not breached and that orders conform to regulatory and internal compliance standards.
Post-Trade Analysis
After trades are completed, systems analyze performance metrics to refine future strategies.
The entire cycle – from data analysis to trade execution – can occur within microseconds.
Popular HFT Strategies in the Indian Market
HFT encompasses various strategies, each designed to exploit short-term inefficiencies:
Market Making
Market makers continuously quote buy and sell prices to provide liquidity. They profit from the bid-ask spread and help reduce market volatility. Many Indian brokers engage in HFT-based market making on NSE’s derivatives and currency segments.
Statistical Arbitrage
This involves identifying mispricings between correlated assets or instruments. For example, if two stocks historically move together but temporarily diverge, HFT algorithms can exploit the spread before it converges again.
Index Arbitrage
HFT systems arbitrage between an index and its constituent stocks. For instance, if the Nifty 50 futures deviate from its underlying basket’s fair value, algorithms execute trades to capture the difference.
Latency Arbitrage
This strategy leverages speed advantages to exploit price discrepancies that exist for milliseconds between exchanges or instruments.
Event-Based Trading
HFT systems respond instantly to news events, economic data releases, or corporate announcements by analyzing sentiment and trading accordingly.
Liquidity Detection (Sniffing)
Some algorithms attempt to detect large hidden orders (iceberg orders) placed by institutional investors and trade strategically around them.
Infrastructure Enabling HFT in India
The success of HFT heavily depends on the trading infrastructure. Indian exchanges have developed world-class facilities to support low-latency trading:
Colocation Services: NSE and BSE offer colocation racks where brokers can install their trading servers next to the exchange’s systems.
Dedicated Leased Lines and Microwave Networks: For ultra-fast data transfer, firms use optical fiber or microwave links that minimize latency.
Advanced Matching Engines: Exchange engines are optimized to match orders in microseconds.
Smart Order Routers: These ensure that trades are executed at the best available price across multiple exchanges.
Regulatory Framework by SEBI
The Securities and Exchange Board of India (SEBI) has been proactive in regulating HFT to ensure fair and transparent markets. Some key guidelines include:
Colocation Access Norms (2010)
Exchanges were directed to ensure equal access to colocation facilities without favoritism.
Algorithmic Trading Approval (2012)
Brokers using algos must get each strategy approved by the exchange.
Order-to-Trade Ratio Limits (2015)
To discourage excessive order cancellations, SEBI set limits on the ratio of orders placed to trades executed.
Randomization of Order Processing (2017)
To reduce latency advantage, exchanges were asked to randomize the order queue slightly.
Audit and Reporting Requirements
Regular algorithmic audits ensure compliance with market integrity and prevent manipulative practices like spoofing or layering.
Latency Equalization Plans (LEP)
SEBI and exchanges have discussed measures to equalize latency across participants, ensuring that small brokers and retail investors are not disadvantaged.
Advantages of HFT in the Indian Market
Enhanced Liquidity
HFT provides continuous buy and sell orders, reducing bid-ask spreads and ensuring smoother price discovery.
Efficient Price Discovery
By reacting instantly to new information, HFT ensures that prices reflect available data faster.
Reduced Transaction Costs
Higher liquidity translates into tighter spreads, benefiting all market participants.
Improved Market Depth
HFT firms add orders at multiple price levels, enhancing overall market depth and stability.
Technological Advancement
The presence of HFT has encouraged Indian exchanges and brokers to adopt cutting-edge technology and infrastructure.
Risks and Criticisms
Despite its advantages, HFT has drawn criticism due to concerns about fairness, stability, and manipulation.
Market Manipulation
Practices like “spoofing” (placing fake orders) or “quote stuffing” (flooding the market with orders to slow competitors) can distort prices.
Systemic Risk
A malfunctioning algorithm can trigger flash crashes. The 2012 Knight Capital incident in the U.S. and minor glitches in Indian markets highlight this risk.
Unequal Access
Large institutions with access to colocation enjoy a speed advantage over smaller brokers and retail traders, raising fairness concerns.
Reduced Investor Confidence
Rapid and unexplained price movements may discourage long-term investors.
Regulatory Complexity
Constant monitoring and evolving technology make regulation challenging for SEBI and exchanges.
Case Studies and Incidents
NSE Co-location Controversy (2015–2018)
Allegations emerged that certain brokers received unfair access to NSE’s trading systems via colocation, giving them a latency advantage. SEBI imposed fines on NSE and directed reforms to ensure transparency.
Flash Crashes and Volatility Events
On several occasions, Indian markets witnessed sudden sharp movements attributed to algorithmic errors. For instance, in October 2012, a rogue algorithm triggered a 15% intraday fall in Nifty, causing temporary panic before recovery.
These incidents emphasized the need for robust surveillance and fail-safes.
The Role of HFT in Derivatives and Currency Markets
HFT plays a particularly vital role in futures, options, and currency derivatives, where speed and liquidity are crucial.
In the Nifty futures segment, HFT accounts for nearly 40–50% of the trading volume.
In currency derivatives, HFT improves market depth and helps maintain efficient exchange rate discovery.
By arbitraging between futures, options, and cash markets, HFT participants ensure alignment in prices across instruments.
Impact on Retail and Institutional Investors
For retail investors, HFT’s influence is both positive and negative:
Positive: Better liquidity, tighter spreads, and faster execution.
Negative: Limited ability to compete on speed; occasional volatility spikes may trigger stop-losses.
Institutional investors, on the other hand, leverage algorithmic systems for better execution and reduced slippage, often partnering with HFT firms for liquidity provision.
Technological Trends Shaping the Future of HFT
The next decade of HFT in India will be shaped by:
Artificial Intelligence (AI) and Machine Learning – Algorithms capable of adaptive decision-making and predictive analytics.
Quantum Computing – Offering potentially exponential speed gains.
Blockchain and Distributed Ledger Technology – Could revolutionize trade settlements.
5G and Edge Computing – Further reducing latency for real-time data transmission.
Integration of Global Markets – Cross-border HFT strategies as regulatory harmonization improves.
Future Outlook of HFT in India
The future of HFT in India is promising yet requires balanced oversight.
SEBI’s regulatory vigilance ensures that technology-driven efficiency doesn’t come at the cost of fairness or stability. With the Digital India initiative, expanding broadband infrastructure, and growing fintech innovation, India is set to witness a new wave of algorithmic sophistication.
HFT will likely extend beyond equities into commodities, bonds, and crypto-like regulated digital assets once frameworks evolve. However, the emphasis must remain on equal access, ethical algorithm design, and investor protection.
Conclusion
High-Frequency Trading has transformed India’s financial landscape, introducing speed, precision, and efficiency at unprecedented levels. While it brings liquidity and innovation, it also introduces challenges of fairness, stability, and ethical conduct.
The Indian regulatory system, guided by SEBI and supported by exchanges like NSE and BSE, continues to evolve to strike the right balance between technological progress and market integrity.
In the years ahead, as technology continues to reshape trading, HFT will remain a defining force in India’s journey toward becoming a globally competitive, transparent, and technology-driven financial market.
Smart Liquidity Trading Strategies1. Understanding Market Liquidity
Market liquidity refers to the ease with which an asset can be converted to cash at a stable price. High liquidity implies narrow bid-ask spreads, large volumes, and low volatility for a given transaction size, while low liquidity involves wider spreads, lower volume, and higher volatility. Understanding liquidity is crucial for trading strategies because:
Liquidity affects execution costs.
Illiquid markets are prone to sharp price moves.
Market participants’ behavior can create temporary liquidity imbalances, which smart traders exploit.
Liquidity can be categorized into:
Natural liquidity – The existing supply and demand for an asset.
Hidden liquidity – Orders that are not visible in the order book but can influence prices, such as iceberg orders.
Synthetic liquidity – Created by market participants through strategies like high-frequency trading (HFT) or algorithmic trading.
2. Types of Liquidity Trading Strategies
Smart liquidity trading strategies can be broadly classified into several types:
2.1 Order Book Analysis
The order book shows the real-time buy (bid) and sell (ask) orders. Smart traders analyze the order book to detect liquidity clusters:
Support and Resistance Liquidity Zones: Large order clusters act as barriers to price movement. If the buy-side has a significant volume, it can provide support. Conversely, large sell orders can act as resistance.
Order Flow Imbalances: When the number of aggressive buy orders exceeds sell orders, it can indicate potential upward price pressure, and vice versa.
Tools such as depth-of-market (DOM) screens, Level II quotes, and heatmaps allow traders to visualize these liquidity zones.
2.2 Volume-Weighted Strategies
Volume is a direct proxy for liquidity. Smart liquidity traders often use volume-weighted techniques:
Volume Weighted Average Price (VWAP) Trading: VWAP is the average price of a security weighted by its traded volume. Traders aim to buy below or sell above VWAP to minimize market impact.
Liquidity-Seeking Algorithms: Large institutional orders are split and executed in small portions based on current liquidity to avoid slippage. Algorithms like VWAP, TWAP (Time-Weighted Average Price), and POV (Percentage of Volume) are commonly used.
2.3 Price Action and Liquidity Gaps
Liquidity gaps occur when the order book is thin at certain price levels. Smart traders exploit these gaps:
Breakout Trading: Thin liquidity areas often allow prices to accelerate quickly once the barrier is breached.
Stop-Hunting Strategies: Large participants sometimes trigger liquidity pools (stop-loss clusters) to create favorable price movements. Traders who understand liquidity dynamics can anticipate these zones.
2.4 High-Frequency and Algorithmic Liquidity Strategies
High-frequency traders (HFTs) specialize in identifying and exploiting transient liquidity imbalances. Examples include:
Market-Making: Providing liquidity by continuously quoting buy and sell prices and profiting from the spread.
Latency Arbitrage: Exploiting delays in price updates across exchanges or trading venues.
Liquidity Sniping: Targeting hidden orders when they are partially revealed or exposed due to large market moves.
2.5 Cross-Market and Cross-Asset Liquidity Trading
Liquidity is not confined to a single market. Smart traders examine correlations between markets:
Equity and Derivative Pairs: For example, the liquidity in index futures can provide insights into the underlying stocks’ potential moves.
Forex and Commodity Cross-Market Liquidity: Major currency pairs often exhibit predictable liquidity patterns, which can influence commodity prices, like oil or gold.
ETF Arbitrage: When ETF liquidity diverges from its underlying basket, traders can exploit the mispricing efficiently.
3. Smart Tools for Liquidity Analysis
Successful liquidity trading requires advanced tools and data sources:
Order Book and Level II Data: Visualizing real-time buy/sell orders and depth helps identify liquidity clusters and thin zones.
Volume Heatmaps: Identify where significant trading activity is occurring across price levels.
Liquidity Aggregators: Tools that combine order book data across multiple exchanges to provide a consolidated view.
Algorithmic Platforms: Automated execution minimizes slippage and optimizes order placement according to liquidity conditions.
News and Event Scanners: Market liquidity often changes during economic releases, corporate earnings, or geopolitical events. Monitoring these can prevent adverse execution.
4. Liquidity Timing Strategies
Timing is crucial in liquidity trading. Smart traders often consider:
Market Open and Close: Liquidity is often thin at market open, leading to high volatility. Conversely, liquidity peaks near close due to institutional rebalancing.
Intraday Patterns: Volume spikes are common at certain times of the day (e.g., after economic news). Traders can use these predictable patterns.
Event-Based Liquidity: Earnings announcements, central bank decisions, and geopolitical events create temporary liquidity vacuums or surges.
5. Risk Management in Liquidity Trading
While liquidity strategies can be profitable, they carry specific risks:
Execution Risk: Entering or exiting positions in illiquid markets may lead to slippage or partial fills.
Market Impact Risk: Large orders in thin markets can move prices against the trader.
Counterparty Risk: Over-reliance on automated systems or brokers may lead to failure if liquidity vanishes unexpectedly.
Overnight Risk: Illiquid positions held overnight can be vulnerable to gaps in price movement.
Smart liquidity traders manage these risks using:
Order Slicing: Breaking large trades into smaller orders to avoid price impact.
Stop-Loss Placement: Strategic placement in liquid zones to reduce adverse execution.
Diversification: Trading multiple correlated instruments to distribute liquidity risk.
Automated Monitoring: Alert systems to detect liquidity shifts and adjust execution dynamically.
6. Psychological and Behavioral Insights
Liquidity trading is not just technical; market psychology plays a key role:
Traders often herd around visible liquidity pools, creating predictable patterns.
Understanding the behavior of institutional participants, such as how they hide large orders, can give retail traders a strategic advantage.
Market sentiment can create sudden liquidity droughts, which savvy traders can exploit by anticipating crowd behavior.
7. Practical Examples of Smart Liquidity Strategies
Example 1: VWAP Execution
An institutional trader needs to buy 1 million shares without moving the market.
The algorithm executes trades according to intraday volume, ensuring the average price is near VWAP, minimizing slippage.
Example 2: Liquidity Gap Breakout
A stock shows a thin order book at a certain price level due to low participation.
A trader places a breakout order just above the liquidity gap, allowing rapid execution as the price accelerates through the thin zone.
Example 3: Cross-Market Arbitrage
ETF price deviates from its underlying basket due to temporary liquidity shortage.
Trader buys the cheaper asset and sells the overvalued counterpart, profiting as prices converge once liquidity returns.
Example 4: Stop-Loss Liquidity Pool Hunting
Large institutional stops often cluster near round numbers.
Smart traders identify these clusters and position accordingly, entering slightly before the expected cascade to benefit from the resulting liquidity surge.
8. Advanced Considerations
Hidden Liquidity: Iceberg orders and dark pools hide true market depth. Advanced traders use predictive analytics to estimate hidden volumes.
Liquidity Fragmentation: Markets are fragmented across multiple exchanges and dark pools. Consolidated data helps detect where liquidity is concentrated.
Dynamic Liquidity Modeling: Using AI and machine learning to predict how liquidity responds to price moves, news, and market sentiment.
9. Key Principles for Smart Liquidity Trading
Observe, Don’t Chase: Liquidity dynamics often reveal intentions of larger players. Observing patterns is more effective than aggressive chasing.
Minimize Market Impact: Use algorithms and staggered executions to preserve favorable prices.
Adapt to Market Conditions: Liquidity is dynamic; strategies must adjust intraday.
Leverage Technology: Automation, analytics, and high-speed data feeds are essential.
Integrate Risk Management: Smart liquidity trading combines precision entry, execution efficiency, and rigorous risk controls.
10. Conclusion
Smart liquidity trading strategies focus on understanding and leveraging the flow of market liquidity rather than simply predicting price direction. By analyzing order books, volume, cross-market activity, and behavioral patterns, traders can execute efficiently, reduce slippage, and identify profitable opportunities hidden in the market structure. These strategies require a combination of analytical skill, technological tools, and disciplined risk management. As markets evolve and liquidity becomes more fragmented, mastery of liquidity dynamics increasingly distinguishes professional traders from casual participants. The essence of smart liquidity trading lies in respecting the invisible currents of supply and demand, positioning oneself ahead of major flows, and executing with surgical precision.

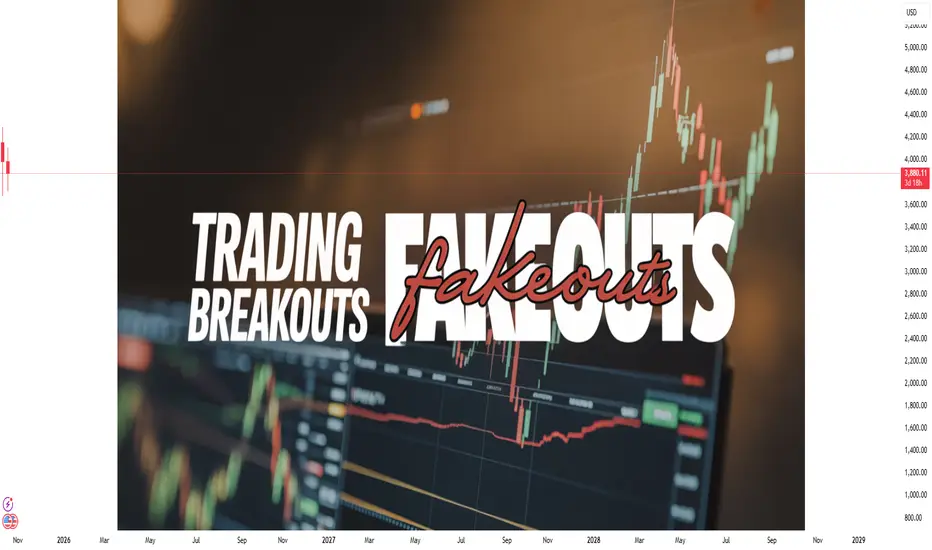
Trading Breakouts and Fakeouts: An In-Depth Analysis1. Understanding Breakouts
A breakout occurs when the price of an asset moves beyond a defined support or resistance level with increased volume. These levels act as psychological barriers where buyers or sellers have historically exerted control. A breakout signals a potential new trend and can present a lucrative trading opportunity.
Support Level: A price level where buying interest is strong enough to prevent further decline.
Resistance Level: A price level where selling pressure exceeds buying interest, preventing further ascent.
Breakouts indicate that the equilibrium between supply and demand has shifted, creating a momentum-driven price movement. Traders look for these opportunities as the market often continues moving in the breakout direction, at least in the short term.
Types of Breakouts
Upside Breakout: Occurs when the price moves above a resistance level. Often seen as a bullish signal indicating further upward movement.
Downside Breakout: Happens when the price falls below a support level. This is a bearish signal suggesting continued downward pressure.
Volatility Breakout: Happens when price moves beyond a consolidation range, indicating increased volatility.
Pattern-Based Breakout: Triggered by the completion of chart patterns such as triangles, head-and-shoulders, flags, or rectangles.
2. Factors Driving Breakouts
Breakouts are not random; several market factors contribute to their formation:
Fundamental Drivers: News releases, earnings reports, economic data, geopolitical events, or monetary policy announcements can trigger a breakout.
Technical Triggers: Long-term resistance or support levels, trendlines, and chart patterns attract attention from technical traders, amplifying price movements.
Volume Confirmation: A genuine breakout is usually accompanied by a significant increase in trading volume, signaling strong market interest and conviction.
Market Sentiment: Collective trader psychology plays a role. Fear and greed can accelerate breakouts as traders rush to capitalize on perceived opportunities.
3. Breakout Trading Strategies
Effective breakout trading relies on proper timing, risk management, and confirmation. Below are widely used strategies:
A. Entry Techniques
Wait for Close Beyond Level: Traders often wait for the price to close beyond the support/resistance level rather than reacting to intraday spikes.
Volume Confirmation: Look for above-average trading volume to confirm the breakout's strength.
Breakout Pullback: Sometimes, prices retest the breakout level. Entering after a successful retest can reduce false signals.
B. Risk Management
Stop Loss Placement: Place stop-loss orders slightly below the breakout point for long positions and above for short positions.
Position Sizing: Limit exposure to reduce the impact of sudden reversals.
Target Projection: Measure the height of the previous consolidation range to project price targets post-breakout.
C. Timeframe Consideration
Breakout signals vary across timeframes. Higher timeframes (daily, weekly) tend to offer more reliable breakouts, whereas intraday breakouts (5-min, 15-min charts) are more prone to fakeouts.
4. Understanding Fakeouts
A fakeout is a false breakout where the price moves beyond a key level but quickly reverses direction. Fakeouts can trap traders who enter positions prematurely, leading to losses. Recognizing fakeouts is essential to avoid falling into “breakout traps.”
Why Fakeouts Happen
Liquidity Hunting: Large institutional players may push prices beyond levels temporarily to trigger stop-loss orders of retail traders, then reverse.
Market Manipulation: In illiquid markets, price can be deliberately pushed to create misleading breakouts.
Psychological Reactions: Traders’ overconfidence can lead to impulsive entries, resulting in fakeout scenarios.
Lack of Volume: Breakouts without sufficient volume often fail to sustain, reverting to previous levels.
Common Fakeout Patterns
False Break Above Resistance: Price breaches resistance, but selling pressure soon overwhelms buyers.
False Break Below Support: Price dips below support, only to rebound as buying interest returns.
Wicks or Shadows: Candlestick charts often show long upper or lower shadows indicating rejection at breakout levels.
5. Identifying Fakeouts vs Genuine Breakouts
Differentiating between fakeouts and genuine breakouts requires careful observation:
Volume Analysis: Genuine breakouts are typically supported by strong volume. Low volume breakouts are more likely fakeouts.
Price Action Confirmation: Wait for consecutive closes beyond the level to confirm strength.
Market Context: Analyze broader trends and sentiment. Breakouts in alignment with trends are more reliable.
Indicators: Technical indicators such as RSI, MACD, and Bollinger Bands can provide clues. Divergence or overbought/oversold conditions may hint at potential fakeouts.
Timeframe Cross-Check: Confirm breakouts across multiple timeframes to ensure authenticity.
6. Psychological Aspects of Breakouts and Fakeouts
Trader psychology plays a pivotal role in breakouts and fakeouts:
Herd Mentality: Traders tend to follow momentum blindly, contributing to breakout acceleration or fakeout formation.
Fear and Greed: Overreaction to news or technical signals can trigger impulsive trades.
Confirmation Bias: Traders may convince themselves a breakout is genuine despite contrary signals, increasing susceptibility to fakeouts.
Patience and Discipline: Waiting for confirmation rather than entering prematurely is critical to successful breakout trading.
7. Risk Management Techniques for Breakout Trading
Breakout trading carries inherent risk. Effective strategies include:
Stop Loss Discipline: Placing stop-loss orders near the breakout point prevents large losses.
Diversification: Avoid overexposure to a single asset or breakout signal.
Trailing Stops: Protect profits by moving stops in the breakout direction.
Scaling In and Out: Gradually increase position size as the breakout proves itself, and consider partial exits at price targets.
8. Practical Examples
Example 1: Upside Breakout
Suppose a stock repeatedly tests resistance at $50. One day, it closes at $52 with high volume. Traders who enter the trade expect a continued upward trend. If the breakout is genuine, the price may climb to $60, with stop-losses placed just below $50.
Example 2: Fakeout
The same stock tests $50, briefly spikes to $52, but then falls back below $50 within hours. Traders who entered during the spike are trapped. Observing low volume and short-lived candlestick patterns could have prevented this loss.
9. Tools to Enhance Breakout Trading
Volume Indicators: On-Balance Volume (OBV), Volume Oscillator.
Trend Indicators: Moving Averages, MACD.
Volatility Indicators: Bollinger Bands, ATR (Average True Range).
Chart Patterns: Triangles, Flags, Pennants, Rectangles.
Candlestick Patterns: Engulfing patterns, Pin Bars, Doji formations.
10. Combining Breakout Trading with Other Strategies
Momentum Trading: Breakouts often align with momentum strategies. Combining them can enhance success rates.
Trend Following: Breakouts within strong trends are more likely genuine, offering high-probability trades.
Swing Trading: Breakout and fakeout analysis helps swing traders identify optimal entry and exit points.
Scalping: Intraday traders can exploit small breakout movements but must remain vigilant for fakeouts.
11. Common Mistakes in Breakout Trading
Entering Too Early: Jumping in before confirmation increases exposure to fakeouts.
Ignoring Volume: Trading breakouts without volume analysis often leads to losses.
Overleveraging: Using high leverage on breakouts can amplify losses during reversals.
Failure to Adjust Stops: Not trailing stop-losses or adjusting targets can erode profits.
Neglecting Market Context: Breakouts against the trend are riskier and more likely to fail.
12. Conclusion
Breakout and fakeout trading are fundamental concepts in technical analysis that offer lucrative opportunities when approached strategically. Breakouts signal market shifts and potential trend formations, while fakeouts remind traders of the risks associated with premature or misinformed entries. Successful trading requires a combination of:
Technical skills (chart analysis, pattern recognition, volume study)
Psychological discipline (patience, fear management, avoiding herd behavior)
Risk management (stop-loss placement, position sizing, diversification)
By understanding market mechanics, observing price and volume behavior, and integrating breakout and fakeout strategies with other trading techniques, traders can navigate financial markets more confidently and minimize the pitfalls of false signals. Ultimately, mastering breakouts and fakeouts equips traders with a sharper lens through which to interpret market movements and maximize returns.

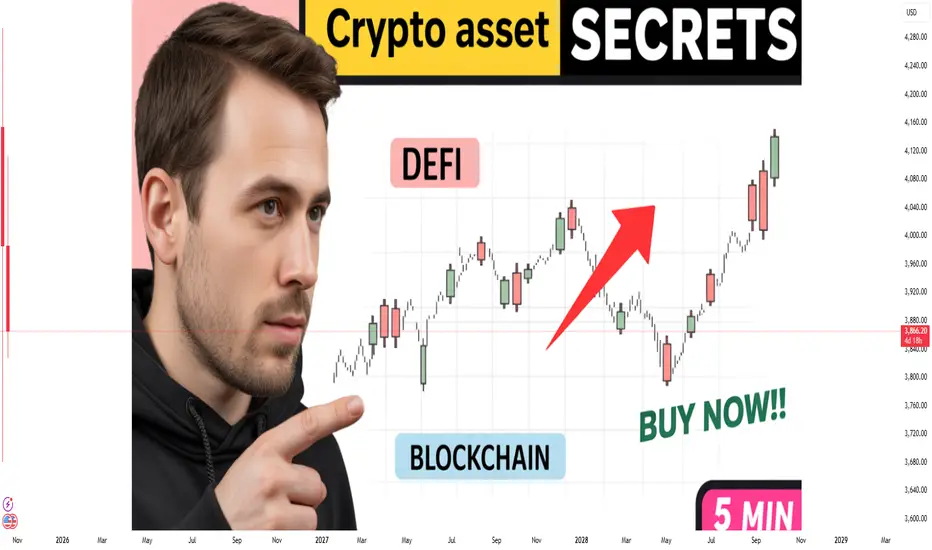
Crypto Assets Secrets: The Hidden Dynamics of Digital WealthIntroduction
Over the past decade, crypto assets have transformed from a fringe experiment in digital money into a multitrillion-dollar financial ecosystem that challenges the traditional boundaries of economics, finance, and technology. Bitcoin’s mysterious emergence in 2009 under the pseudonym Satoshi Nakamoto sparked a global phenomenon, laying the foundation for an entirely new asset class known as crypto assets or digital assets. While the world has widely discussed cryptocurrencies like Bitcoin and Ethereum, the secrets behind crypto assets—how they derive value, operate, and influence financial systems—remain misunderstood by many.
This essay unveils the hidden dimensions of crypto assets, exploring their technological foundations, economic mechanisms, market dynamics, investment secrets, and the strategic shifts they are inducing in global finance.
1. Understanding Crypto Assets
A crypto asset is a digital representation of value that operates on blockchain technology and uses cryptography for security, verification, and transaction validation. Unlike fiat currencies, crypto assets are decentralized, meaning they are not issued or controlled by central banks or governments. They rely instead on distributed networks of computers (nodes) that collectively maintain the integrity of the ledger.
Crypto assets can be broadly divided into three main categories:
Cryptocurrencies – digital currencies used primarily as a medium of exchange (e.g., Bitcoin, Litecoin).
Utility tokens – tokens granting access to services within blockchain ecosystems (e.g., Ethereum’s ETH for gas fees).
Security and asset-backed tokens – representing ownership or rights to assets like equity, real estate, or commodities (e.g., tokenized stocks or gold).
Behind these classifications lies a deeper secret: the tokenization of value. Blockchain allows almost any form of asset—tangible or intangible—to be represented, traded, and fractionalized digitally, unlocking unprecedented liquidity and accessibility in global finance.
2. The Secret of Blockchain Technology
At the heart of every crypto asset lies blockchain technology, a decentralized digital ledger that records transactions in immutable “blocks.” The blockchain’s transparency, security, and decentralization are its core strengths.
The secret behind blockchain’s power is its consensus mechanism—the process by which distributed participants agree on the state of the ledger. Common mechanisms include:
Proof of Work (PoW) – miners solve complex mathematical puzzles to validate transactions (used by Bitcoin).
Proof of Stake (PoS) – validators lock up coins (“stake”) to earn the right to confirm transactions (used by Ethereum 2.0).
Delegated Proof of Stake (DPoS) and Proof of Authority (PoA) – more energy-efficient models emphasizing speed and scalability.
These consensus methods ensure that no single entity can alter records, creating a trustless system where integrity is mathematically guaranteed rather than institutionally enforced. This underpins the revolutionary concept of decentralized trust, which is one of the most powerful secrets of crypto assets.
3. Value Creation and Scarcity: The Economic Secret
Traditional assets derive value from underlying cash flows, commodities, or sovereign guarantees. Crypto assets, however, derive value from mathematical scarcity and network utility.
For example, Bitcoin’s total supply is capped at 21 million coins, making it a deflationary asset. This digital scarcity mimics the rarity of gold, positioning Bitcoin as “digital gold” and a hedge against inflation. Ethereum’s value, meanwhile, stems from its programmable utility—its blockchain powers thousands of decentralized applications (dApps) and smart contracts.
The economic secret is that crypto assets merge scarcity with utility. A token that is both scarce and useful tends to appreciate in value as network adoption grows—a phenomenon described by Metcalfe’s Law, which states that the value of a network is proportional to the square of its number of users.
4. The Secret Power of Decentralization
One of the most revolutionary aspects of crypto assets is decentralization—the removal of intermediaries like banks, brokers, or governments. In decentralized finance (DeFi), users can lend, borrow, trade, or invest directly using smart contracts without third-party oversight.
This system operates 24/7, globally, with transparent and automated processes. The secret advantage of decentralization is permissionless innovation: anyone can build or access financial services without seeking institutional approval. This democratizes finance and opens opportunities to billions of unbanked individuals worldwide.
However, decentralization comes with challenges—governance disputes, code vulnerabilities, and regulatory uncertainty—which form part of the hidden risks behind the promise of crypto wealth.
5. Crypto Market Dynamics: Secrets of Volatility and Manipulation
Crypto markets are notoriously volatile. Prices can rise or fall by double digits in a single day. This volatility is often misunderstood as pure speculation, but it also reflects deeper structural characteristics:
Low liquidity compared to traditional markets.
High leverage in derivatives and margin trading.
Whale activity—large holders who can manipulate prices.
News-driven sentiment amplified by social media and influencer culture.
A lesser-known secret is the role of algorithmic trading and market-making bots, which dominate exchanges and create rapid micro-fluctuations. Additionally, because crypto operates globally without a centralized regulator, price discovery is influenced by multiple fragmented exchanges.
To navigate this landscape, experienced investors rely on on-chain analysis, which examines blockchain data—wallet activity, token flows, and network metrics—to anticipate market trends beyond traditional charting methods.
6. Secrets of Crypto Investing and Portfolio Strategy
Successful crypto investing requires understanding not just price trends but fundamental blockchain metrics, including transaction volume, developer activity, tokenomics, and governance models.
Key strategies and their underlying “secrets” include:
HODLing – Long-term holding of high-conviction assets like Bitcoin or Ethereum, based on belief in their future dominance.
Staking – Earning passive income by locking coins to secure networks in PoS systems.
Yield farming – Lending or providing liquidity to DeFi protocols in exchange for rewards; highly profitable but risky.
NFT and metaverse investing – Speculating on digital ownership and virtual real estate.
Diversification – Allocating across blockchains, stablecoins, and DeFi projects to mitigate volatility.
Another secret is tokenomics, the economic design of a crypto project—how tokens are distributed, used, burned, or minted. Projects with transparent, sustainable tokenomics tend to outperform those with inflationary or centralized token supplies.
7. Hidden Risks and Security Secrets
While the crypto revolution promises freedom and profits, it hides complex security risks. Common vulnerabilities include:
Exchange hacks – centralized platforms holding billions in user assets are frequent targets.
Smart contract exploits – coding bugs that allow attackers to drain funds.
Phishing and social engineering – scams exploiting user ignorance or greed.
Private key loss – once lost, access to crypto wallets is permanently gone.
The security secret lies in self-custody—owning and protecting private keys through hardware wallets and multi-signature security models. Decentralized exchanges (DEXs) also enhance safety by allowing users to retain control of their assets during trading.
Another layer of defense is zero-knowledge proofs (ZKPs), a cryptographic innovation enabling transactions to be verified without revealing sensitive data. This technology is paving the way for privacy-preserving and scalable blockchains.
8. The Regulatory Secret: Balancing Innovation and Control
Governments worldwide are grappling with how to regulate crypto assets. The tension lies between fostering innovation and preventing financial crimes like money laundering or tax evasion.
The secret insight is that regulation is inevitable but potentially beneficial. Clear frameworks attract institutional investors who previously avoided crypto due to legal uncertainty. Countries like Singapore, Switzerland, and the UAE have leveraged crypto-friendly regulations to become global blockchain hubs.
Meanwhile, central banks are experimenting with Central Bank Digital Currencies (CBDCs)—state-issued digital currencies that adopt blockchain principles without decentralization. This reveals a paradoxical secret: the technology that began as a rebellion against centralization may ultimately reshape central banking itself.
9. The Institutional and Technological Shift
The entry of institutional players—hedge funds, asset managers, and public corporations—marks a new phase in crypto maturity. Companies like MicroStrategy, Tesla, and BlackRock have integrated Bitcoin into their balance sheets or fund offerings. This institutional endorsement signals that crypto is evolving from speculative trading to a legitimate asset class.
Behind the scenes, major innovations such as layer-2 scaling, interoperability protocols (Polkadot, Cosmos), and tokenized real-world assets (RWA) are redefining the boundaries of blockchain utility. These technologies aim to solve scalability bottlenecks and connect fragmented blockchains, enabling a seamless decentralized financial ecosystem.
The secret lesson here is convergence—the merging of traditional finance (TradFi) and decentralized finance (DeFi) into a hybrid model known as “CeDeFi”, where institutions adopt blockchain efficiencies while retaining regulatory compliance.
10. The Psychological Secret of Crypto Adoption
Crypto markets are not driven purely by technology—they are driven by belief and psychology. The phenomenon of community-driven growth, often seen in projects like Dogecoin or Shiba Inu, demonstrates how narratives and memes can mobilize collective sentiment into market capitalization worth billions.
The psychological secret lies in network belief—the idea that value in crypto is sustained by the confidence of its holders. When enough participants believe a token has worth, it self-validates through market demand. This blend of behavioral finance and digital community dynamics gives crypto its cultural power.
11. Environmental and Ethical Secrets
Critics argue that proof-of-work mining consumes enormous energy, raising concerns about sustainability. However, the hidden side of this debate is technological evolution. Newer blockchains are adopting energy-efficient consensus models, and Bitcoin mining is increasingly powered by renewable energy sources.
Moreover, the crypto industry is becoming a driver of green innovation—through tokenized carbon credits, renewable energy financing, and blockchain-based ESG tracking. Thus, the secret lies not in rejecting crypto’s environmental footprint but in harnessing it for sustainability solutions.
12. The Future Secrets of Crypto Assets
The future of crypto assets will be shaped by several converging trends:
Tokenization of real-world assets – turning stocks, real estate, and commodities into blockchain tokens for global access.
AI-driven smart contracts – merging artificial intelligence with blockchain for self-optimizing systems.
Cross-chain interoperability – seamless transfer of assets across different networks.
Decentralized identity (DID) – enabling privacy-preserving authentication and digital citizenship.
Institutional-grade custody and compliance – bridging crypto with traditional finance infrastructure.
The deeper secret is that crypto assets represent more than an investment trend—they are the foundation of a new digital economy built on transparency, inclusivity, and programmable trust.
Conclusion
The secrets of crypto assets lie not in hidden codes or mysterious markets, but in the profound reimagining of how humans define, exchange, and secure value. From decentralized trust and mathematical scarcity to programmable finance and tokenized ownership, crypto assets are revolutionizing global systems at every level.
Yet, with this transformation comes both opportunity and responsibility. Understanding these secrets allows investors, policymakers, and technologists to participate wisely in shaping a future where financial power is distributed, transparent, and resilient. As blockchain innovation continues to unfold, the true secret may be this: crypto assets are not just changing finance—they are redefining the very architecture of trust in the digital age.
What is a Double Top Pattern?What is a Double Top Pattern?
In technical analysis, a double top is a common chart pattern that signals a potential reversal from an uptrend to a downtrend. It forms when the price reaches a high point (the first top), pulls back to a support level (the trough or neckline), and then rises again to a similar high (the second top) before declining. Visually, it looks like the letter "M."
This pattern can appear on any timeframe, including hourly charts, but on an hourly basis, it typically indicates shorter-term reversals, often influenced by intraday trading dynamics.
Technical Analysis
The provided hourly chart of Ethereum Perpetual Futures (ETH/USD) from TradingView, dated October 21, 2025, displays a classic double bottom pattern, which is a bullish reversal indicator. This "W"-shaped formation occurs after a downtrend, with two roughly equal lows (around $3,600–$3,700) separated by a peak, signaling potential exhaustion of selling pressure and a shift to buyer control.
Pattern Details: The first bottom forms after an initial decline, followed by a rally to a neckline resistance (approximately $4,200). The price then retraces to form the second bottom before attempting another breakout. Confirmation typically requires a close above the neckline with increased volume, projecting an upside target equal to the pattern's height (roughly $600, suggesting a move toward $4,200 + $600 = $4,800).
Current Price Action: As of October 21, 2025, ETH is trading around $3,890–$4,031, with a recent 24-hour decline of -3.53%. The chart shows volatility, with candles fluctuating between $3,600 and $4,260. Support levels are at $3,800–$3,900 (recent lows), while resistance sits at $4,100–$4,200 (neckline and recent highs).
Indicators:
Moving Averages: The 50-hour MA is around $4,000, acting as immediate resistance; a crossover above could signal strength. The 200-hour MA near $3,900 provides support.
RSI (Relative Strength Index): Likely in the 40–50 range (neutral), indicating no overbought conditions but potential for upward momentum if it climbs above 60.
MACD: Recent searches suggest a flattening or bearish crossover in short-term charts, pointing to consolidation, but on-chain data shows whale accumulation (80K+ ETH off exchanges), supporting a bullish bias.
Volume: Trading volume is high at $32B (24h), but recent outflows from ETFs ($145M) could pressure short-term moves.
Broader Technical Outlook: Multiple analyses indicate ETH stalling below $4,000, with risks of a drop to $3,800 if support fails. However, historical October gains (avg. 4.77%) and projections from sources like Changelly (fluctuating $4,001–$4,625) and CoinCodex (up to $4,358 by Oct 27) lean bullish. A break above $4,200 could target $4,500–$4,800 by end-October, while failure might retest $3,700.
Fundamental Analysis
Ethereum's fundamentals remain robust, driven by network upgrades, institutional adoption, and ecosystem growth, though short-term headwinds like ETF outflows and geopolitical tensions exist.
Network Activity: Q3 2025 saw major upgrades, including a gas limit increase to 45M and preparations for the Fusaka upgrade (December 2025), enabling 8x Layer 2 throughput via PeerDAS. Developer growth hit 16K+ new contributors in 2025, with DEX volume surging 47% to $33.9B weekly. Stablecoin growth and record dev activity bolster long-term value.
Institutional Factors: Spot ETH ETFs hold $27.63B in AUM (up from $10.13B in July), but recent outflows ($145M on Oct 20) signal caution. BlackRock's ETHA accumulated $1.4B since Oct 1, and whales pulled 80K+ ETH off exchanges (lowest supply since 2016), indicating accumulation.
Macro Influences: Fed signals for a modest rate cut in late October could boost risk assets. However, U.S.-China trade tensions (new tariffs Nov 1) sparked pullbacks. Vitalik Buterin praised Polygon's contributions, enhancing optimism, but North Korean hackers using ETH for malware adds negative press.
Market Metrics: Market cap at $469B (rank #2), with 120.7M ETH in circulation. Projections from Standard Chartered target $7,500 by year-end 2025, citing ETF inflows and regulatory progress like the GENIUS Act.
Overall, fundamentals support growth, with analysts eyeing $4,300–$4,500 by end-October if ETF inflows resume.
Sentiment Analysis
Sentiment around Ethereum is mixed but leans neutral-to-bullish, based on social media, community polls, and market indicators.
X (Twitter) Sentiment: From recent posts (Oct 1–21, 2025), 55% express bullish views (e.g., expectations of a breakout to $4,800–$6,000, whale accumulation, and support at $3,900), 30% bearish (short-term weakness below $4,000, RSI overbought), and 15% neutral (sideways consolidation). Key themes: Optimism on upgrades and ETF demand, but caution on volatility and macro risks. Community sentiment on CoinGecko is "bullish today" (79%), despite price declines.
Broader Market Sentiment: Fear & Greed Index at 30 (rising fear), with options flows showing hedging for downside. Prediction markets like EveryX give 76% probability of ETH hitting $5,000 by end-2025. Social chatter lacks aggressive buying but highlights defensive moves, with MVRV below average warning of short-term risks.
On-Chain Signals: Declining spot volume and open interest suggest sidelined bulls, but OBV (On-Balance Volume) trends negative, aligning with cautious sentiment. Overall, long-term conviction is high (e.g., institutional holding), but short-term nerves prevail.
Trend Prediction
Based on the double bottom pattern in the chart (bullish reversal), strong fundamentals (upgrades, accumulation), and predominantly optimistic sentiment despite short-term volatility, the overall trend for Ethereum is upward. Short-term consolidation or a minor pullback to $3,800–$3,900 is possible due to resistance at $4,000–$4,200 and recent outflows, but a confirmed breakout above the neckline could drive ETH toward $4,500–$4,800 by end-October 2025. Longer-term (Q4 2025), targets of $5,000–$6,000 appear achievable if macro conditions improve. Always monitor volume and news for confirmation—crypto markets are volatile.

Carbon Credits and ESG Investing1. Understanding Carbon Credits
1.1 Definition
A carbon credit is a tradable certificate or permit that represents the right to emit one ton of carbon dioxide (CO₂) or an equivalent amount of another greenhouse gas (GHG). Essentially, it is a financial instrument designed to cap emissions while incentivizing reductions. Carbon credits are central to market-based approaches for controlling global carbon emissions.
1.2 Types of Carbon Credits
Carbon credits can be broadly classified into two categories:
Compliance Carbon Credits:
These are generated and traded under mandatory national or international regulatory frameworks, such as the European Union Emissions Trading System (EU ETS) or the Kyoto Protocol mechanisms. Companies exceeding emission limits can purchase credits to meet compliance.
Voluntary Carbon Credits:
These are used by companies or individuals on a voluntary basis to offset emissions beyond regulatory requirements. The voluntary market supports projects like reforestation, renewable energy, and methane capture.
1.3 Mechanism of Carbon Credits
The carbon credit system operates on the “cap-and-trade” principle:
Cap: Governments or regulatory bodies set a cap on total carbon emissions for specific sectors or organizations.
Allocation: Companies are allocated emission allowances equivalent to the cap.
Trade: If a company emits less than its allowance, it can sell excess credits. Conversely, companies exceeding their limits must purchase credits to comply.
This system creates a financial incentive for companies to reduce emissions efficiently, while providing flexibility in achieving environmental goals.
1.4 Benefits of Carbon Credits
Environmental Impact: Encourages the reduction of greenhouse gas emissions and supports renewable energy and conservation projects.
Economic Incentives: Provides a cost-effective mechanism for companies to manage emission limits.
Global Cooperation: Facilitates cross-border collaboration in combating climate change.
Innovation: Encourages technological advancements in energy efficiency and clean technologies.
1.5 Challenges
Verification and Transparency: Ensuring the authenticity and impact of carbon credits can be difficult, especially in voluntary markets.
Market Volatility: Prices of carbon credits can fluctuate, affecting corporate planning.
Risk of “Greenwashing”: Companies may misuse credits to appear environmentally responsible without genuine sustainability efforts.
2. ESG Investing
2.1 Definition
ESG investing is an investment strategy that integrates Environmental, Social, and Governance factors into financial decision-making. Unlike traditional investment approaches that focus solely on financial returns, ESG investing evaluates how companies manage sustainability risks and social responsibilities.
Environmental: Examines a company’s environmental footprint, including energy use, emissions, waste management, and climate impact.
Social: Focuses on human capital management, labor standards, community relations, and diversity and inclusion.
Governance: Assesses corporate governance practices, board structure, transparency, shareholder rights, and ethical conduct.
2.2 History and Evolution
The concept of ESG investing has evolved over decades:
1960s–1980s: Ethical investing emerged, primarily focused on avoiding “sin stocks” like tobacco and weapons.
1990s–2000s: Socially responsible investing (SRI) began incorporating broader social and environmental concerns.
2010s–Present: ESG investing became mainstream, driven by climate change concerns, regulatory pressure, and growing investor awareness of long-term risks.
2.3 ESG Integration Strategies
Investors can adopt several approaches to integrate ESG factors:
Screening: Excluding companies or sectors that do not meet ESG criteria (negative screening) or including those that do (positive screening).
Integration: Embedding ESG factors into fundamental financial analysis to assess long-term risks and opportunities.
Impact Investing: Targeting investments that generate measurable social and environmental benefits alongside financial returns.
Shareholder Engagement: Using ownership rights to influence company policies on sustainability and corporate governance.
2.4 Importance of ESG Investing
Risk Management: ESG factors help identify potential environmental, social, or governance risks that could impact financial performance.
Long-term Value Creation: Companies with strong ESG performance tend to demonstrate resilience and sustainable growth.
Regulatory Compliance: Governments and regulators are increasingly mandating ESG disclosures and reporting.
Reputation and Consumer Demand: ESG-aligned companies attract customers, employees, and investors seeking responsible businesses.
2.5 Challenges in ESG Investing
Standardization: Lack of uniform ESG metrics and reporting standards makes comparisons difficult.
Greenwashing: Companies may exaggerate ESG credentials to attract investors without real impact.
Short-term vs Long-term: ESG benefits often manifest over the long term, while market pressures may favor short-term gains.
Data Quality: Reliable ESG data can be scarce, inconsistent, or biased.
3. Intersection of Carbon Credits and ESG Investing
Carbon credits and ESG investing are closely linked. Carbon credits primarily address environmental factors, which form a significant part of ESG considerations. Here’s how they intersect:
3.1 Carbon Credits as ESG Tools
Companies can purchase carbon credits to offset emissions, demonstrating commitment to environmental sustainability.
Carbon credits serve as measurable ESG actions that investors can evaluate when assessing environmental performance.
Integration of carbon credits into corporate ESG strategies enhances credibility and transparency in emissions reduction reporting.
3.2 Driving ESG-Compliant Investments
Investors increasingly consider companies’ carbon footprint and offset strategies when making investment decisions. Firms actively participating in carbon markets often attract ESG-focused capital, creating a feedback loop:
Investor Pressure: ESG-conscious investors demand action on climate-related risks.
Corporate Response: Companies adopt carbon offset projects, improve energy efficiency, and reduce emissions.
Market Incentive: This enhances long-term corporate value and reduces exposure to regulatory or environmental risks.
3.3 Role in Sustainable Finance
Sustainable finance refers to integrating ESG factors into financial systems to promote sustainable development. Carbon credits, green bonds, and ESG funds are instruments enabling sustainable finance:
Green Bonds: Proceeds are used for environmentally sustainable projects.
ESG Funds: Allocate capital to companies with strong ESG practices, often including carbon reduction initiatives.
Carbon Markets: Provide financial incentives for emissions reductions, complementing ESG investment strategies.
4. Global Trends and Market Dynamics
4.1 Carbon Market Growth
The global carbon market has expanded rapidly. According to the World Bank:
The market reached over $300 billion in value by 2023, with both compliance and voluntary markets growing.
Regulatory initiatives like the EU ETS, California Cap-and-Trade Program, and China’s national carbon market are driving compliance credit demand.
Voluntary carbon markets are increasingly used by multinational corporations to meet net-zero targets.
4.2 ESG Investment Growth
Global ESG assets are projected to surpass $50 trillion by 2025, representing over a third of total assets under management.
Institutional investors, pension funds, and sovereign wealth funds are incorporating ESG criteria into mainstream investment decisions.
ESG-focused indices and funds are becoming standard offerings in global capital markets.
4.3 Regional Variations
Europe: Leading in ESG adoption due to regulatory frameworks like the EU Sustainable Finance Disclosure Regulation (SFDR).
United States: ESG investing is growing, though regulatory clarity is evolving.
Asia-Pacific: Rapid adoption driven by corporate sustainability initiatives and investor demand, especially in Japan, India, and China.
5. Challenges and Criticisms
5.1 Carbon Credits
Lack of uniform verification standards.
Risk of over-reliance on offsets instead of direct emission reductions.
Potential for double counting or non-additionality (credits not leading to actual emission reductions).
5.2 ESG Investing
ESG rating agencies may use different methodologies, causing discrepancies.
Greenwashing remains a significant concern.
Measuring impact remains complex; financial returns are sometimes uncertain.
5.3 Integration Challenges
Combining ESG investment strategies with carbon credit mechanisms requires robust reporting and transparency.
Investors must carefully evaluate whether carbon offsets genuinely contribute to sustainability or merely serve marketing purposes.
Harmonization of global ESG standards is needed to streamline investment decisions.
6. Future Outlook
6.1 Regulatory Developments
Governments worldwide are introducing stricter ESG reporting and carbon disclosure requirements. These regulations are expected to:
Improve transparency in carbon markets.
Enhance corporate ESG reporting.
Encourage the adoption of standardized ESG metrics.
6.2 Technological Innovations
Blockchain: Enhances transparency in carbon credit trading and ESG reporting.
AI and Big Data: Improve ESG data collection, analysis, and predictive modeling.
Clean Technology: Investments in renewable energy, carbon capture, and sustainable agriculture will expand ESG and carbon credit opportunities.
6.3 Investor Behavior
Younger investors increasingly prioritize sustainability, pushing companies toward ESG compliance.
Impact investing and socially responsible funds will continue to grow.
Integration of carbon pricing into financial models will help assess corporate climate risk more accurately.
Conclusion
Carbon credits and ESG investing are pivotal in the transition toward a sustainable global economy. Carbon credits provide a mechanism to limit greenhouse gas emissions, incentivize environmental projects, and facilitate corporate accountability. ESG investing, on the other hand, allows investors to integrate sustainability into financial decisions, promoting ethical, responsible, and long-term value creation.
The synergy between these two concepts is crucial. Carbon credits complement ESG strategies by providing measurable environmental actions, while ESG investing channels capital toward sustainable and responsible enterprises. Together, they represent a shift in the financial world where profitability, sustainability, and societal impact are no longer mutually exclusive but increasingly interconnected.
As the global community confronts the challenges of climate change, resource scarcity, and social inequality, carbon credits and ESG investing will continue to play transformative roles in shaping investment strategies, corporate behavior, and ultimately, the sustainability of our planet.
