Part 1 Ride The Big MovesIntroduction to Options Trading
Options trading is a sophisticated financial practice that allows investors to speculate on the future price movements of underlying assets or to hedge existing positions. Unlike direct stock trading, options provide the right—but not the obligation—to buy or sell an asset at a predetermined price within a specified time frame. This flexibility makes options a powerful tool in modern financial markets, used by retail traders, institutional investors, and hedge funds alike.
Options fall under the category of derivatives, financial instruments whose value is derived from an underlying asset, which can be stocks, indices, commodities, currencies, or ETFs. The two fundamental types of options are call options and put options.
1. Call and Put Options
Call Option: A call option gives the buyer the right to buy the underlying asset at a specific price (known as the strike price) before or on the option’s expiration date. Traders purchase calls when they expect the asset’s price to rise. For example, if a stock is trading at ₹100, and you buy a call option with a strike price of ₹105, you will profit if the stock price exceeds ₹105 plus the premium paid.
Put Option: A put option gives the buyer the right to sell the underlying asset at the strike price. Traders buy puts when they anticipate a decline in the asset’s price. For instance, if the same stock is at ₹100, a put option with a strike price of ₹95 becomes valuable if the stock price falls below ₹95 minus the premium paid.
The option seller (writer), on the other hand, assumes the obligation to fulfill the contract if the buyer exercises the option. Sellers earn the option premium upfront but take on potentially unlimited risk, especially in the case of uncovered calls.
2. Key Terms in Options Trading
Understanding options requires familiarity with several technical terms:
Strike Price: The predetermined price at which the underlying asset can be bought (call) or sold (put).
Expiration Date: The last date on which the option can be exercised. Options lose value after this date.
Premium: The price paid to purchase the option, influenced by intrinsic value and time value.
Intrinsic Value: The difference between the underlying asset’s price and the strike price if favorable to the option holder.
Time Value: The portion of the premium reflecting the probability of the option becoming profitable before expiration.
In-the-Money (ITM): A call is ITM if the underlying price > strike price; a put is ITM if the underlying price < strike price.
Out-of-the-Money (OTM): A call is OTM if the underlying price < strike price; a put is OTM if the underlying price > strike price.
At-the-Money (ATM): When the underlying price ≈ strike price.
ETHUSD.PM trade ideas

Volatility Index (India VIX) Trading1. Introduction to Volatility and VIX
Volatility is the statistical measure of the dispersion of returns for a given security or market index. In simpler terms, it indicates how much the price of an asset swings, either up or down, over a period of time. Volatility can be driven by market sentiment, economic data, geopolitical events, or unexpected corporate announcements.
The India VIX, or the Volatility Index of India, is a real-time market index that represents the expected volatility of the Nifty 50 index over the next 30 calendar days. It is often referred to as the "fear gauge" because it tends to rise sharply when the market anticipates turbulence or uncertainty.
High VIX Value: Indicates high market uncertainty or expected large swings in Nifty.
Low VIX Value: Indicates low expected volatility, reflecting a stable market environment.
India VIX is calculated using the Black–Scholes option pricing model, taking into account the price of Nifty options with near-term and next-term expiry. This makes it a forward-looking indicator rather than a retrospective measure.
2. Significance of India VIX in Trading
India VIX is not a tradeable index itself but a crucial sentiment and risk gauge for traders. Its applications in trading include:
Market Sentiment Analysis:
Rising VIX indicates fear and uncertainty. Traders may reduce equity exposure or hedge portfolios.
Falling VIX suggests calm markets and often coincides with bullish trends in equity indices.
Risk Management:
Portfolio managers and traders use VIX levels to determine stop-loss levels, hedge sizes, and option strategies.
Predictive Insights:
Historical data shows that extreme spikes in VIX often precede market bottoms, and extremely low VIX levels may indicate complacency, often preceding corrections.
Derivative Strategies:
India VIX futures and options are actively traded, providing opportunities for hedging and speculative strategies.
3. How India VIX is Calculated
Understanding the calculation of VIX is essential for professional trading. India VIX uses a methodology similar to the CBOE VIX in the U.S., which focuses on expected volatility derived from option prices:
Step 1: Option Selection
Nifty call and put options with near-term and next-term expiries are chosen, typically out-of-the-money (OTM).
Step 2: Compute Implied Volatility
Using the prices of these options, the market’s expectation of volatility is derived through a modified Black–Scholes formula.
Step 3: Weighting and Smoothing
The implied volatilities of different strike prices are combined and weighted to produce a single expected volatility for the next 30 days.
Step 4: Annualization
The resulting number is annualized to reflect volatility in percentage terms, expressed as annualized standard deviation.
Key Point: India VIX does not predict the direction of the market; it only predicts the magnitude of expected moves.
4. Factors Influencing India VIX
India VIX moves based on a variety of market, economic, and geopolitical factors:
Market Events:
Sudden crashes or rallies in Nifty significantly affect VIX.
For example, a 2–3% overnight fall in Nifty can spike VIX by 10–15%.
Economic Data:
GDP growth announcements, inflation data, interest rate decisions, and corporate earnings influence volatility expectations.
Global Events:
US Fed decisions, crude oil volatility, geopolitical tensions (e.g., wars, sanctions) impact India VIX.
Market Liquidity:
During thin trading sessions or holidays in global markets, implied volatility in options rises, increasing VIX.
Investor Behavior:
Panic selling, FII flows, and retail sentiment shifts can drive VIX up sharply.
5. Trading Instruments Related to India VIX
While you cannot directly trade India VIX like a stock, several instruments allow traders to gain exposure to volatility:
5.1. India VIX Futures
Traded on NSE, futures contracts allow traders to speculate or hedge against volatility.
Futures are settled in cash based on the final India VIX value at expiry.
Contract months are usually current month and next two months, allowing short- to medium-term strategies.
5.2. India VIX Options
Like futures, VIX options are European-style options, cash-settled at expiry.
Traders can use calls and puts to bet on rising or falling volatility.
Options provide leveraged exposure, but risk is high due to volatility’s non-directional nature.
5.3. Equity Hedging via VIX
VIX can be used to structure protective strategies like buying Nifty puts or using collars.
When VIX is low, hedging costs are cheaper; when high, it is expensive.
6. Types of India VIX Trading Strategies
6.1. Directional Volatility Trading
Buy VIX Futures/Options when anticipating a sharp market drop or increased uncertainty.
Sell VIX Futures/Options when expecting market stability or a decrease in fear.
6.2. Hedging Equity Portfolios
Traders holding Nifty positions may buy VIX calls or futures to protect against sudden drops.
Example: If you hold long Nifty positions and expect a 1-week correction, buying VIX futures acts as an insurance.
6.3. Spread Trading
Calendar Spreads: Buy near-month VIX futures and sell next-month futures to profit from volatility curve changes.
Option Spreads: Buying a call spread or put spread on VIX options reduces risk while maintaining exposure to expected volatility moves.
6.4. Arbitrage Opportunities
Occasionally, disparities between VIX and realized volatility in Nifty options create arbitrage opportunities.
Advanced traders monitor mispricing to exploit short-term inefficiencies.
6.5. Mean Reversion Strategy
India VIX is historically mean-reverting. Extreme highs (>30) often come down, while extreme lows (<10) eventually rise.
Traders can adopt counter-trend strategies to capitalize on reversion toward the mean.
7. Risk Factors in VIX Trading
High Volatility:
While VIX measures volatility, the instrument itself is volatile. Sharp reversals can occur without warning.
Complex Pricing:
Futures and options on VIX depend on implied volatility, making pricing sensitive to market dynamics.
Liquidity Risk:
VIX options and futures have lower liquidity than Nifty, potentially leading to wider spreads.
Non-Directional Nature:
VIX measures magnitude, not direction. A rising market can spike VIX if the potential for sharp swings exists.
Event Risk:
Unexpected macroeconomic or geopolitical events can lead to sudden spikes.
8. Conclusion
India VIX trading is a highly specialized, nuanced field combining market sentiment analysis, technical skills, and risk management acumen. While it offers opportunities to profit from volatility and hedge equity exposure, it also carries substantial risks due to its non-linear, non-directional, and highly sensitive nature.
To succeed in India VIX trading, one must:
Understand the underlying calculation and drivers of volatility.
Combine VIX insights with market structure and macroeconomic analysis.
Adopt disciplined risk management practices, including stop-losses and position sizing.
Stay updated with global and domestic events impacting market sentiment.
For traders and investors, India VIX is more than a “fear gauge.” It is a strategic tool that provides a unique window into market psychology, enabling better-informed decisions in both trading and portfolio management.
ETHUSD SHOWING A GOOD UP MOVE WITH 1:8 RISK REWARD ETHUSD SHOWING A GOOD
UP MOVE WITH 1:8 RISK REWARD
DUE TO THESE REASON
A. its following a rectangle pattern that stocked the market
which preventing the market to move any one direction now it trying to break the strong resistant lable
B. after the break of this rectangle it will boost the market potential for break
C. also its resisting from a strong neckline the neckline also got weeker ald the price is ready to break in the outer region
all of these reason are indicating the same thing its ready for breakout BREAKOUT trading are follws good risk reward
please dont use more than one percentage of your capitalfollow risk reward and tradeing rules
that will help you to to become a bettertrader
thank you

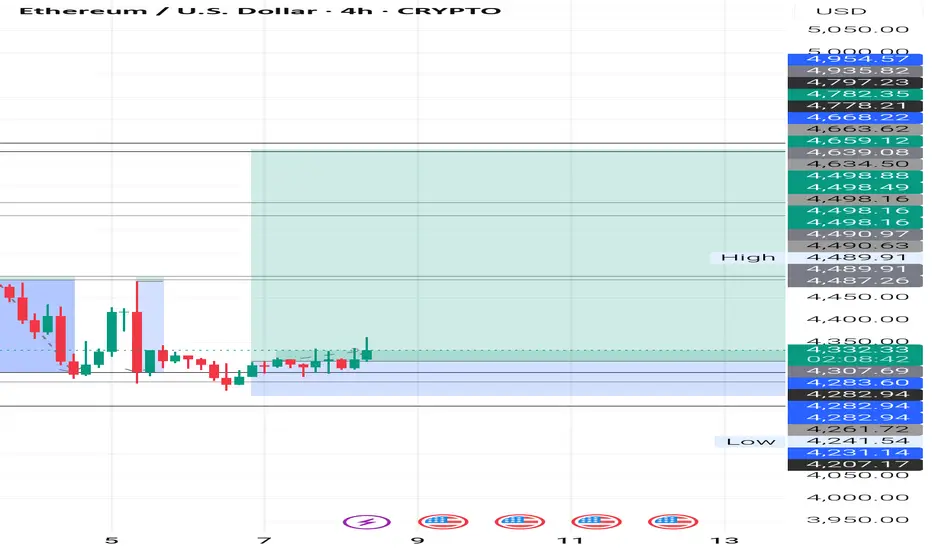
ETH/USDT Buy Setup – Rounding Bottom RetestEthereum is setting up a high-probability long entry after completing a 4H rounding bottom pattern with a clean retest. This structure often signals exhaustion of sellers and the start of a sustained bullish leg.
Trade Idea
Buy Entry: 4510
Stop Loss: 4400
Target: 1:1.5 RR (approx. 4810)
Why This Setup?
4H Rounding Bottom: Classic reversal + continuation structure.
Retest Confirmation: Price is reacting strongly after trapping late sellers.
Confluence: Trend momentum aligns with bullish bias, supported by higher timeframe structure.
Execution Notes
Risk small and stick to 1–2% max per trade.
If ETH breaks and holds above 4600, momentum could accelerate quickly.
Trail stops if strength builds toward $4800–$4900 zone.
Summary: ETH has trapped sellers at the lows and is retesting a bullish rounding bottom. With clean risk defined at 4400, this 1:1.5 setup offers both safety and upside potential.

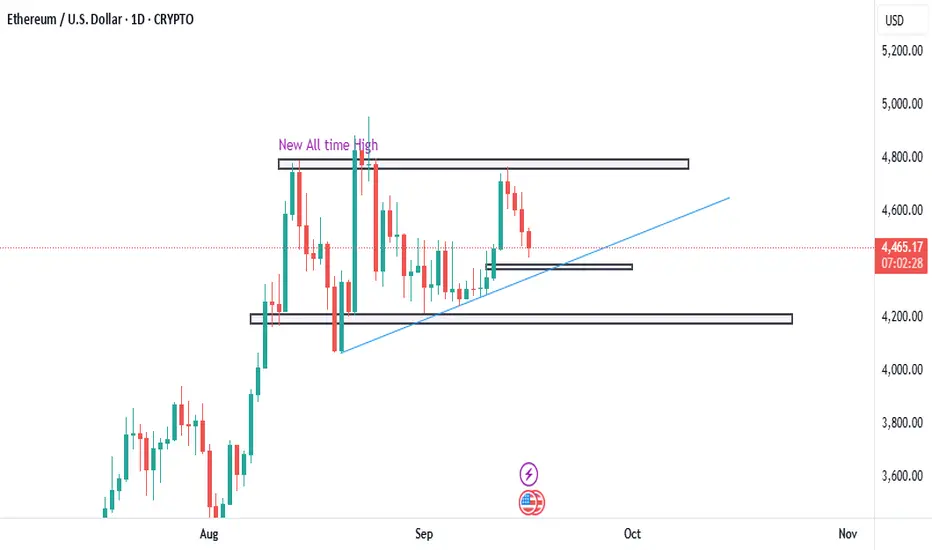
Consolidation and Potential BreakoutResistance: resistance zone is located between $4,700 and $4,800, it is all time high level there are some profit booking whic led to a short reversal,
Support:The primary support is the rising trendline, which has been guiding the price upwards since early September.
There's also a strong horizontal support zone between $4,100 and $4,200. A break below the rising trendline would likely test this lower support level.
An intermediate support level is visible around $4,300 to $4,400, which is where the price is currently hovering.
Ethereum is currently in a high-stakes waiting game. The price is consolidating, building energy for its next major move or all time high. The most prudent strategy is to remain patient and wait for a confirmed breakout or breakdown before entering a position. Waiting for a break of the key resistance at $4,700 or the key support at $4,100 provides a clear entry signal and allows for better risk management.
Technical Analysis (TA) and Fundamental Analysis (FA) in Trading1. Introduction to Market Analysis
Financial markets, whether stocks, forex, commodities, or cryptocurrencies, are highly dynamic. Prices fluctuate due to supply and demand, investor sentiment, macroeconomic factors, corporate performance, and global events. To navigate this volatility, traders and investors use analysis methods to predict future price movements and identify profitable opportunities.
The two main methods are:
Fundamental Analysis (FA): Focuses on the intrinsic value of an asset by evaluating economic, financial, and qualitative factors.
Technical Analysis (TA): Focuses on historical price and volume data to predict future price movements using charts and technical indicators.
While both have their strengths and weaknesses, many successful traders use a combination of both to make informed decisions.
2. Fundamental Analysis (FA)
2.1 Definition
Fundamental Analysis is the study of a company’s financial health, economic conditions, and other external factors to determine the intrinsic value of a stock or asset. The goal is to identify whether an asset is overvalued, undervalued, or fairly priced in the market.
2.2 Key Principles
Intrinsic Value: The true worth of a company or asset based on fundamentals, not just the market price.
Long-Term Perspective: FA is generally used by investors looking for long-term investments rather than short-term trading.
Economic Influence: Macroeconomic factors, industry trends, and geopolitical events influence the value of assets.
2.3 Components of Fundamental Analysis
Fundamental Analysis involves two main components:
2.3.1 Quantitative Analysis
This involves analyzing measurable data from financial statements and economic reports. Key metrics include:
Revenue and Earnings: Revenue indicates the total income generated, while earnings reflect the net profit.
Earnings Per Share (EPS): Shows profitability on a per-share basis.
Price-to-Earnings (P/E) Ratio: Compares the stock price to its earnings. A high P/E may indicate overvaluation.
Debt-to-Equity Ratio (D/E): Measures financial leverage and risk.
Return on Equity (ROE): Indicates how effectively a company uses shareholders’ equity to generate profit.
Cash Flow Analysis: Evaluates liquidity and the ability to meet obligations.
2.3.2 Qualitative Analysis
This involves assessing non-numerical factors that affect a company’s long-term performance, including:
Business Model: Understanding how a company makes money and its competitive advantage.
Management Quality: Leadership effectiveness impacts growth and profitability.
Industry Trends: Assessing the growth potential and competitive landscape.
Brand Strength and Market Position: Strong brands often command pricing power.
Regulatory Environment: Government policies can affect operations and profitability.
2.4 Steps in Fundamental Analysis
Macro Analysis: Examine global and national economic conditions.
Industry Analysis: Evaluate the sector or industry trends and competitors.
Company Analysis: Analyze financial statements, management, and business strategies.
Valuation: Use models like Discounted Cash Flow (DCF), Price-to-Earnings (P/E), or Price-to-Book (P/B) to estimate intrinsic value.
Decision Making: Compare intrinsic value to current market price to determine buy, hold, or sell.
2.5 Advantages of Fundamental Analysis
Provides a long-term perspective.
Helps investors make informed decisions based on real company performance.
Can identify undervalued opportunities for significant gains.
2.6 Limitations of Fundamental Analysis
Time-consuming and requires detailed research.
Market prices can remain irrational for extended periods.
Not suitable for short-term trading due to market volatility.
3. Technical Analysis (TA)
3.1 Definition
Technical Analysis is the study of past market data—primarily price and volume—to forecast future price movements. Unlike FA, it does not focus on a company’s intrinsic value but on market behavior and trends.
3.2 Key Principles
Technical Analysis is based on three core assumptions:
Price Discounts Everything: All available information (fundamentals, sentiment, news) is already reflected in the market price.
Prices Move in Trends: Markets follow trends (uptrend, downtrend, or sideways), and these trends can be identified and traded.
History Tends to Repeat Itself: Price patterns and market psychology often repeat due to human behavior.
3.3 Tools of Technical Analysis
Technical Analysis relies on charts, indicators, and patterns:
3.3.1 Price Charts
Line Chart: Connects closing prices over time.
Bar Chart: Shows open, high, low, and close prices (OHLC).
Candlestick Chart: Visual representation of OHLC with patterns indicating market sentiment.
3.3.2 Technical Indicators
Indicators are mathematical calculations based on price and volume to identify trends, momentum, and reversals.
Common Indicators:
Moving Averages (MA): Smooth out price data to identify trends.
Relative Strength Index (RSI): Measures overbought or oversold conditions.
Moving Average Convergence Divergence (MACD): Detects momentum and trend changes.
Bollinger Bands: Identify volatility and potential reversal points.
Volume Indicators (OBV, VWAP): Confirm price movements with volume activity.
3.3.3 Chart Patterns
Patterns indicate potential market movements:
Trend Continuation Patterns: Flags, pennants, and triangles suggest ongoing trends.
Reversal Patterns: Head and shoulders, double tops/bottoms signal trend changes.
Candlestick Patterns: Doji, hammer, engulfing, shooting star indicate short-term reversals.
3.3.4 Support and Resistance
Support: Price level where demand is strong enough to prevent further decline.
Resistance: Price level where selling pressure prevents price from rising.
Identifying these levels helps traders set entry, exit, and stop-loss points.
3.4 Steps in Technical Analysis
Select the Asset and Timeframe: Choose the market and timeframe (intraday, daily, weekly, monthly).
Analyze Trend: Determine if the market is in an uptrend, downtrend, or sideways.
Identify Key Levels: Locate support, resistance, and breakout zones.
Apply Indicators: Use momentum, volume, and trend indicators to confirm signals.
Plan Entry and Exit: Decide when to enter or exit trades based on risk management.
3.5 Advantages of Technical Analysis
Works in any market with historical data.
Suitable for short-term and intraday trading.
Helps identify precise entry and exit points.
Can be automated using algorithmic trading.
3.6 Limitations of Technical Analysis
Ignores underlying fundamentals.
Requires discipline and practice to interpret correctly.
May produce false signals in volatile markets.
4. Integrating FA and TA
Many successful market participants combine both methods to maximize profits:
FA to Choose the Asset: Identify fundamentally strong stocks for long-term investment.
TA to Time the Market: Use technical signals to decide when to buy or sell.
For example:
A stock may be fundamentally undervalued (FA).
TA can identify the right entry point when the price hits a key support level.
Similarly, FA can help avoid fundamentally weak stocks that may temporarily rise due to technical momentum.
5. Practical Tips for Traders and Investors
Know Your Style: Long-term investors benefit more from FA, while short-term traders rely on TA.
Risk Management: Always set stop-loss levels and manage trade size.
Stay Updated: Monitor economic news, earnings reports, and global events.
Combine Analysis: Using FA and TA together can reduce risk and improve accuracy.
Continuous Learning: Markets evolve, so stay updated on new tools and strategies.
6. Conclusion
Both Fundamental Analysis (FA) and Technical Analysis (TA) are essential tools for navigating financial markets. FA provides the foundation for understanding the true value of assets, while TA offers insights into price trends, momentum, and market psychology. While FA is best suited for long-term investments, TA is invaluable for timing trades and short-term opportunities. By understanding and integrating both approaches, traders and investors can make informed decisions, minimize risk, and increase their chances of consistent success in the dynamic world of financial markets.
ETH Setup You Can't Ignore:4k FVG to 5k Seller Zone ⚠️ ETH Setup You Can’t Ignore: 4K FVG to 5K SELLER ZONE!
ETHUSD – Fair Value Gap & Liquidity Sweep Setup
Ethereum is trading within a critical range, presenting a potential ICT-style setup:
Fair Value Gap (4000–4200) – Key demand zone with a “Golden Line” midpoint; price may dip to fill this imbalance before reversing.
Seller Zone (~5000) – Major supply zone where profit-taking or distribution could trigger.
Bias – Expect a sweep of downside liquidity, a reaction within the FVG, and a possible rally toward the 5000 zone if higher timeframe confluence supports it.
⚠️ Always wait for confirmation and manage risk before execution.

a high freqeuency setup for ethusd best one fot septemebera high freqeuency setup for ethusd best one fot septemeber
possible buy for goodd money

ETH/USD 4H ANALYSIS
Ethereum continues to respect the ascending trendline from July lows. Price recently tested the $4,600 zone and is now pulling back slightly.
Trendline Support: Price remains above the rising trendline, showing buyers are still in control of the mid-term trend.
RSI (14): Currently at 56, holding above the 50 level → signals bullish momentum remains intact despite the pullback.
Short-Term Outlook: A retest of the trendline could provide a potential higher-low setup for continuation towards $4,800–$5,000.
Invalidation: A break and close below the trendline would weaken the bullish structure and open downside risk toward $4,200–$4,300.
🔑 Trading Plan
Bullish Bias: Look for long setups on successful retest of trendline + RSI staying above 50.
Bearish Scenario: If price closes below the trendline with RSI < 50, shift bias to short-term downside.


Relative Strength Index (RSI) in Trading1. Introduction to RSI
The financial markets operate on the constant tug-of-war between buyers and sellers. Traders have long sought tools to identify when markets are likely to reverse or continue trending. Among the most widely used technical indicators is the Relative Strength Index (RSI), a momentum oscillator developed to measure the speed and magnitude of recent price movements.
The RSI is not just a number; it’s a psychological mirror of the market, showing when traders may be overenthusiastic (overbought) or overly fearful (oversold). Since its introduction in 1978 by J. Welles Wilder Jr., RSI has become a cornerstone of technical analysis, used by retail traders, institutional investors, and even algorithmic systems across stocks, forex, commodities, and crypto.
2. History & Origin of RSI
RSI was introduced in Wilder’s famous book “New Concepts in Technical Trading Systems” (1978), alongside other indicators like the Average True Range (ATR) and Parabolic SAR. Wilder, a mechanical engineer turned trader, believed in quantifying market psychology.
Before RSI, momentum indicators existed, but they lacked a standardized scale. Wilder’s breakthrough was normalizing momentum into a range between 0 and 100, making it universally applicable and easier to interpret. Over time, RSI’s simplicity and adaptability allowed it to transcend asset classes, from Dow Jones stocks in the 80s to Bitcoin and Ethereum today.
3. Mathematical Formula & Calculation
The RSI formula is:
𝑅
𝑆
𝐼
=
100
−
(
100
1
+
𝑅
𝑆
)
RSI=100−(
1+RS
100
)
Where:
RS (Relative Strength) = Average Gain / Average Loss (over a set period, usually 14)
Steps:
Calculate the average of “up closes” and “down closes” for 14 periods.
Divide average gain by average loss = RS.
Plug RS into the RSI formula to scale between 0–100.
Example:
Average Gain = 1.5%
Average Loss = 0.75%
RS = 1.5 / 0.75 = 2
RSI = 100 – = 66.6
Thus, RSI = 67 indicates bullish momentum but not yet overbought.
4. Understanding RSI Levels
Above 70 → Overbought (possible correction)
Below 30 → Oversold (possible rebound)
Around 50 → Neutral (balance between buyers & sellers)
Some traders adjust:
80/20 levels for stronger trends
60/40 levels in trending markets (RSI may not touch extremes often)
RSI levels act as zones of probability, not absolute buy/sell signals.
5. RSI in Different Market Conditions
Trending Markets: RSI can remain overbought (>70) or oversold (<30) for extended periods. For example, in strong bull runs, RSI may hover around 70–80.
Ranging Markets: RSI oscillates smoothly between 30 and 70, making it excellent for mean-reversion strategies.
Volatile Markets: RSI signals can be whipsawed, requiring filters like moving averages or multiple timeframe confirmations.
6. RSI Trading Strategies
a) Overbought & Oversold Strategy
Buy when RSI < 30 (oversold) and price shows reversal.
Sell when RSI > 70 (overbought) and reversal signs appear.
Works best in sideways markets.
b) Divergence Strategy
Bullish Divergence: Price makes lower lows, RSI makes higher lows → reversal likely upward.
Bearish Divergence: Price makes higher highs, RSI makes lower highs → reversal likely downward.
c) RSI Swing Rejections
A method Wilder emphasized:
Bullish: RSI goes below 30, bounces back, rejects a second drop, then crosses above previous high.
Bearish: RSI goes above 70, falls, rejects second rise, then breaks lower.
d) RSI Trendlines & Breakouts
Traders draw trendlines on RSI itself, treating it like a price chart. Breakouts often lead price action.
e) RSI + Moving Averages
Use RSI to confirm MA crossovers. Example: RSI > 50 when 50-day MA crosses above 200-day MA strengthens bullish trend.
7. RSI for Different Timeframes
Intraday/Scalping (1–5 min): RSI is very sensitive. Traders use shorter settings (7-period RSI).
Swing Trading (1D–1W): Classic 14-period RSI works well. Divergences are powerful.
Long-Term Investing (1M): RSI identifies market cycles; buying when RSI < 30 on monthly charts often captures generational opportunities.
8. Combining RSI with Other Indicators
a) RSI + MACD
MACD confirms trend direction; RSI signals entry/exit.
Example: MACD bullish crossover + RSI near 40–50 = strong buy signal.
b) RSI + Bollinger Bands
RSI overbought + price at upper band → higher reversal probability.
RSI oversold + price at lower band → bounce likely.
c) RSI + Volume Profile
High volume at RSI extremes confirms stronger reversals.
d) RSI + Moving Averages
RSI trending above 50 while price is above MA = bullish confirmation.
Conclusion
The Relative Strength Index (RSI) remains one of the most effective momentum oscillators in trading history. From J. Welles Wilder’s manual calculations in the 70s to modern-day algorithmic applications, RSI has proven its adaptability.
Its power lies not in blindly buying at 30 or selling at 70, but in understanding context, divergences, swing rejections, and market psychology. While it has limitations in trending markets, when combined with other tools, RSI becomes a formidable ally.
For traders, RSI is more than a number. It’s a window into collective human behavior, showing how emotion, momentum, and probability interact to move markets. Whether you’re day-trading forex, swing-trading stocks, or investing in crypto, RSI remains a timeless guide to navigating uncertainty.
Ethereum Liquidity Sweep Setup for Bullish Continuation📊 Market Analysis Report – ETHUSD
The market has been consolidating within a range after a strong impulsive move down, followed by a period of liquidity sweeps and corrective structure. Price action shows signs of engineered liquidity grabs both above and below recent highs and lows, which indicates smart money activity.
Currently, ETH is transitioning from a compression phase into expansion. The accumulation zone formed in recent sessions suggests a build-up for a larger move. The market appears to be setting up a liquidity sweep to the downside before a potential continuation upward, aligning with the projected path on the chart.
From a structural perspective, the overall cycle points towards bullish continuation after this corrective phase. The projected liquidity sweep is designed to trap early sellers before price accelerates towards higher objectives.

The Future of Trading in India1. Evolution of Trading in India – A Brief Context
Before we talk about the future, it’s important to understand how far India has come.
Pre-1990s: Physical shares, long settlement cycles (T+14), insider networks, and lack of transparency.
1990s reforms: Liberalization, NSE’s electronic trading, SEBI’s regulatory oversight, and screen-based trading.
2000s: Growth of F&O (Futures & Options), dematerialization of shares, introduction of commodities and currency derivatives.
2010s: Rise of algo trading, mobile trading apps, intraday retail participation, weekly expiries, and increasing global fund flows.
2020s: Post-COVID retail boom, discount brokers like Zerodha and Groww democratizing access, explosion in derivatives volumes, and surge in SIPs and mutual fund penetration.
This trajectory shows that India’s trading market has not only caught up with global peers but is now innovating at its own pace.
2. Key Drivers Shaping the Future of Trading in India
a) Digital Penetration and Fintech Boom
India has the world’s second-largest internet user base and one of the cheapest data costs globally. This means that even in small towns, traders can access real-time markets through smartphones. Apps like Zerodha, Upstox, Angel One, and Groww are onboarding millions of new users every year.
b) Demographics
Over 65% of India’s population is below 35 years. This young, tech-savvy generation is more comfortable with risk, online platforms, and experimenting with trading.
c) Regulatory Support
SEBI has been tightening rules to ensure transparency, margin requirements, and investor protection. This gives credibility to Indian markets and attracts foreign investors.
d) Globalization
India is being integrated into global indices (MSCI, FTSE, etc.), which means more foreign fund flows. Also, global geopolitical shifts are making India a preferred investment destination.
e) Technology
Artificial Intelligence, Machine Learning, Big Data analytics, Blockchain, and Algorithmic Trading are going to redefine how trades are executed, analyzed, and managed.
3. Future of Stock Market Trading in India
a) Retail Participation Will Continue to Explode
Currently, around 10–12% of Indians invest in stock markets, compared to over 50–60% in the US. This gap indicates massive potential for growth. With increasing financial literacy, better apps, and more disposable income, retail participation could double in the next decade.
b) Rise of Passive Investing and ETFs
While active trading will continue, more Indians will start investing through Exchange-Traded Funds (ETFs) and index funds as they seek stable, long-term returns. The growth of Nifty and Sensex ETFs is just the beginning.
c) Weekly and Daily Expiries
The popularity of weekly options will expand. Exchanges may even introduce daily expiries, mirroring global trends, which will increase intraday volatility and attract short-term traders.
d) Integration of Global Markets
Indian traders may soon get seamless access to trade US stocks, global commodities, and even international ETFs through domestic broker platforms.
4. Future of Derivatives Trading in India
a) Options Mania Will Expand Further
The future of derivatives trading will be dominated by options. With low capital requirements, retail investors are already driving record F&O volumes. NSE is among the largest derivatives markets in the world, and this trend will accelerate.
b) New Products
We can expect products like volatility indices (India VIX derivatives), sector-specific options, and more currency/commodity pairs.
c) AI-Driven Strategies
Algo trading will no longer be restricted to institutions. With cheaper cloud computing and APIs provided by brokers, retail traders will also use machine learning-based strategies.
d) Increased SEBI Scrutiny
To balance risk, SEBI may tighten margin rules further, introduce stricter disclosures, and limit speculative retail blow-ups.
5. Role of Technology in the Future of Trading
a) AI and Predictive Analytics
Traders will use AI to analyze massive amounts of market data, predict price trends, and execute strategies with precision.
b) Algorithmic Trading for All
Currently, algo trading is dominated by institutions. In the future, retail algos will become mainstream, with drag-and-drop strategy builders.
c) Blockchain and Tokenization
Trading of tokenized assets—fractional ownership of real estate, art, or even stocks—on blockchain networks will become possible in India once regulations evolve.
d) Real-Time Risk Management
Advanced systems will allow traders to manage portfolio risk dynamically, with real-time alerts and auto-hedging.
6. Future Regulations and Policies
T+1 and Beyond: India already has T+1 settlement. The next move could be instant settlements using blockchain.
Investor Protection: SEBI will likely mandate stronger disclosure norms, AI-based surveillance to catch manipulation, and education programs.
Crypto Regulation: Once a clear framework is set, crypto exchanges may integrate with traditional stock brokers, creating a unified trading ecosystem.
Capital Controls Relaxation: India may slowly allow easier foreign participation and cross-border trading.
7. Retail Traders vs. Institutional Players
Retail Boom: Short-term retail speculation in F&O will remain strong.
Institutional Dominance: Mutual funds, sovereign wealth funds, and foreign institutions will continue driving long-term capital inflows.
Future Balance: Retail will dominate derivatives, while institutions will dominate cash markets.
8. Commodities and Currency Trading
Gold and Silver: India, being a large consumer, will see more hedging and speculative participation in precious metals.
Energy: As India grows, trading in crude oil, natural gas, and electricity futures will expand.
Currency Trading: With India becoming a global manufacturing hub, currency hedging in INR/USD, INR/JPY, INR/CNY will grow. Eventually, the Indian Rupee could become a global trading currency.
Challenges Ahead
Over-Speculation: Retail traders blowing up accounts in options.
Regulatory Delays: Slow response to crypto, tokenization, and new products.
Tech Risks: Cybersecurity threats and system outages.
Global Shocks: Geopolitical events, Fed policies, or oil shocks impacting India’s markets.
Conclusion
The future of trading in India is a mix of opportunity and responsibility. The next two decades will witness:
Retail explosion, with millions of new traders joining.
Technological disruption, led by AI, algos, and blockchain.
New asset classes, from crypto to carbon credits.
Deeper global integration, making India a key player in world finance.
Yet, risks of speculation, lack of financial literacy, and regulatory bottlenecks remain. The winners of this new trading era will be those who combine discipline, knowledge, and adaptability with the right use of technology.
In short, India’s trading future is not just about more trades—it’s about more intelligent, inclusive, and globally connected trading.

ETHEREUM | VISUAL ART with PipGuardETHEREUM | VISUAL ART with PipGuard
Article published by PipGuard™ on the TradingView® platform – to continue this free publication, LEAVE A BOOST and a COMMENT, hit the notification bell, and never miss ANOTHER ANALYSIS.
ANALYSIS
Hello colleague, how are you?
Today I bring you a different kind of analysis, designed to be understood on a purely visual level. Because when we're in front of the chart, in the arena, in the cage... there's no room for bullshit or distractions. Here, we fight, and whoever comes in with a confused mind always ends up crushed.
Trading is a ruthless game, like a game of chess. And the winner isn't the one who knows a thousand abstract theories, but the one who has clear ideas, simple concepts, and concrete results.
Think about it: there are few pieces on the chessboard, but the possible moves reach 10^120. That means there are more combinations in a game of chess than stars in our galaxy. An insane number. Yet, the winner isn't the one who gets lost in complexities, but the one who knows how to move those few pieces well with cunning, craftiness, and awareness.
Trading is nothing but this: a continuous battle between you and the market. It moves its pawns, it provokes you, it deceives you, it tries to screw you over. And you? You must observe, wait for its move, analyze it, imagine its counter-move, and only then react.
The tools are few and clear: liquidity, support, resistance, trend.
You don't need an infinite arsenal: you need the basics, the ability to interpret, and the coolness to respond.
I dedicate most of my time to the charts, studying the market, building indicators that actually work instead of complicating life. Over the years, I've understood that behind every strategy, every concept, every approach, there's always a common denominator: simplicity .
So remember this well, colleague: you hold the power in your hands, the power to decide. The market has made its move... what about you? How will you respond?
NEWS
✅ Ethereum is shining again as “digital oil” with a +200% rise in five months, driven by massive institutional investments via ETFs, making Bitcoin pale in comparison!
✅ ETFs and whales are pumping Ethereum: bullish flows and strategic accumulations are putting directional pressure on the price; it looks like it's set for the next push.
SECRETS
🔓 Ethereum is transforming into ultra-sound money: thanks to EIP-1559 and the Merge, it now burns more ETH than it issues daily, with emissions crushed to 1,600 ETH/day, compared to the 13,000 under PoW.
🔓 A core dev's wallet was cleaned out by a malicious AI extension: a sophisticated attack that rips ETH directly from the platform's tech heart.
GREETINGS
Remember to leave a GREETING 🚀 or a COMMENT not because I need the likes, but because every boost does more for morale than a double espresso with cream.
Talk to you soon,
PipGuard
Article published by PipGuard™ on the TradingView® platform

Long Ethereum it's a daily block targetYou can long Ethereum fron this prolonged support can keep daily block target
PCR Trading StrategiesCommon Mistakes & Myths about Options
Myth: Options are only for experts. (Truth: Beginners can use basic strategies safely.)
Mistake: Treating options like lottery tickets.
Mistake: Ignoring time decay and volatility.
Mistake: Over-trading due to low cost of buying options.
Future of Option Trading
Algo & Quant Trading: Algorithms dominate global options volume.
Retail Boom: Platforms like Zerodha, Robinhood, and Binance bring retail investors into options.
AI & Machine Learning: Predictive models for volatility and pricing.
Global Expansion: Options on new assets like carbon credits, crypto, and ETFs.
Conclusion
Option trading is a powerful tool — a double-edged sword. It can be used for risk management, speculation, or income generation. To master options, one must:
Learn the basics (calls, puts, pricing).
Understand strategies (spreads, straddles, condors).
Respect risk management and psychology.
Stay updated with market trends and regulations.
With proper discipline, options can transform how you interact with markets, offering opportunities that stocks and bonds alone cannot.

sometimes You need nothing new its just a repetationEth repeted same level trade. Its just a hourly supply that identified and repeteadly played 3 times. easy pips...

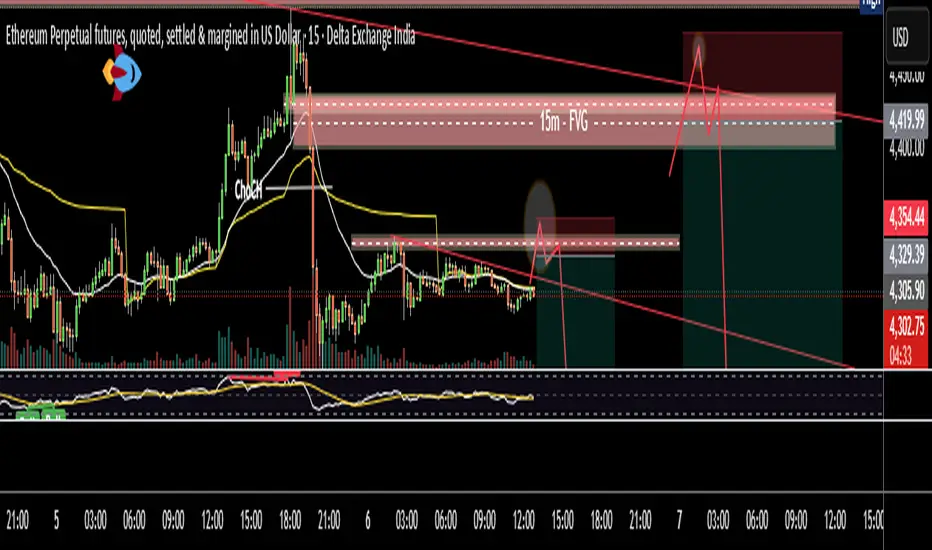
ETH multiple Sell OpportunitiesETH is moving in range for almost a week time. Now it has shown a displacement after ChoCH and formed a bearish 15m FVG. There may be a good trade at sell side if price approach it. Well there are two trade scenarios are forming.
Trade # 1
1. Price is moving around a short term trend line and resistance.
2. If price breaks trend line and take the liquidity of resistance than it may be sell trade.
Trade # 2
3. Price moves to 15m FVG and OTE overlap zone.
4. Most probably price will take liquidity of FVG zone and break trend line.
5. After breaking trend line it should pullback till FVG/trend line or any newly created OB/FVG.
All these combinations are signaling a high probability and high Risk and Reward (1:8) trade scenario.
Note – if you liked this analysis, please boost the idea so that other can also get benefit of it. Also follow me for notification for incoming ideas.
Also Feel free to comment if you have any input to share.
Disclaimer – This analysis is just for education purpose not any trading suggestion. Please take the trade at your own risk and with the discussion with your financial advisor.
ETH–USD 2 Hour ViewEthereum vs USD — 2-Hour Timeframe Levels
You asked for key price levels on a 2-hour chart. While I can't generate live 2-hour chart data here, I can share recent technical insights with support and resistance levels, plus your current price context.
⏺ Key Technical Levels (as of early September 2025):
Support Zones:
$4,360 — initial support area
$4,315 — next downside level
Below that: $4,260 and $4,220 are cited as further downside supports
Resistance Zones:
$4,500 — key resistance, blockage for current rally
If surpassed: $4,520 and $4,555 are possible next targets
Extended resistance: up to $4,620, then $4,660 or even $4,720 if momentum builds
Mid-range / Technical Sentiment:
Recent consolidation between $4,350–$4,450, holding above the 100-hour SMA with rebound potential
Daily chart structure remains bullish as long as ETH stays above $4,000; a breakdown below that could weaken structure
Next Steps for You:
Use a charting platform (e.g., TradingView) with a 2-hour timeframe and apply horizontal lines at these zones.
Watch for price action: Does ETH bounce at support? Does it stall or break through resistance? Candlestick patterns and volume around these levels help refine entries/exits.
Play momentum: Watch aggressiveness above $4,500 with targets at $4

ETH USD FOR NEAR BREAKOUT price crypto at good levels for buying update good time to invest in this stock and price at very cheeper price ..I think price may be move further and maximum stoploss 4000 rs

The Art of Position SizingIntroduction: Why Position Sizing is the Silent Weapon
When most people think about trading success, they picture things like stock picking, finding the next multibagger, or timing the market perfectly. But the truth is, none of these alone will make you a consistently profitable trader. The difference between traders who survive and thrive versus those who blow up their accounts often comes down to one thing: position sizing.
Position sizing is the art and science of deciding how much to risk on a trade. It’s not glamorous. It doesn’t make headlines like “XYZ stock doubled in a week.” But it’s the most powerful tool you have for controlling risk, managing emotions, and growing capital over the long term.
Think of trading like sailing. The market is the ocean — unpredictable, sometimes calm, sometimes stormy. Your strategy is the ship. But position sizing? That’s the steering wheel. Without it, even the strongest ship can sink.
In this article, we’ll dive deep into the art of position sizing, explore different methods, psychological aspects, and real-world applications, and by the end, you’ll understand why smart traders say: “It’s not about being right, it’s about surviving long enough to grow.”
What is Position Sizing?
In simple terms, position sizing answers the question:
“How many shares (or contracts/lots) should I buy or sell on this trade?”
Let’s take an example. Suppose you have ₹1,00,000 as trading capital. You see a stock trading at ₹500 and want to buy. Should you buy 20 shares, 100 shares, or go all-in with 200 shares? The answer depends on:
Your risk tolerance per trade (how much you’re comfortable losing if it goes wrong).
Your stop-loss level (the price at which you’ll exit if the trade fails).
Market conditions (volatility, liquidity, trend strength).
Two traders can take the exact same trade setup — same entry and exit — but one could lose 50% of his account, while the other loses just 1%. That’s the power of position sizing.
The Role of Risk Management in Position Sizing
Before we dive into methods, let’s lay the foundation: risk management.
The golden rule in trading: Never risk more than a small fraction of your capital on a single trade.
Commonly used: 1% Rule or 2% Rule.
Risk 1% of your account per trade.
Example: If you have ₹1,00,000, risk only ₹1,000 per trade.
Now, here’s the beauty: By limiting risk per trade, even if you face a losing streak, you can still survive.
Imagine you risk 10% of your capital per trade. After just 10 losing trades, your account is wiped out. But if you risk 1% per trade, you’d need 100 consecutive losing trades to lose everything. That’s survival power.
Position Sizing Methods
There’s no one-size-fits-all approach. Traders use different methods depending on style, psychology, and goals. Let’s go through the major ones:
1. Fixed Dollar Method
Decide a fixed amount to risk on every trade.
Example: “I’ll risk ₹2,000 per trade no matter what.”
Simple but not flexible. Works for beginners.
2. Fixed Percentage Method
Risk a set percentage of account equity per trade.
Example: 2% risk rule. If account = ₹1,00,000 → risk = ₹2,000.
Dynamic: As account grows, risk amount grows.
3. Kelly Criterion
A mathematical formula to maximize long-term growth by balancing win rate and risk-reward.
Powerful, but aggressive.
Example: If you win 60% of trades with 2:1 reward/risk, Kelly suggests a certain % of capital to risk.
Many traders use half-Kelly for safety.
4. Volatility-Based Position Sizing
Position size adjusts to stock volatility.
Use ATR (Average True Range) or standard deviation.
More volatile stocks → smaller size.
Less volatile → larger size.
Helps normalize risk across different stocks.
5. Risk/Reward-Driven Sizing
Position based on expected reward vs. risk.
Example: If reward:risk is 3:1, you may size slightly larger.
Ensures high probability trades get priority.
6. Scaling In & Out
Scaling in: Enter gradually, adding positions as trade confirms.
Scaling out: Reduce position as profit builds, locking gains.
Useful in trending or uncertain markets.
Mathematical Foundations
Let’s go step by step:
Formula:
Position Size = (Account Risk per Trade) ÷ (Trade Risk per Share)
Account Risk per Trade = % of account × account size.
Trade Risk per Share = Entry Price – Stop Loss.
Example:
Account = ₹1,00,000.
Risk per trade = 2% = ₹2,000.
Stock entry = ₹500, Stop loss = ₹490 → Risk per share = ₹10.
Position size = ₹2,000 ÷ ₹10 = 200 shares.
This formula keeps every trade within safe limits, regardless of stock price.
Psychology of Position Sizing
This is where most traders fail. Even with formulas, emotions creep in:
Greed: “This setup looks perfect, let me double my size.”
Fear: “I just had three losses; let me reduce my size drastically.”
Overconfidence: After a winning streak, traders often oversize.
Revenge trading: Going all-in after losses to “win it back.”
The art of position sizing isn’t just math — it’s discipline. Sticking to your rules despite emotions is what separates pros from amateurs.
Position Sizing in Different Trading Styles
Day Trading: Smaller time frames, quick exits. Use tight stop-loss → often larger position sizes.
Swing Trading: Wider stop-loss, overnight risks. Position size smaller to balance.
Long-Term Investing: Position sizing matters less per trade, but diversification becomes key.
Options & Futures: Leverage complicates sizing. Need margin-based calculations and higher discipline.
Adapting Position Sizing to Market Conditions
High Volatility Markets: Reduce position size. Survive turbulence.
Calm/Trending Markets: Increase size cautiously to capture trends.
During Losing Streaks: Reduce size temporarily to preserve confidence and capital.
During Winning Streaks: Carefully increase size, but avoid over-leverage.
Position Sizing Mistakes to Avoid
All-in mentality.
One bad trade can end your career.
Averaging down blindly.
Throwing good money after bad.
Ignoring correlations.
Buying 3 different banking stocks = concentration risk.
Sizing based on gut feel, not rules.
Leads to inconsistency.
Case Studies & Practical Examples
The Blow-Up Trader
Started with ₹2,00,000. Risked 20% per trade. After 5 losses, wiped out.
Lesson: Poor position sizing = fast death.
The Survivor Trader
Started with ₹2,00,000. Risked 1% per trade = ₹2,000.
Even after 10 losses, only down 10%. Account intact.
Lesson: Survival > glory.
The Professional Fund Manager
Doesn’t risk more than 0.5%–1% per trade.
Manages billions, but each trade is just a small piece.
Lesson: Longevity and risk control matter most.
Position Sizing as an Art
So far, we’ve discussed the science — formulas, rules, risk percentages. But in real life, position sizing is also an art.
It requires judgment — when to size up, when to stay small.
It requires psychological control — sticking to plans.
It requires adaptability — markets change, volatility changes.
Great traders think of position sizing like a volume knob: turning risk up and down depending on conditions, but never letting it break the system.
Conclusion
At its core, position sizing is about survival first, profits second. You can have the best strategy in the world, but without proper sizing, you’ll blow up before you can reap the rewards.
The art of position sizing is:
Mathematical discipline (formulas, risk per trade).
Psychological discipline (controlling greed/fear).
Strategic flexibility (adapting to markets).
So next time you’re about to hit “buy” or “sell,” ask yourself:
How much am I risking?
Is this within my rules?
If I lose, can I survive to trade another day?
Because in trading, the ultimate goal isn’t to win one big trade.
The ultimate goal is to stay in the game long enough to let compounding work its magic.

Gift of waiting.Trendline was respected, Target was small because liquidity hunt is pending at possible POI

