Long Ethereum it's a daily block targetYou can long Ethereum fron this prolonged support can keep daily block target
Trade ideas
PCR Trading StrategiesCommon Mistakes & Myths about Options
Myth: Options are only for experts. (Truth: Beginners can use basic strategies safely.)
Mistake: Treating options like lottery tickets.
Mistake: Ignoring time decay and volatility.
Mistake: Over-trading due to low cost of buying options.
Future of Option Trading
Algo & Quant Trading: Algorithms dominate global options volume.
Retail Boom: Platforms like Zerodha, Robinhood, and Binance bring retail investors into options.
AI & Machine Learning: Predictive models for volatility and pricing.
Global Expansion: Options on new assets like carbon credits, crypto, and ETFs.
Conclusion
Option trading is a powerful tool — a double-edged sword. It can be used for risk management, speculation, or income generation. To master options, one must:
Learn the basics (calls, puts, pricing).
Understand strategies (spreads, straddles, condors).
Respect risk management and psychology.
Stay updated with market trends and regulations.
With proper discipline, options can transform how you interact with markets, offering opportunities that stocks and bonds alone cannot.

sometimes You need nothing new its just a repetationEth repeted same level trade. Its just a hourly supply that identified and repeteadly played 3 times. easy pips...

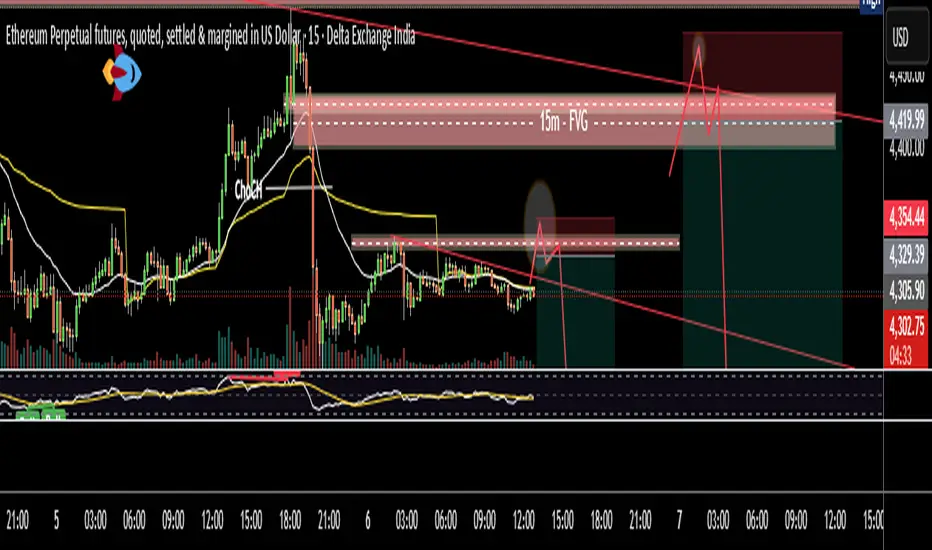
ETH multiple Sell OpportunitiesETH is moving in range for almost a week time. Now it has shown a displacement after ChoCH and formed a bearish 15m FVG. There may be a good trade at sell side if price approach it. Well there are two trade scenarios are forming.
Trade # 1
1. Price is moving around a short term trend line and resistance.
2. If price breaks trend line and take the liquidity of resistance than it may be sell trade.
Trade # 2
3. Price moves to 15m FVG and OTE overlap zone.
4. Most probably price will take liquidity of FVG zone and break trend line.
5. After breaking trend line it should pullback till FVG/trend line or any newly created OB/FVG.
All these combinations are signaling a high probability and high Risk and Reward (1:8) trade scenario.
Note – if you liked this analysis, please boost the idea so that other can also get benefit of it. Also follow me for notification for incoming ideas.
Also Feel free to comment if you have any input to share.
Disclaimer – This analysis is just for education purpose not any trading suggestion. Please take the trade at your own risk and with the discussion with your financial advisor.
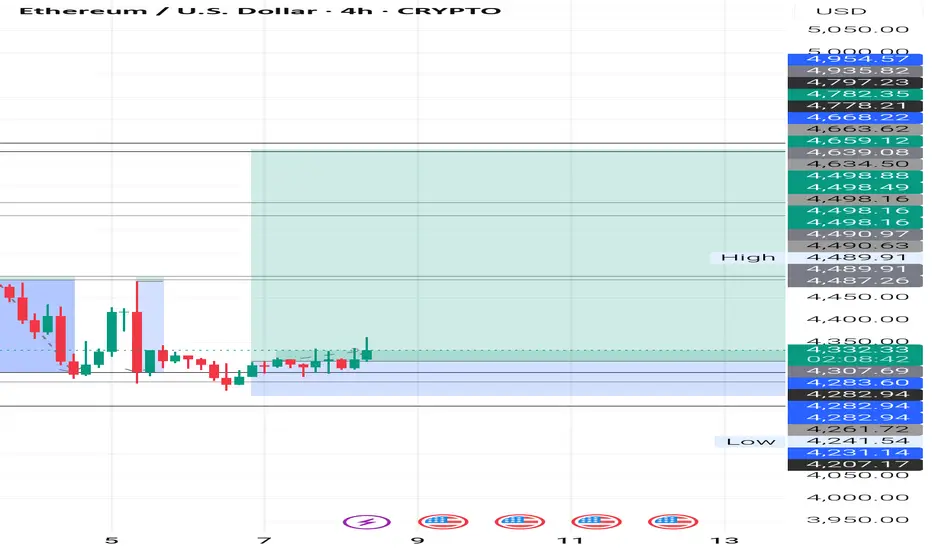
ETH–USD 2 Hour ViewEthereum vs USD — 2-Hour Timeframe Levels
You asked for key price levels on a 2-hour chart. While I can't generate live 2-hour chart data here, I can share recent technical insights with support and resistance levels, plus your current price context.
⏺ Key Technical Levels (as of early September 2025):
Support Zones:
$4,360 — initial support area
$4,315 — next downside level
Below that: $4,260 and $4,220 are cited as further downside supports
Resistance Zones:
$4,500 — key resistance, blockage for current rally
If surpassed: $4,520 and $4,555 are possible next targets
Extended resistance: up to $4,620, then $4,660 or even $4,720 if momentum builds
Mid-range / Technical Sentiment:
Recent consolidation between $4,350–$4,450, holding above the 100-hour SMA with rebound potential
Daily chart structure remains bullish as long as ETH stays above $4,000; a breakdown below that could weaken structure
Next Steps for You:
Use a charting platform (e.g., TradingView) with a 2-hour timeframe and apply horizontal lines at these zones.
Watch for price action: Does ETH bounce at support? Does it stall or break through resistance? Candlestick patterns and volume around these levels help refine entries/exits.
Play momentum: Watch aggressiveness above $4,500 with targets at $4

ETH USD FOR NEAR BREAKOUT price crypto at good levels for buying update good time to invest in this stock and price at very cheeper price ..I think price may be move further and maximum stoploss 4000 rs

The Art of Position SizingIntroduction: Why Position Sizing is the Silent Weapon
When most people think about trading success, they picture things like stock picking, finding the next multibagger, or timing the market perfectly. But the truth is, none of these alone will make you a consistently profitable trader. The difference between traders who survive and thrive versus those who blow up their accounts often comes down to one thing: position sizing.
Position sizing is the art and science of deciding how much to risk on a trade. It’s not glamorous. It doesn’t make headlines like “XYZ stock doubled in a week.” But it’s the most powerful tool you have for controlling risk, managing emotions, and growing capital over the long term.
Think of trading like sailing. The market is the ocean — unpredictable, sometimes calm, sometimes stormy. Your strategy is the ship. But position sizing? That’s the steering wheel. Without it, even the strongest ship can sink.
In this article, we’ll dive deep into the art of position sizing, explore different methods, psychological aspects, and real-world applications, and by the end, you’ll understand why smart traders say: “It’s not about being right, it’s about surviving long enough to grow.”
What is Position Sizing?
In simple terms, position sizing answers the question:
“How many shares (or contracts/lots) should I buy or sell on this trade?”
Let’s take an example. Suppose you have ₹1,00,000 as trading capital. You see a stock trading at ₹500 and want to buy. Should you buy 20 shares, 100 shares, or go all-in with 200 shares? The answer depends on:
Your risk tolerance per trade (how much you’re comfortable losing if it goes wrong).
Your stop-loss level (the price at which you’ll exit if the trade fails).
Market conditions (volatility, liquidity, trend strength).
Two traders can take the exact same trade setup — same entry and exit — but one could lose 50% of his account, while the other loses just 1%. That’s the power of position sizing.
The Role of Risk Management in Position Sizing
Before we dive into methods, let’s lay the foundation: risk management.
The golden rule in trading: Never risk more than a small fraction of your capital on a single trade.
Commonly used: 1% Rule or 2% Rule.
Risk 1% of your account per trade.
Example: If you have ₹1,00,000, risk only ₹1,000 per trade.
Now, here’s the beauty: By limiting risk per trade, even if you face a losing streak, you can still survive.
Imagine you risk 10% of your capital per trade. After just 10 losing trades, your account is wiped out. But if you risk 1% per trade, you’d need 100 consecutive losing trades to lose everything. That’s survival power.
Position Sizing Methods
There’s no one-size-fits-all approach. Traders use different methods depending on style, psychology, and goals. Let’s go through the major ones:
1. Fixed Dollar Method
Decide a fixed amount to risk on every trade.
Example: “I’ll risk ₹2,000 per trade no matter what.”
Simple but not flexible. Works for beginners.
2. Fixed Percentage Method
Risk a set percentage of account equity per trade.
Example: 2% risk rule. If account = ₹1,00,000 → risk = ₹2,000.
Dynamic: As account grows, risk amount grows.
3. Kelly Criterion
A mathematical formula to maximize long-term growth by balancing win rate and risk-reward.
Powerful, but aggressive.
Example: If you win 60% of trades with 2:1 reward/risk, Kelly suggests a certain % of capital to risk.
Many traders use half-Kelly for safety.
4. Volatility-Based Position Sizing
Position size adjusts to stock volatility.
Use ATR (Average True Range) or standard deviation.
More volatile stocks → smaller size.
Less volatile → larger size.
Helps normalize risk across different stocks.
5. Risk/Reward-Driven Sizing
Position based on expected reward vs. risk.
Example: If reward:risk is 3:1, you may size slightly larger.
Ensures high probability trades get priority.
6. Scaling In & Out
Scaling in: Enter gradually, adding positions as trade confirms.
Scaling out: Reduce position as profit builds, locking gains.
Useful in trending or uncertain markets.
Mathematical Foundations
Let’s go step by step:
Formula:
Position Size = (Account Risk per Trade) ÷ (Trade Risk per Share)
Account Risk per Trade = % of account × account size.
Trade Risk per Share = Entry Price – Stop Loss.
Example:
Account = ₹1,00,000.
Risk per trade = 2% = ₹2,000.
Stock entry = ₹500, Stop loss = ₹490 → Risk per share = ₹10.
Position size = ₹2,000 ÷ ₹10 = 200 shares.
This formula keeps every trade within safe limits, regardless of stock price.
Psychology of Position Sizing
This is where most traders fail. Even with formulas, emotions creep in:
Greed: “This setup looks perfect, let me double my size.”
Fear: “I just had three losses; let me reduce my size drastically.”
Overconfidence: After a winning streak, traders often oversize.
Revenge trading: Going all-in after losses to “win it back.”
The art of position sizing isn’t just math — it’s discipline. Sticking to your rules despite emotions is what separates pros from amateurs.
Position Sizing in Different Trading Styles
Day Trading: Smaller time frames, quick exits. Use tight stop-loss → often larger position sizes.
Swing Trading: Wider stop-loss, overnight risks. Position size smaller to balance.
Long-Term Investing: Position sizing matters less per trade, but diversification becomes key.
Options & Futures: Leverage complicates sizing. Need margin-based calculations and higher discipline.
Adapting Position Sizing to Market Conditions
High Volatility Markets: Reduce position size. Survive turbulence.
Calm/Trending Markets: Increase size cautiously to capture trends.
During Losing Streaks: Reduce size temporarily to preserve confidence and capital.
During Winning Streaks: Carefully increase size, but avoid over-leverage.
Position Sizing Mistakes to Avoid
All-in mentality.
One bad trade can end your career.
Averaging down blindly.
Throwing good money after bad.
Ignoring correlations.
Buying 3 different banking stocks = concentration risk.
Sizing based on gut feel, not rules.
Leads to inconsistency.
Case Studies & Practical Examples
The Blow-Up Trader
Started with ₹2,00,000. Risked 20% per trade. After 5 losses, wiped out.
Lesson: Poor position sizing = fast death.
The Survivor Trader
Started with ₹2,00,000. Risked 1% per trade = ₹2,000.
Even after 10 losses, only down 10%. Account intact.
Lesson: Survival > glory.
The Professional Fund Manager
Doesn’t risk more than 0.5%–1% per trade.
Manages billions, but each trade is just a small piece.
Lesson: Longevity and risk control matter most.
Position Sizing as an Art
So far, we’ve discussed the science — formulas, rules, risk percentages. But in real life, position sizing is also an art.
It requires judgment — when to size up, when to stay small.
It requires psychological control — sticking to plans.
It requires adaptability — markets change, volatility changes.
Great traders think of position sizing like a volume knob: turning risk up and down depending on conditions, but never letting it break the system.
Conclusion
At its core, position sizing is about survival first, profits second. You can have the best strategy in the world, but without proper sizing, you’ll blow up before you can reap the rewards.
The art of position sizing is:
Mathematical discipline (formulas, risk per trade).
Psychological discipline (controlling greed/fear).
Strategic flexibility (adapting to markets).
So next time you’re about to hit “buy” or “sell,” ask yourself:
How much am I risking?
Is this within my rules?
If I lose, can I survive to trade another day?
Because in trading, the ultimate goal isn’t to win one big trade.
The ultimate goal is to stay in the game long enough to let compounding work its magic.

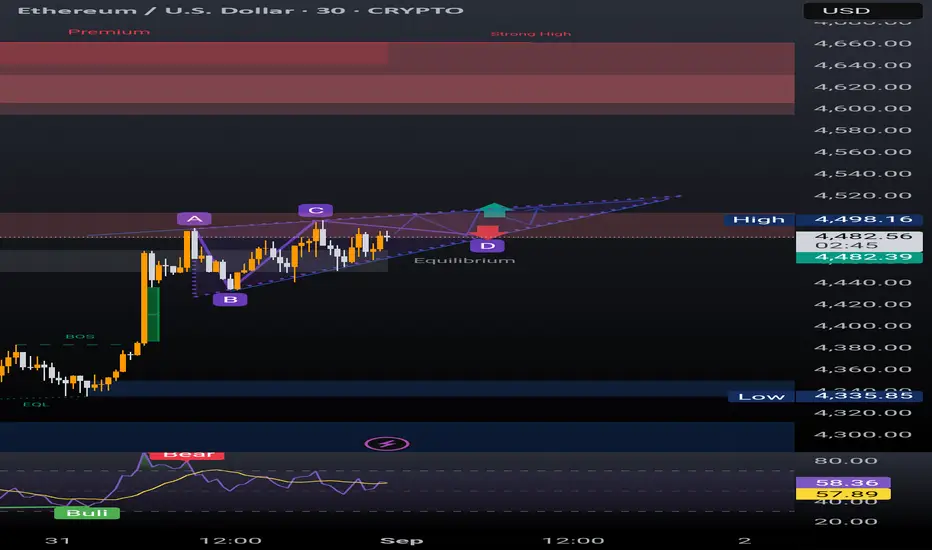
Gift of waiting.Trendline was respected, Target was small because liquidity hunt is pending at possible POI


Difference Between Shares & Mutual Funds1. Introduction
Investing is one of the most powerful ways to grow wealth. However, beginners often get confused about where to invest – should they directly buy shares of a company, or should they put money into mutual funds?
Both are popular investment vehicles in India and worldwide, but they work very differently. Shares represent direct ownership in a company, while mutual funds represent indirect ownership, where a professional fund manager pools money from many investors and invests in shares, bonds, or other securities on their behalf.
Understanding the difference between the two is crucial because your choice will depend on your risk appetite, knowledge, investment horizon, and financial goals.
In this article, we will deeply explore the differences between shares and mutual funds in simple, human-friendly language.
2. What are Shares?
Definition:
A share is a unit of ownership in a company. When you buy shares of a company, you become a shareholder, which means you own a small portion of that company.
Example: If a company issues 1,00,000 shares and you buy 1,000 of them, you own 1% of the company.
Key Features of Shares:
Direct Ownership – You directly hold a piece of the company.
Voting Rights – Shareholders often get voting rights in company decisions.
Dividends – Companies may share profits with shareholders in the form of dividends.
Capital Appreciation – If the company grows, the value of your shares rises.
Types of Shares:
Equity Shares – Regular shares with ownership and voting rights.
Preference Shares – Fixed dividend, but limited voting rights.
Example:
Suppose you buy shares of Reliance Industries. If Reliance grows, launches new businesses, and earns higher profits, the value of your shares may increase from ₹2,500 to ₹3,500, giving you a good return.
But if Reliance faces losses, the share price may fall, and you can lose money.
Thus, shares are high-risk, high-reward investments.
3. What are Mutual Funds?
Definition:
A mutual fund is an investment vehicle that collects money from many investors and invests it in a diversified portfolio of shares, bonds, or other assets.
A professional fund manager decides where to invest, so you don’t have to pick individual stocks.
Key Features of Mutual Funds:
Indirect Ownership – You don’t directly own shares of companies; you own units of the mutual fund.
Diversification – Money is spread across many securities, reducing risk.
Professional Management – Experts manage your money.
Liquidity – You can redeem your units anytime (except in lock-in funds like ELSS).
Types of Mutual Funds:
Equity Mutual Funds – Invest mainly in company shares.
Debt Mutual Funds – Invest in bonds and fixed-income securities.
Hybrid Funds – Invest in a mix of equity and debt.
Index Funds – Simply track an index like Nifty 50.
Example:
Suppose you invest ₹50,000 in an HDFC Equity Mutual Fund. That money may get spread across 30–50 different stocks like Infosys, TCS, HDFC Bank, Reliance, etc. Even if one stock falls, the other stocks may balance it out.
Thus, mutual funds are moderate-risk, managed investments suitable for beginners.
4. Key Differences Between Shares & Mutual Funds
Feature Shares Mutual Funds
Ownership Direct ownership in a company Indirect ownership through fund units
Risk High (depends on single company) Lower (diversified portfolio)
Returns High potential but uncertain Moderate and stable
Management Self-managed (you decide) Professionally managed
Cost Brokerage + Demat charges Expense ratio (1–2%)
Liquidity High (buy/sell anytime in market hours) High (redeem units, except in lock-in)
Taxation Capital gains tax Capital gains tax, indexation benefit on debt funds
Knowledge Needed High (requires market understanding) Low (fund manager handles it)
5. Advantages & Disadvantages of Shares
✅ Advantages:
High return potential.
Direct ownership and control.
Dividends as additional income.
Liquidity – can sell anytime.
❌ Disadvantages:
Very risky and volatile.
Requires knowledge and research.
No guaranteed returns.
Emotional stress during market falls.
6. Advantages & Disadvantages of Mutual Funds
✅ Advantages:
Diversification reduces risk.
Managed by experts.
Suitable for beginners.
Flexible – SIP (Systematic Investment Plan) possible.
❌ Disadvantages:
Returns are moderate compared to direct stocks.
Expense ratio reduces profits.
No control over which stocks are chosen.
Some funds may underperform.
7. Which is Better for You?
If you have time, knowledge, and risk appetite, go for Shares.
If you want professional management and diversification, go for Mutual Funds.
Many investors do a mix of both – mutual funds for long-term stability and some shares for higher returns.
8. Practical Examples
Investor A buys Infosys shares for ₹1,00,000. If Infosys doubles in 5 years, he makes ₹2,00,000. But if Infosys crashes, he may end up with only ₹50,000.
Investor B puts ₹1,00,000 in a Mutual Fund that holds Infosys + 30 other stocks. Even if Infosys crashes, other stocks balance out, and his fund grows steadily to ₹1,60,000 in 5 years.
9. Conclusion
The main difference between Shares and Mutual Funds lies in direct vs. indirect ownership, risk levels, and management style.
Shares are like driving your own car – full control, high speed, but risky if you don’t know how to drive.
Mutual Funds are like hiring a driver – safer, more comfortable, but less thrilling.
For beginners, mutual funds are safer, while for experienced investors, shares offer higher growth opportunities.
Ultimately, the best strategy is to balance both according to your financial goals.

ETH Possible MoveETH currently is making a Peanut Pattern. One can also call this a Pole and Flag pattern. Hence, look for a breakout and breakdown of this pattern and keep a check on the chart.
Hope this study helps in learning and understanding chart patterns better.
Jai Shree Ram.
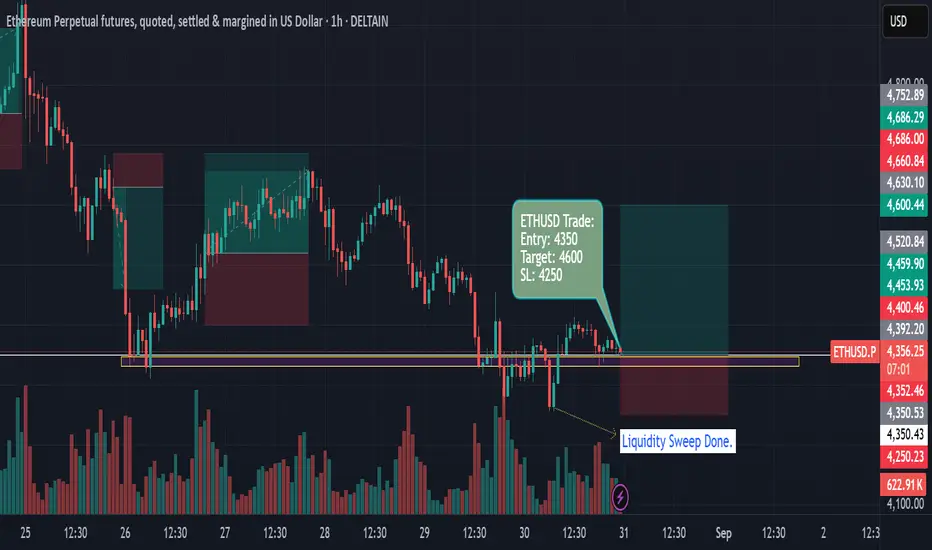
ETHUSD 1H — Liquidity Sweep Reversal with Precision EntryTrade Summary
• Entry: $4,350
• Target: $4,600
• Stop Loss: $4,250
• Risk/Reward Ratio: 2.5:1
After a significant liquidity sweep just below $4,350, Ethereum Perpetual Futures have reclaimed support and established a potential reversal base. The trade enters at $4,350, with a tight stop loss at $4,250, banking on the exhaustion of sellers and fresh momentum above reclaimed support. The target is $4,600, right before a major resistance cluster and previous swing high, offering clarity on profit-taking and risk parameters.
Recent price action signals a shift from bearish momentum to consolidation, as aggressive buyers absorbed supply during the liquidity sweep — a signature move that often precedes sustained rallies. The setup features:
• Clear horizontal support with visible volume confirmation
• Precise entry post-sweep for maximum risk efficiency
• Stop loss positioned below the sweep zone for strict invalidation
• Well-defined target near a high liquidity supply area
Why I like it: Excellent risk management, technical clusters, and early signs of trend reversal. Would love feedback from the community on additional confluence factors or alternate views!
ETH/USD 4H – Losing Momentum at Key LevelsEthereum is struggling to hold above its ascending trendline after rejection from the $4,800–$4,880 resistance zone. Price is currently trading around $4,395, sitting just above support at $4,186 and $4,066.
📉 ETH has broken below its short-term uptrend while the 200 EMA ($4,184) now acts as a crucial support zone. A breakdown below this level could accelerate downside pressure.
📊 Indicators:
RSI (14): Around 42, showing bearish momentum with room for further downside before oversold levels.
ADX (14): At 26, indicating a weakening trend strength compared to previous moves.
🔻 Bearish Scenario: Failure to defend $4,184–$4,066 could open the door for deeper retracements.
🔺 Bullish Scenario: A reclaim of the descending trendline and $4,792 resistance would be the first sign of recovery.
⚡ ETH is at a decision point — support retest or deeper correction.

ETHUSD Harmonic Pattern AnalysisPattern Analysis
• The chart identifies a possible harmonic pattern (likely a Bat or Gartley) with labeled points X, A, B, C, and a projected D.
• Crucial level noted at USD, referred to as “Eye of the Harmonic,” representing a significant support/resistance.
• The chart suggests, “Harmonic D can be Tested if pt B Breaks,” implying bearish potential if the price drops below point B.
• Current ETHUSD price is 4,336, with a recent decline of about 3.88%, and visible moving averages providing trend context.
Key Technical Points
• Swing trading setup: Uses harmonic pattern recognition for potential entry/exit decisions.
• Resistance & Support zones: Eye of the Harmonic ( USD) and potential future support region near projected point D ( USD).
• Indicators: The chart overlays zone levels, moving averages, and pattern ratios (e.g., 0.523, 0.785, 1.194, 1.419), which are standard in harmonic pattern calculations.
Potential Scenario
• If price breaks below point B, traders may target the level indicated by point D for possible support or reversal opportunities.
• The scenario implies caution for long positions until the price confirms support above crucial harmonic levels.

ETH HnSA Head N Shoulder is being made in ETH in 4hr tf. It is also break a rising trendline support.
Entry- 4395-4400
SL- 4550
Target- One can look to book after one is to one or can also target the recent low it made that is 4200.
Disclaimer- This is just for educational purpose. Please take advice before making any decision.
Jai Shree Ram.

ETHUSD is ready to reach 4640 nowAs price analysis ETHUSD is ready to reach 4640 with in hours from now as per research on its bottom made at 4311 .
This not a trading advise. Only for education purpose.

ETH Buy at perfect zone.ETH Buy scenario at perfect zone. ETH is creating a perfect scenario for buy on 4H TF.
1. Price is at support, FVG and OB confluence in premium zone at OTE.
2. Also showing rejection in price action.
3. Trend line is faked out.
P.S. - it is just analysis not any trade recommendation.

ETH short trade plan on 15 minEth is down, Fell good during NY session, a small bounce inviting Cheap buyers to get in and get a higher fill for shorts.
when 50 ema is trending all bounces towards the 50 ema + failure should be considered shorts
For long: let it cross + dip + continuation then buy

Bearish Trade Setup for ETH/USDOverview:
The setup for this trade is based on a bearish outlook for Ethereum (ETH) against the US Dollar (USD) on the 1-hour chart. The entry, stop loss, and take profit levels are carefully defined to provide a balanced risk-to-reward ratio. Here's why this setup is a solid trade idea:
1. Trade Entry:
Entry Price: 4574.87
The entry point is set based on a recent price retracement within the prevailing downtrend. The price has shown signs of rejection from key resistance levels, and the trade is positioned to capitalize on further downside momentum.
2. Target Price:
Target Price: 4241.87
The target level is derived from technical analysis, where price is expected to move toward previous support levels, presenting a logical exit point for profits.
3. Stop Loss:
Stop Loss Price: 4741.37
The stop loss is placed above recent swing highs, ensuring the trade has enough room to breathe while minimizing the risk of false breakouts. This level is a protective measure to ensure that a reversal or unexpected price movement does not lead to unnecessary losses.
4. Risk-to-Reward Ratio:
RRR: The trade has an acceptable risk-to-reward ratio, where the potential reward outweighs the risk by more than 1:1. This is crucial for maintaining profitability over the long term.
5. Trend Analysis:
The market is currently in a bearish phase, as seen in the price action and the overall downtrend. The setup capitalizes on this momentum with a proper risk management strategy.
The use of indicators like moving averages can further confirm the downtrend, though they are not displayed here, they should align with the bearish trend.
6. Volume Confirmation:
The volume should ideally be decreasing during the retracement phase and increase during the move towards the target price, confirming the bearish continuation.
7. Conclusion:
This trade is well-positioned to take advantage of a continuation of the bearish trend. The entry, stop loss, and target are all logically placed based on key price levels and risk management principles. As always, ensure to monitor the trade, and be ready to adjust if market conditions change unexpectedly.

LONG ETH for 5000$ETH showing signs of Inside bar on daily timeframe. LONG here for a 5000$+ target.

ETHUSD | Technical Analysis 25/08/2025Hi,
ETH can form inverted head and should and go upside upto 5100+. Time period can be 4 to 5 days.
Disclaimer: This is only for educational purpose.
Thanks

ETH BigBOEntry- 4555-4545
Targets- All time High
SL- 4465 (FIb Levels)
Reason- After a big volume candle near all time high ETH made a retracement and from here it can continue its upside journey towards all time high and 5050 Levels. Entry is being made in Fib Golden zone level which has been made in bigger tf that is daily tf and entry in taken in the shorter tf that is 1 hr tf.
Disclaimer- This is just for educational purpose.
Jai Shree Ram

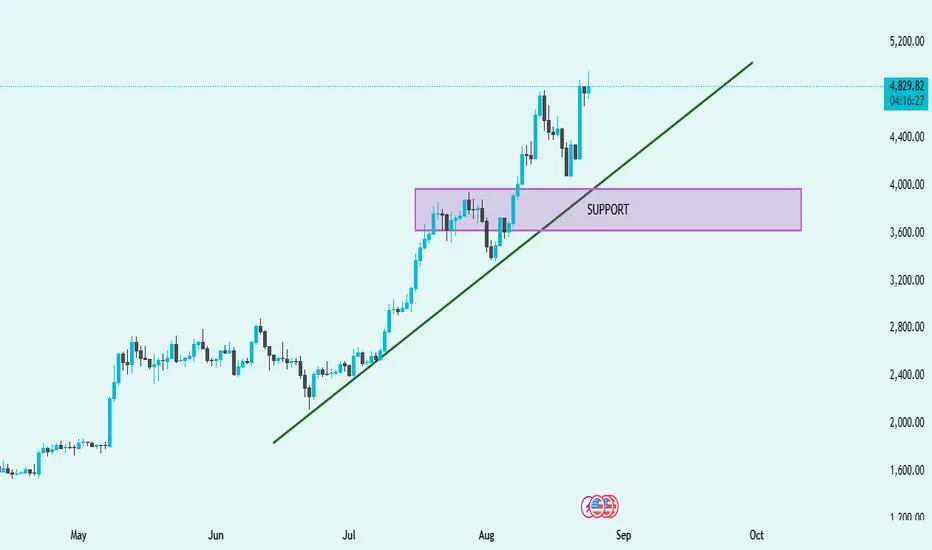
ETH/USD Technical Analysis – Strong Uptrend with Key Support📈 ETH/USD Technical Analysis – Strong Uptrend with Key Support
Trend Direction ➡️
The chart shows a clear bullish trend supported by an upward sloping trendline (green). Price action is consistently forming higher highs and higher lows, confirming strong upward momentum.
Support Zone 🟪
The highlighted support area (3,600 – 4,000) has been tested successfully. Price bounced strongly from this zone, showing buyers are actively defending this level.
Breakout & Momentum 🚀
After retesting support, ETH broke above the recent consolidation and is now trading around 4,843, pushing towards new highs. This signals bullish continuation if volume supports the move.
Trendline Confirmation 📐
The trendline has acted as a dynamic support multiple times. As long as ETH trades above it, the bullish trend remains intact.
Outlook 🔮
If ETH stays above 4,800, the next potential target could be 5,200+.
If price breaks below the trendline and the 3,600 support zone, bearish correction may begin.
✅ Summary: ETH is in a strong bullish trend 🚀, supported by both the trendline and key support zone. Short-term outlook remains bullish as long as 4,800 holds.