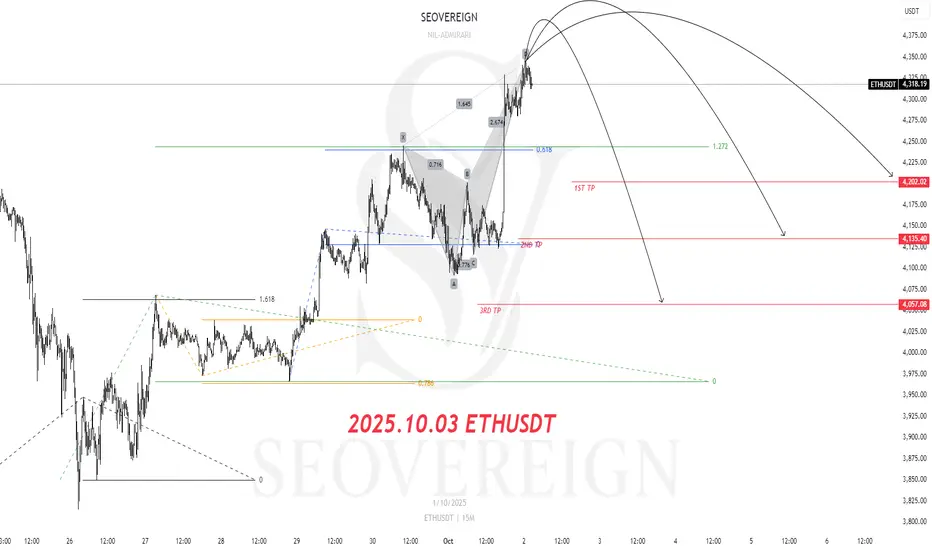
[SeoVereign] ETHUSDT BEARISH Outlook – October, 03 2025The key basis for presenting a bearish perspective in this idea is that the Crab pattern, one of the harmonic patterns, has been fully confirmed.
For clearer verification, I have directly plotted the relevant section on the chart for your reference.
For reference, the Crab pattern is an extended harmonic pattern with high volatility, typically forming point D at the 1.618 level relative to the XA wave, and is characterized by a strong reversal movement thereafter.
Due to these characteristics, it is evaluated as a highly reliable pattern within the Potential Reversal Zone (PRZ).
Accordingly, the average target price is set around 4,135.40 USDT.
Additional briefings will continue to be updated in this idea as the chart develops.
ETHUSDT.3S trade ideas
Part 11 Trading Master Class With ExpertsI. Option Trading Strategies
Buying Calls and Puts
Buying a Call: Profitable if asset price rises above strike + premium.
Buying a Put: Profitable if asset price falls below strike - premium.
Covered Call Strategy
Involves holding the underlying stock and selling a call option.
Generates premium income but limits upside profit.
Protective Put
Buying a put while holding the underlying asset as insurance against a price drop.
Spreads
Combine buying and selling options to reduce risk and cost:
Bull Call Spread: Buy lower strike call, sell higher strike call.
Bear Put Spread: Buy higher strike put, sell lower strike put
Straddles and Strangles
Straddle: Buy ATM call and put; profitable if price moves significantly either way.
Strangle: Buy OTM call and put; cheaper than straddle, requires larger movement.
Iron Condor
Advanced strategy combining bull and bear spreads.
Generates income with limited risk in low-volatility markets.
Calendar and Diagonal Spreads
Utilize different expiration dates and strikes to profit from time decay and volatility.
II. Risk Management in Options
Leverage and Risk
Options offer high leverage: small price moves in underlying asset can lead to large gains or losses. Proper position sizing is crucial.
Maximum Loss and Gain
Buyer: Max loss = premium paid; Max gain = theoretically unlimited for calls, limited for puts.
Seller: Max gain = premium received; Max loss = potentially unlimited for naked calls.
Diversification Across Strategies
Mixing spreads, covered calls, and protective puts helps reduce single-position risk.
Stop-Loss and Exit Strategies
Plan exit points: cut losses, take partial profits, or roll positions to new strikes or expirations.
III. Market Mechanics and Trading
Exchanges and Option Contracts
Options trade on regulated exchanges (e.g., NSE, BSE, CBOE). Each contract represents a fixed quantity of the underlying (e.g., 100 shares per contract).
Liquidity and Open Interest
Liquidity: Ease of buying/selling options at fair prices.
Open Interest: Number of outstanding contracts; higher OI often means better liquidity.
Implied Volatility and Market Sentiment
IV: Market’s forecast of future volatility.
Rising IV generally increases option premiums, signaling uncertainty.
Hedging vs. Speculation
Options can hedge existing positions or speculate on market movements. Hedging reduces risk, speculation increases risk but offers leverage.

3 - Possibile Outcome on $ETHAny of these three scenarios might play out on ETH: a continuation from here, or a drop to retest the H4 FVG followed by a reversal.

[SeoVereign] ETHEREUM BEARISH Outlook – October 05, 2025Hello everyone.
I hope you are all having a peaceful day.
Today, I am writing to share my short position perspective on Ethereum as of October 5th.
The first basis is the 1.13 Alternate Bat (ALT BAT). The Alternate Bat is a variation of the harmonic pattern established by Scott Carney, and its core principle lies in defining the PRZ (Potential Reversal Zone) where point D is located at 1.13 times the XA leg (=1.13XA). The convergence of these ratios creates a relatively narrow and reliable retracement (or reversal) zone, so when D is positioned around 1.13XA, it is necessary to carefully observe the potential for a short- or mid-term reversal.
The second basis is that an arbitrary wave N forms a 0.618 length ratio (that is, N ≒ 0.618 × M) with another arbitrary wave M. Among Fibonacci ratios, 0.618 (61.8%) is one of the representative standards used in Elliott Wave and harmonic analyses for measuring wave length and retracement. When one wave exhibits approximately 61.8% of another’s length, that point tends to act as a natural retracement or termination zone, and the reliability increases especially when it overlaps with other technical grounds.
Accordingly, the average target price is set around 4,415 USDT.
As the chart movement unfolds, I will provide updates on position management through revisions to this idea.
Thank you for reading.

E-Commerce Trading1. Introduction
E-commerce trading, also known as electronic commerce trading, represents the buying and selling of goods and services over digital platforms. Unlike traditional trading, which relies on physical stores, direct interaction, and manual processes, e-commerce operates over the internet, enabling global access, efficiency, and automation. With the exponential growth of internet penetration, smartphone usage, and digital payment systems, e-commerce trading has become one of the fastest-growing segments of the global economy.
E-commerce trading encompasses a broad spectrum of activities, including retail trading, wholesale trading, business-to-business (B2B) transactions, business-to-consumer (B2C) sales, consumer-to-consumer (C2C) platforms, and increasingly, business-to-government (B2G) operations. This digital marketplace has transformed traditional commerce by integrating technology, logistics, marketing, and finance, enabling businesses and consumers to interact seamlessly.
2. History and Evolution
Early Beginnings
The concept of e-commerce trading dates back to the late 20th century. Early examples include Electronic Data Interchange (EDI) systems used by corporations to exchange business documents electronically. The first online retail sale is often credited to the 1994 sale of a Sting CD via the website NetMarket. Soon after, Amazon and eBay emerged as pioneers, creating the blueprint for online marketplaces.
Technological Milestones
Several technological developments accelerated the growth of e-commerce trading:
Internet Expansion: The widespread availability of broadband internet allowed users to access online stores easily.
Secure Payment Gateways: Innovations like SSL encryption, PayPal, and later UPI, digital wallets, and credit/debit card integrations made online transactions secure and convenient.
Mobile Commerce: With smartphones becoming ubiquitous, mobile apps and responsive websites enabled trading anytime, anywhere.
AI and Data Analytics: Personalized recommendations, demand forecasting, and dynamic pricing became possible, improving trading efficiency.
Cloud Computing: Allowed scalable online storefronts and storage solutions for businesses without heavy infrastructure investments.
3. Types of E-Commerce Trading
E-commerce trading is not a monolithic concept; it can be categorized based on the nature of participants:
3.1 Business-to-Consumer (B2C)
B2C trading involves businesses selling directly to consumers. Amazon, Flipkart, Myntra, and Walmart are classic examples. This segment focuses on:
Product variety and convenience.
Personalized marketing using AI and customer analytics.
Rapid delivery services.
Seamless payment methods, including COD, wallets, and UPI.
3.2 Business-to-Business (B2B)
B2B platforms facilitate transactions between companies. Examples include Alibaba, IndiaMART, and ThomasNet. Key characteristics:
Bulk transactions at negotiated prices.
Long-term partnerships and contracts.
Integration of supply chain management with trading platforms.
3.3 Consumer-to-Consumer (C2C)
C2C platforms allow individuals to trade with each other. eBay, OLX, and Quikr are examples. Features include:
Peer-to-peer sales of used goods or handmade items.
Trust-building through rating systems.
Secure payment mechanisms to ensure safe trades.
3.4 Business-to-Government (B2G)
B2G trading involves businesses providing products or services to government agencies. Digital tendering platforms, government e-procurement systems, and contracts for public projects are part of this domain.
4. Key Components of E-Commerce Trading
E-commerce trading relies on multiple integrated components that ensure smooth operation:
4.1 Online Marketplace Platforms
Platforms such as Amazon, Flipkart, Shopify, and Etsy provide the digital infrastructure for trading. These platforms host multiple sellers, offer product search and categorization, manage orders, and facilitate payments.
4.2 Payment Gateways and Financial Services
Secure payment systems are the backbone of e-commerce. Payment gateways process online transactions, while financial technologies (FinTech) like UPI, PayPal, Stripe, and digital wallets ensure instant transfers and refunds.
4.3 Logistics and Supply Chain Management
Efficient trading requires prompt delivery. Logistics includes warehousing, transportation, inventory management, and last-mile delivery. Companies like DHL, FedEx, and Indian startups like Delhivery revolutionized supply chain efficiency.
4.4 Digital Marketing
E-commerce trading thrives on digital marketing strategies, including:
Search Engine Optimization (SEO)
Social media advertising
Influencer marketing
Email campaigns and retargeting
Personalized recommendation engines
4.5 Technology Infrastructure
Modern e-commerce trading depends on advanced technologies:
Cloud computing for scalable server architecture.
AI and machine learning for predictive analytics and chatbots.
Big data for consumer insights.
AR/VR for immersive shopping experiences.
Blockchain for secure transactions and supply chain transparency.
5. Advantages of E-Commerce Trading
E-commerce trading offers numerous benefits for both businesses and consumers:
5.1 Global Reach
Unlike traditional stores limited by location, e-commerce platforms enable businesses to reach customers worldwide, expanding market potential significantly.
5.2 Cost Efficiency
Lower overhead costs due to the absence of physical storefronts, reduced staff requirements, and automation in operations contribute to cost efficiency.
5.3 Convenience
Consumers can shop 24/7, compare prices, read reviews, and receive products at their doorstep, enhancing customer satisfaction.
5.4 Personalized Experiences
Using AI-driven recommendations and behavioral analytics, e-commerce platforms provide tailored product suggestions, increasing sales and customer loyalty.
5.5 Analytics-Driven Decisions
Real-time tracking of sales, customer preferences, and market trends allows businesses to make informed decisions about inventory, pricing, and marketing.
6. Challenges in E-Commerce Trading
Despite its growth, e-commerce trading faces significant challenges:
6.1 Cybersecurity Risks
Hacking, data breaches, and fraudulent transactions threaten businesses and consumer trust.
6.2 Logistics and Supply Chain Bottlenecks
Delivery delays, damaged products, and inventory mismanagement can reduce customer satisfaction.
6.3 Intense Competition
Low barriers to entry in e-commerce result in fierce competition, driving prices down and impacting profit margins.
6.4 Regulatory and Legal Issues
Compliance with tax laws, consumer protection regulations, cross-border trade laws, and data privacy rules is complex.
6.5 Technological Dependence
Overreliance on digital infrastructure exposes businesses to risks of downtime, server failures, or software glitches.
Conclusion
E-commerce trading has transformed the way businesses and consumers interact, creating an ecosystem that is fast, efficient, and global. It bridges the gap between markets and customers, empowers small businesses, and drives technological innovation. While challenges like cybersecurity, logistics, and competition remain, emerging trends in mobile commerce, AI, AR, and sustainability promise a bright and transformative future.
Businesses that adapt quickly, embrace technology, and prioritize customer-centric strategies are likely to thrive, while traditional models will need to evolve or collaborate with digital platforms to remain relevant. In essence, e-commerce trading is not just a trend—it is the new norm in global commerce, reshaping the very fabric of trade in the 21st century.

Ethereum: Bullish or Bearish? The Path AheadEthereum is at a critical juncture on its 4-hour chart. The price recently touched $4,180 and has started pulling back. The Fair Value Gaps (FVGs) in the $4,000–$4,100 zone suggest the market might revisit this area for a quick rebalancing before confirming the next move. In the short term, this is an important support level where the buyers will likely test their strength.
Trading volume spiked towards the end of September, showing that demand remains solid. However, the resistance at $4,180 could lead to a pullback towards the $4,100–$4,050 region before ETH gathers enough momentum for the next leg up. If the support holds, Ethereum might continue to rise towards $4,300, and even up to $4,500–$4,600 if resistance is broken.
That being said, the upcoming market volatility is likely to be driven by the US economic data, especially the NFP report. A weak report could spur expectations of a policy easing, which would benefit ETH, while strong data might trigger a pullback. Moreover, geopolitical tensions and the looming risk of a US government shutdown remain as wild cards that could shake things up.

ETHUSDT: Strong Uptrend with Solid SupportETHUSDT is currently experiencing a strong uptrend driven by the stability of the cryptocurrency market and strong fundamental factors. Despite some recent pullbacks, the primary trend remains bullish, supported by a solid foundation and positive investor sentiment.
Technical Analysis: ETHUSDT is currently testing a key support level at 3,985. If this level holds, there is a high probability of a rebound and continued upward momentum. The next resistance level is expected at 4,215.
Trading Strategy: If the price stays above the support level at 3,985, ETH is likely to continue rising towards the next resistance levels.
Outlook: Given the current fundamentals and technical indicators, ETHUSDT is likely to maintain its upward trajectory and target the 4,215 resistance level in the near future.

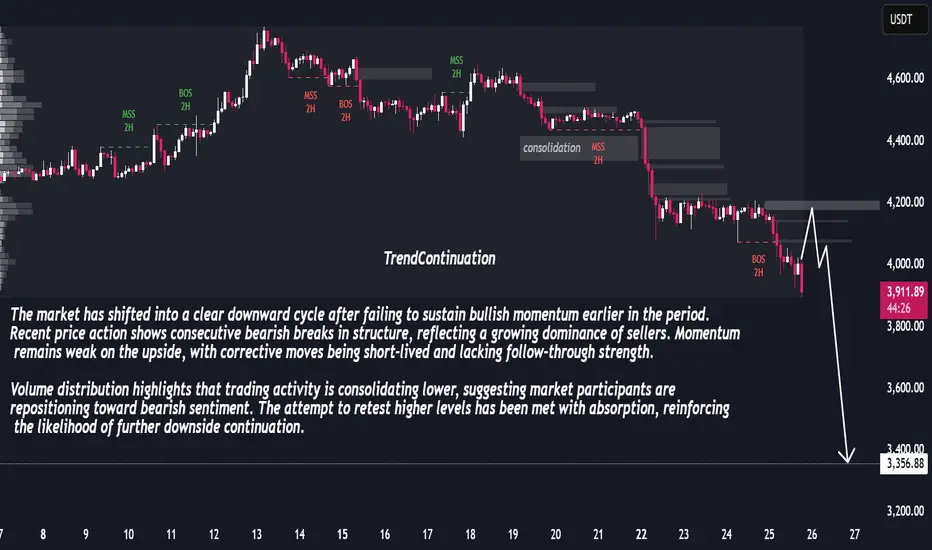
Liquidity Shift Suggests Extended Bearish CycleThe market is showing a progressive decline after losing upward strength. Recent swings indicate a decisive bearish control, with successive shifts in structure confirming the downward pressure. Attempts to recover higher levels have been shallow, reflecting exhaustion on the buy side and stronger liquidity flow toward sellers.
Market behavior suggests that rallies are being used as opportunities to exit or reposition short rather than initiate sustained bullish momentum. This is consistent with the overall weakening tone across the chart, where volatility spikes have favored downward extensions.
Looking ahead, if the current pace of distribution continues, the market is likely to maintain a bearish trajectory with potential for deeper declines as liquidity seeks out lower price ranges.
Part 2 Master Candlestick Pattern1. Liquidity Risk – When You Can’t Exit
Some options, especially far out-of-the-money strikes or illiquid stocks, don’t have enough buyers and sellers. This creates wide bid-ask spreads.
You may be forced to buy at a higher price and sell at a lower price.
In extreme cases, you might not find a counterparty to exit at all.
👉 Example:
Suppose you buy an illiquid stock option at ₹10. The bid is ₹8, and the ask is ₹12. If you want to sell, you may only get ₹8 — losing 20% instantly.
Lesson: Stick to liquid contracts with high open interest and trading volume.
2. Assignment Risk – The Surprise Factor
If you sell (write) options, you carry assignment risk. That means the buyer can exercise the option at any time (in American-style options).
A short call may be assigned if the stock rises sharply.
A short put may be assigned if the stock falls heavily.
👉 Example:
If you sell a put option of Infosys at ₹1,500 strike, and the stock crashes to ₹1,400, you may be forced to buy shares at ₹1,500 — incurring a huge loss.
Lesson: Always be prepared for early exercise if you are a seller.
3. Gap Risk – Overnight Shocks
Markets don’t always move smoothly. They can gap up or down overnight due to global events, earnings, or news. This is gap risk.
If you are holding positions overnight, you cannot control what happens after market close.
Protective stop-losses don’t work in gap openings because the market opens directly at a higher or lower level.
👉 Example:
You sell a call option on a stock at ₹500 strike. Overnight, the company announces stellar results, and the stock opens at ₹550. Your stop-loss at ₹510 is useless — you are already deep in loss.
Lesson: Overnight positions carry additional dangers.
4. Interest Rate and Dividend Risk
Option pricing models also factor in interest rates and dividends.
Rising interest rates generally increase call premiums and reduce put premiums.
Dividends reduce call prices and increase put prices because the stock is expected to fall on ex-dividend date.
For index options or long-dated stock options, ignoring this can lead to mispricing.
5. Psychological Risk – The Human Weakness
Not all risks come from markets. Many come from the trader’s own mind.
Greed: Holding on for bigger profits and losing it all.
Fear: Exiting too early or avoiding trades.
Overtrading: Trying to chase every move.
Revenge trading: Doubling down after a loss.
👉 Example:
A trader makes a profit of ₹20,000 in a day but refuses to book gains, hoping for ₹50,000. By market close, the profit vanishes and turns into a ₹10,000 loss.
Lesson: Emotional discipline is as important as technical knowledge.
6. Systemic & Black Swan Risks
Finally, there are risks no model can predict — sudden wars, pandemics, financial crises, regulatory bans, or exchange outages. These are systemic or Black Swan risks.
👉 Example:
In March 2020 (Covid crash), markets fell 30% in weeks. Option premiums shot up wildly, and many traders were wiped out.
Lesson: Always respect uncertainty. No system is foolproof.

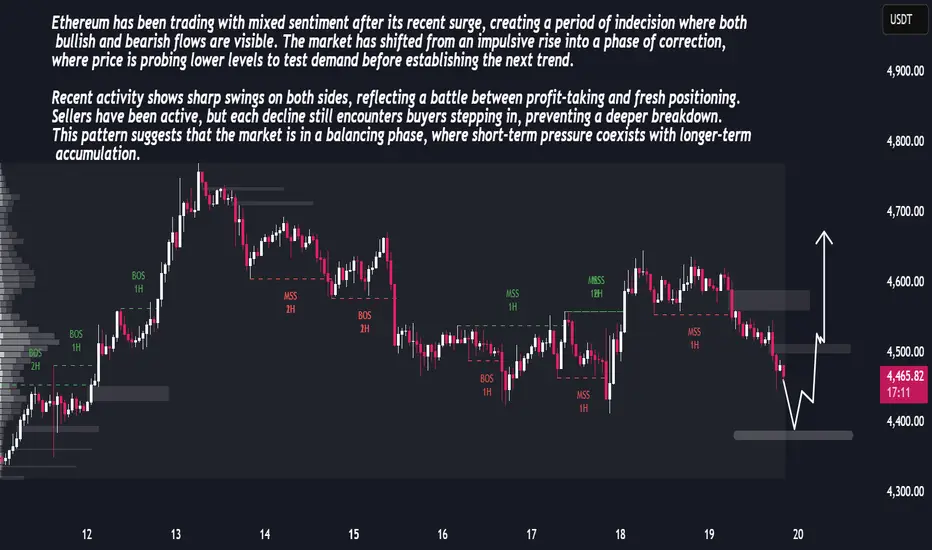
ETH Price Outlook – Consolidation Phase Before ExpansionETH Price Outlook – Consolidation Phase Before Expansion
Ethereum has been trading with mixed sentiment after its recent surge, creating a period of indecision where both bullish and bearish flows are visible. The market has shifted from an impulsive rise into a phase of correction, where price is probing lower levels to test demand before establishing the next trend.
Recent activity shows sharp swings on both sides, reflecting a battle between profit-taking and fresh positioning. Sellers have been active, but each decline still encounters buyers stepping in, preventing a deeper breakdown. This pattern suggests that the market is in a balancing phase, where short-term pressure coexists with longer-term accumulation.
The overall structure points toward a scenario where current weakness may serve as a preparation stage for another expansion move. Volatility is likely to remain elevated, and once liquidity pockets are cleared, momentum could shift more decisively, paving the way for stronger directional movement.
Long viewI am going long from here for the target of 5000 As per three drive pattern.
It also touched the 4hr orderblock and getting rejection too.
If everthing goes good this trade would be amazing 😍
Trade as per your risk management.
Thak you .

ETH plan 1/9/2025 LTFTrading Plan for ETH
Primary Scenario (Red Path)
Expect a pullback toward the 4,000 level, forming a potential bottom structure.
Alternate Scenario (Blue Path)
If price breaks below 4,000, watch for deeper retracement toward the FVG HTF (~3,800) or even the Demand zone (~3,400). This area may offer a higher-probability long setup for a rebound.
Plan will fail if ETH price reclaim 4900 zone
Key Levels to Watch
Resistance: 4,800–5,000 (YH)
Support: 4,000 (VAL), 3,800 (FVG), and 3,400 ~ 3,300 (Demand)
Strategy Notes
Look for confirmation signals (price action, volume) at key support zones.
Avoid chasing breakouts; focus on planned entries at zones of interest.
Use tight stops to manage risk, especially if price breaks below demand areas.

ETH Long🔎 Chart Breakdown:
1. Trendline Support (Orange Line)
• You’ve drawn an ascending trendline starting from Aug 26.
• Price just touched and bounced from this trendline around $4,490, showing it’s acting as a dynamic support.
2. EMA Indicators (15 & 35)
• Blue = EMA 15
• Yellow = EMA 35
• Currently, EMA 15 is below EMA 35 → short-term bearish bias, but if price holds the trendline, EMAs may start crossing bullish.
3. Support & Resistance Zones (Red & White Levels)
• Immediate support: $4,467 → just below current price.
• Major support: $4,370 → strong horizontal demand zone.
• Resistance levels:
• $4,570 (short-term resistance)
• $4,656 (next target/resistance)
• $4,854 (higher resistance).
4. Trade Setup on Chart (Green & Red Box)
• Looks like a long trade setup (buy position).
• Entry: Near $4,490 (trendline bounce).
• Take Profit (TP): Around $4,656.
• Stop Loss (SL): Below $4,370 zone.
• This gives a good risk-to-reward ratio if price respects the ascending trendline.
5. Volume
• No huge volume spike at the bounce, meaning confirmation is still weak.
• Need a strong bullish candle close above $4,570 for more conviction.
⸻
📌 Summary:
• ETH is bouncing from the ascending trendline at $4,490.
• If it holds, next upside targets are $4,570 → $4,656 → $4,854.
• If the trendline breaks, ETH could retest $4,370 support (and even $4,310 low).
This setup is a long position based on trendline support, but caution: if price closes below $4,467–$4,370, the bullish setup fails.

ETH BULLISHETHUSD formed bullish flag pattern
break the last HH and print new HH
GOOD BUYING AREA 4420 for the target 5400

Eth resistance break buy , trend line break sell . Resistance level break out buy entry plan
. trend line break out sell entry plan

Eth trend line break out entry plan. Fvg rejection
. resistance line rejection
. trend line break out entry plan

Ethereum 21-Aug-2025 PredictionAs Shown in the chart, the box at the bottom was the level to be tested and the swing should change from here onwards. Target would be the Box on the Top of the Chart. Positive for a 150 point move.

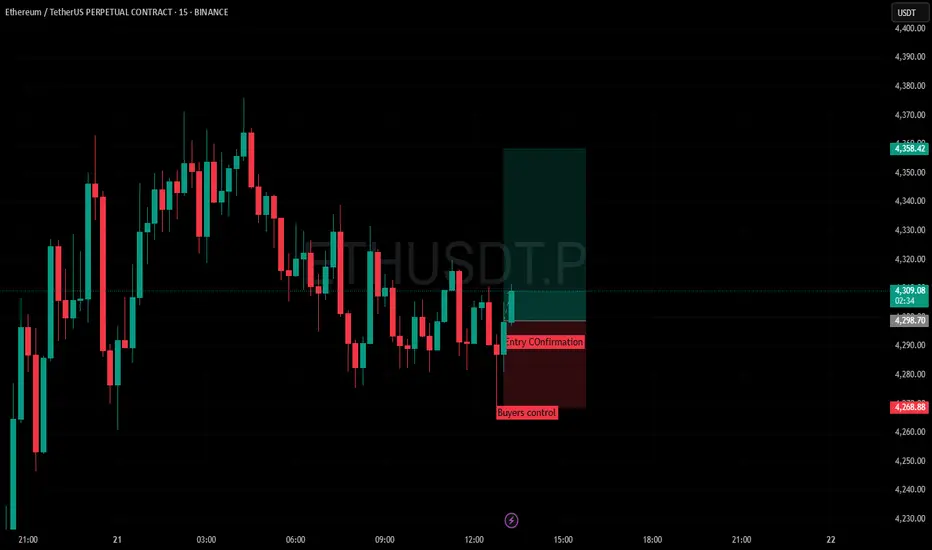
Simple Candlestick pattern Long tradeSimply wait for Buyers control and wait for confirmation candle that gives you volume and strength then entry and target for 1:2
ETH on the road to $10,000? Let’s break it down🔥 ETH on the road to $10,000? Let’s break it down 👇
Here’s why ETH looks stronger than ever:
1️⃣ Big Money Flowing In
🔹 ETFs & public companies bought 4.4M ETH ($20B) this quarter.
🔹 Whales & Web3 firms added another 2M ETH.
🔹 That’s more than 5% of total supply absorbed in just months.
2️⃣ Record Network Growth
🔹 DEX trading volume at new highs.
🔹 Daily transactions & active wallets breaking records.
🔹 Stablecoin supply at ATH.
👉 Demand for Ethereum’s network is exploding.
3️⃣ Massive Supply Crunch
🔹 30% staked, 8% with institutions, 25% with long-term holders.
🔹 5% permanently lost.
🔹 Only 12% left on exchanges, shrinking fast.
🔹 Inflation rate just 0.5%, even lower than Bitcoin.
With retirement funds opening ETH access, rate cuts coming, and pro-crypto regulations, the demand will only increase while supply dries up.
Short-term dips may shake out weak hands… but the bigger picture is clear: ETH is heading above $10K this cycle.
Note: NFA & DYOR

Breakout in ETHEREUMA Big Breakout has happened in Ethereum in weekly time frame.
The Coin shoul be holded for months to achieve its final target.
As price has reached all time high which is its first target.
Rest two targets are 7400 and 7700.
No SL should be placed as the coin should be acquired on holding basis.
Note: This analysis is for Educational Purpose Only. Please invest after consulting a professional financial advisor.

Can we get this - $ETHTomorrow we have the CPI, a drop to fill the Weekly FVG, and a run-up to make a new ATH.

[SeoVereign] ETHEREUM Outlook – August 12, 2025I will present a short position perspective on Ethereum for August 12.
This idea is based on the premise that the direction is downward, derived from a strict counting of Bitcoin, and the specific entry point was set based on the Shark pattern.
Accordingly, the average take-profit target was set at around 4,126 USDT.
I plan to continue updating this idea as the movement unfolds.
Thank you.

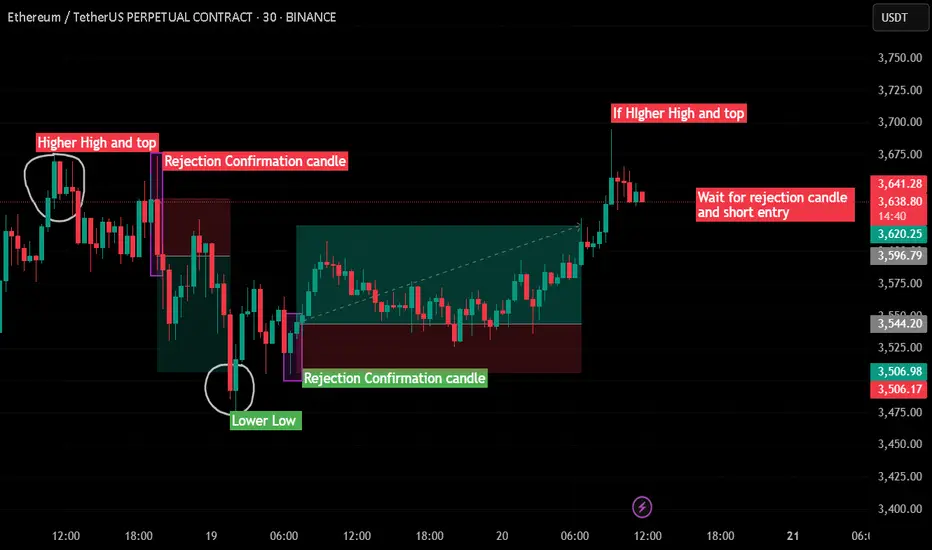
Trend Reversal Rejection Strategy | Higher High + Candle Confirm🔍 Idea Summary:
This strategy focuses on identifying trend reversal zones using classic Higher High (HH) and Lower Low (LL) structures followed by rejection confirmation candles.
🔻 Short Setup:
Price forms a Higher High.
Wait for a rejection candle (long wick, body closes inside previous range).
Confirm structure break and take short entry on confirmation.
✅ Example: On the left side of the chart, price printed a HH, followed by a strong rejection candle. That led to a clean move downward.
🔺 Long Setup:
Price forms a Lower Low.
Watch for a rejection candle near key support.
Enter long trade after confirmation.
✅ Example: Mid-chart shows price breaking to LL, then instantly rejecting with a strong bullish candle. Followed by a sustained move up.
🔴 Current Price Action:
Price is testing a potential new Higher High.
📌 Strategy suggests: Wait for a bearish rejection candle before shorting!
📈 Strategy Benefits:
Avoids impulsive entries
Combines structure with candle logic
Great for reversal traders and range scalpers
🔥 Like & follow for more real-time trading ideas!
💬 Drop your thoughts or questions below – let’s grow together, traders! 💪
#ETHUSDT #PriceAction #RejectionCandle #TrendReversal #SupportResistance #Scalping #TradingStrategy #Crypto #ChartPatterns #TechnicalAnalysis