ETH USD ETH USD is at crucil support on both 200 EMA (1769)
on hourly chart and on support of trend line.
If not break trend line than posibilies to toch swing high of 1840
ONLY FOR EDUCATIONAL PURPOSE
ETHUSDT.3S trade ideas


A 'SouthAll' approach towards ETHUSDT.Hello Traders!
1. This analysis is mixed with various concepts; Elliot Waves, Volume, and Parabolic Movements. Hence the name 'Southall'.
2. The count is clearly stated on the chart. We're following almost the same pattern as we expect in BTC .
3. We see significant volume spikes in the selling zones and less volume in the buying zones. This also indicates the built-up selling pressure .
4. We also see ETH respecting two upward-sloping curves . The indication seems very clear.
5. I see the crypto markets as intrinsically bearish, at least till a new low is made.
Do use proper risk management.
Happy Trading!
Profits,
Market's Mechanic.

ETHERIUMSuggesting Buy on DIP we can see the buying from the 50% of this candle 1760 is looking good for buying let the levels hold and try to break this level buying till the previous high is gonna be good

Ethereum is ready for a Positional Trade on Weekly tfHello Traders,
Get ready to play a positional trade in ethereum on weekly tf.
The correction was started from the levels of 4868 in Nov2021 and after 18 months of correction the ethereum is getting ready for an uptrend.
Let's understand the technical data
ema(20,50,200) - Buy
ema(100) will act as a Resistance1
Level 2023 will act as a Resistance2
Breakout of the channel line.
MACD - Bullish Crossover
- Histogram is building momentum
Bollinger Band - Squeezed
The price confirms the uptrend on the breakout of 2023 level (Resistance2)
The overall chart structure also shows the signals of an bull run.
Thanks and keep trading
Er. Simranjit Singh Virdi

Breakout or Breakdown in Ethereum on 30m and 4H TF Hello Traders,
I am tracking the ethereum on 30m and 4h time frame.
On 30m chart
- Bollinger Band Squeezed
- ema(20,50,100,200) lies in between the Bollinger Bands
- RSI Neutral
- MACD Neutral
From these levels we can get a good trade on either side.
Wait for the breakout or breakdown and enter the trade in that direction, a good small trade can be executed.
On 4H chart
- Bollinger band expands
- Price is at the middle line
- sma(20) coincides with the support/resistance level
- Intraday move decides the direction for swing trade.
Happy trading and keep learning.
Thanks
Er. Simranjit S Virdi

[Crypto] ETHUSDT Buy IdeaNote -
One of the best forms of Price Action is to not try to predict at all. Instead of that, ACT on the price. So, this chart tells at "where" to act in "what direction. Unless it triggers, like, let's say the candle doesn't break the level which says "Buy if it breaks", You should not buy at all.
=======
I use shorthands for my trades.
"Positional" - means You can carry these positions and I do not see sharp volatility ahead. (I tally upcoming events and many small kinds of stuff to my own tiny capacity.)
"Intraday" -means You must close this position at any cost by the end of the day.
"Theta" , "Bounce" , "3BB" or "Entropy" - My own systems.
=======
I won't personally follow any rules. If I "think" (It is never gut feel. It is always some reason.) the trade is wrong, I may take reverse trade. I may carry forward an intraday position. What is meant here - You shouldn't follow me because I may miss updating. You should follow the system I share.
=======
Like -
Always follow a stop loss.
In the case of Intraday trades, it is mostly the "Day's High".
In the case of Positional trades, it is mostly the previous swings.
I do not use Stop Loss most of the time. But I manage my risk with options as I do most of the trades using derivatives.
=======

Ethereum Short Position . 1 Day ChartEntry 1475-1427$
Target 1012$
Dynamic Stoploss 1671$
All the Best

Ethereum Long Position 1 Day ChartEthereum Long Position 1 Day Chart
Entry 1322
Target 1724
Stop Loss 1220
All The Best

Ethereum Long Position Analysis After Completed 1st Target , New target is 2000$ ,If ETH Braked 2000$ resistance Than We are entering in Bull Market.

ethusdt short scalping tradeethusdt multipel time analysis
ethusdt ones break level it will give good target
downside
!!!!!!!! goood luck!!!

ETH extended 5th wave ?I am counting the waves of eth as showing in chart .
Current price at 1575
5th wave may extended for the target of 2000 in march or April 2023 month.
We can see 4th wave was inverted flat and shllow so there is a high probability to be extended 5th wave.
Stop loss for BUY 1575 is near 1460 low for the target of 2000

Update on ETH / check previous eth analysis tooeth could show some more down move, if you haven't checked my previous eth analysis, then do check where I have provided a short opportunity
Also do folllow,like and comment ..


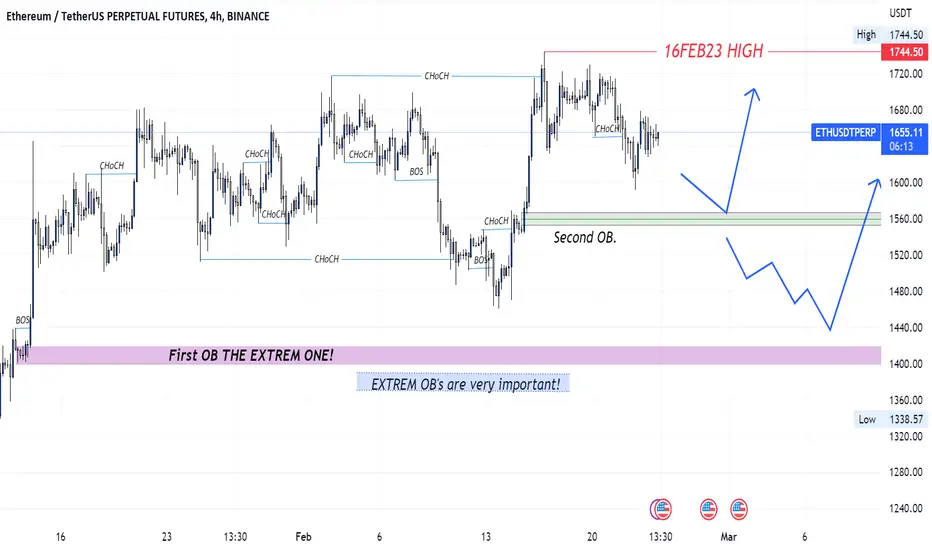
THIS IS ETHEREUM TETHERUSETHEREUM is in UP trend moving UP since 01JAN23 on 14JAN23 we can see HUGE BULL CANDLE and I found my BOS so I marked my OB first OB on 4H.
On 15FEB23 saw couple of BIG BULL CANDLE and that's my second OB.
ETHEREUM market showing BIG CANDLES with BIG WICKS!
If market break second OB and went down then what? NO WORRIES!!!
Because we have EXTREME OB already and never underestimate the Extreme OB so our first OB is UNMITIGATE since 13JAN23 once first OB mitigate we can go for LONG and we can use Trailing SL.
Ethereum short
Ethereum doing a hangman on the 2 hour chart showing some buying exhaustion and it is also very close to a resistance.
The sell is just below the weekly VWAP with an exit in the high volume area of the book.
Note - If the asset breaks the resistance upwards, it does not take the buy order

Eth on daily time frame with supp resis & fib retraceOn the daily timeframe, I analyzed ETH's price action using support, resistance, and Fibonacci retracements. Currently, ETH is finding support near the 50-day moving average and near the support level of $1554. If it breaks below this level, the next support level is at the Fibonacci value of 0.382, around $1490. The next Fibonacci value of 0.5 is at $1402. On the upside, there is resistance near $1718 and $1909. By looking at the chart, you can see the 20-day moving average (green), the 50-day moving average (yellow), and the 200-day moving average (red).
Note: Technical analysis can be a helpful tool for traders, but it's important to remember that the market can be unpredictable, and past performance does not guarantee future results. Always use proper risk management and keep up-to-date with market news and events that may impact your trades.

ETH FORMED BULLISH HARMONIC PATTERN ETH clearly moving long towards 1620 after that again we will see the downwards correction.
#Bitcoin #nft #bnb #eth #btc #BSC #Binance #trading #altcoins #cryptocurrency #crypto #sol

eth death is still on play if u r on long be carefullbearish flag pattern on higher time frame
eth death is still on play if u r on long be carefull
if eth falls matic shiba & all eth based coins will fall
eth to fall all time low BINANCE:ETHUSDT BITSTAMP:ETHUSD CRYPTOCAP:ETH

Track the correction on 30min in Ethereum to catch the big move.Candlestick Chart
+ The moving average lines are contracted.
+ Track the price until it crosses either 50ema or 100ema lines.
+ It may test the level of 200ema to end its correction.
+ So, the levels of 1600 to 1626 may be tested to complete the correction.
Renko Chart (Brick Size = 7.5)
+ Fibonacci Retracement
The price can test the level of 1626 which is 38% level of retracement.
Conclusion:
1. The coin is in the correction mode.
2. Wait for the correction to be completed.
Thanks
Er. Simranjit Singh Virdi

Ethereum analysis on the daily timeframe with supp & resisBased on the daily timeframe analysis of Ethereum (ETH), we can observe that the cryptocurrency is currently facing important support and resistance levels. If the daily candle closes below 1681, we may see a pullback to the Fibonacci retracement levels of 0.382 and 0.5, which are located at around 1400. This area could serve as a significant support level, where buyers may step in and push the price higher. However, if the daily candle closes above 1681, we may see a rally towards the resistance levels of 1753 and 1896. These levels may pose challenges for buyers as the price could encounter selling pressure and struggle to move past them. Traders and investors should keep a close eye on the price action near these key levels, as they may provide useful insights for making trading decisions. It is important to remember that technical analysis is only one aspect of the market and should be considered alongside other factors before making any investment decisions.


Ethereum long on demanda area.Buying in an area of demand formation, you can look for an entry to the market waiting for price action to confirm the area.
Here it is on the daily chart where we already have a decrease in sales volume and an insideBar formation. Not a financial advice.
